

Today Michael Oliver, the man who is well known for his deadly accurate forecasts on stocks, bonds, and major markets, allowed King World News exclusively to share with our global audience one of MSA’s most important gold updates they have ever issued. Everyone interested in preserving their wealth in these turbulent times needs to read this.
You Need To Understand Why The Big Picture For Gold Is Bullish
March 9 (King World News) – Michael Oliver, founder of MSA Research: Much of the current popular technical commentary about gold is based on price chart comparisons, lookbacks, and supposed recurring “wave patterns” that are assumed to be carved in stone. Price is the point and focus of the analysis out there, most of it bearish.
Not by MSA, though.
Arrows note the two prior major long-term trend change signals rendered by MSA going back to the October 2011 peak.
RED ARROW MSA Signaled A Bear Market In Gold Was Beginning
GREEN ARROW MSA Signaled A Bull Market For Gold Was Starting
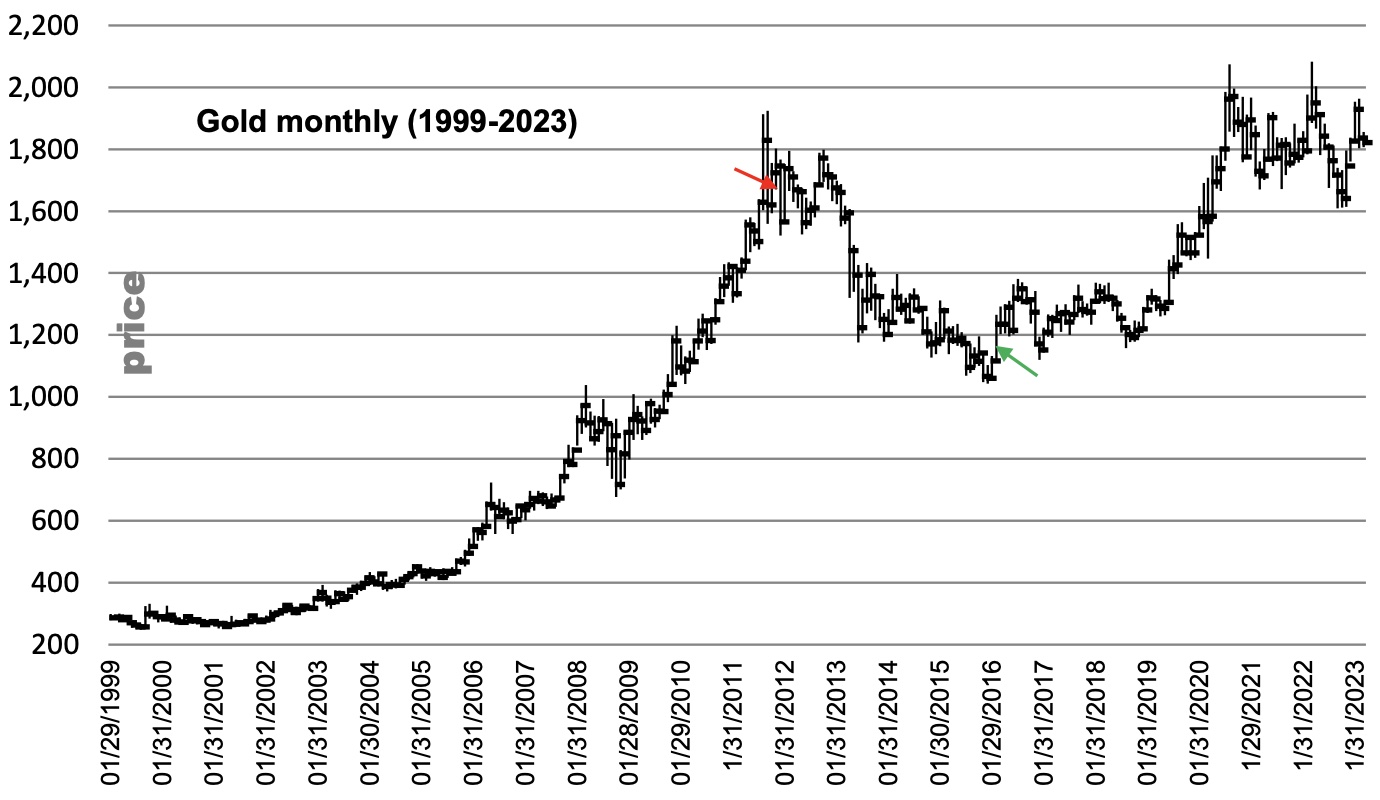
January 2012 (red arrow): a major bear signal. Topping was the process, we argued, not congestion. Though at the time many thought it was merely a congestion zone before more upside.
February 2016 (green arrow): a major annual momentum-based buy signal.
Current Situation
Current situation: we predefined the downside price chart breakage in summer 2022 as a bear trap. Meaning a false price chart trend indication. We argued that the overall up/down action since 2020 would ultimately be seen as congestive, not topping.
Now let’s look at some comparative price charts.
Here’s the price chart overlay that many chartists have been fixated on for the past year. It includes the 2011 and 2012 top and the “topping” action since mid-2020. A magnificent technical overlay and predictive for the coming action, or so they argued.
Similar But Completely Different Outcomes

The popular assumption was that when price broke below the floor at $1675 last summer, gold was on course to do what it did back in early 2013 when it took out a prior clear floor at $1550. Collapse! Bear market fully underway! Back then MSA agreed with that downside breakout price chart action in advance (it was lagged to an already broken annual momentum). Not so this time around.
We argued this time that the seeming nice price chart fit wasn’t going to sustain. Yes, gold blew its obvious “floor” just as it did in April 2013, no doubt purging many gold longs.
But this time, instead of a crash event after that breakage, gold only dropped another 3% or so below the $1675 floor—that everyone could see—and spun its wheels sideways for two months before aborting back up towards the upper end of the 2020 to 2022 price zone. Oops! I guess the price chart overlay didn’t work out for most technicians. Yet they still scream “Bear!” every time there are downticks…
ALERT:
Legendary investors are buying share of a company very few people know about. To find out which company CLICK HERE OR ON THE IMAGE BELOW.
 Sponsored
MSA argues that downswings now in gold and silver are best assumed to be counter-trend selloffs, and that the false breakage last summer was a wrap-up of the bear case. Subsequent events demonstrated it was a false topping action.
Gold is trading today in the $1820s. That’s where it closed 2021 and 2022 (the year of multiple sharp Fed rate hikes). Find a major asset category—the stock market, bond market, real estate—that’s doing that well and withstanding the supposed god-like pressures of the Fed and other central bank policies.
Perhaps gold doesn’t react to events. Think about it. Instead it anticipates future events.
Okay. On the next page we’re going to play the price pattern/overlay game. Except this time we’re paying attention to current behavior and gold’s behavior in prior years just before blowing heads off on the upside.
Price patterns to overlay on the current action
In the middle of the major 2000 to 2011 bull market in gold (almost an eightfold advance from $250 to $1920), there was a two-year-wide zone of confusion and even outright panic at one point in October 2008.
Instead of looking at lows this time, let’s look at the arrangement of the highs. Peak just over $1000 in early 2008, then another high just a tad below $1000 in July 2008, followed by a plunge, one that broke a clear trendline. But only a shallow follow-through below that point of price chart breakage. Then a (rapid) recovery back up to the upper end of the prior zone of distribution at $1000. Then the sellers came in again a third time to distribute around that big, round number. What the heck! Why not, they reasoned—short it and risk a nickel! And so again gold dropped back from the $1000 area to $865 between February and April 2009, as circled. Frustrating for the bulls, no doubt.
GOLD: Up, Up And Away After False Sell Signal In 2008
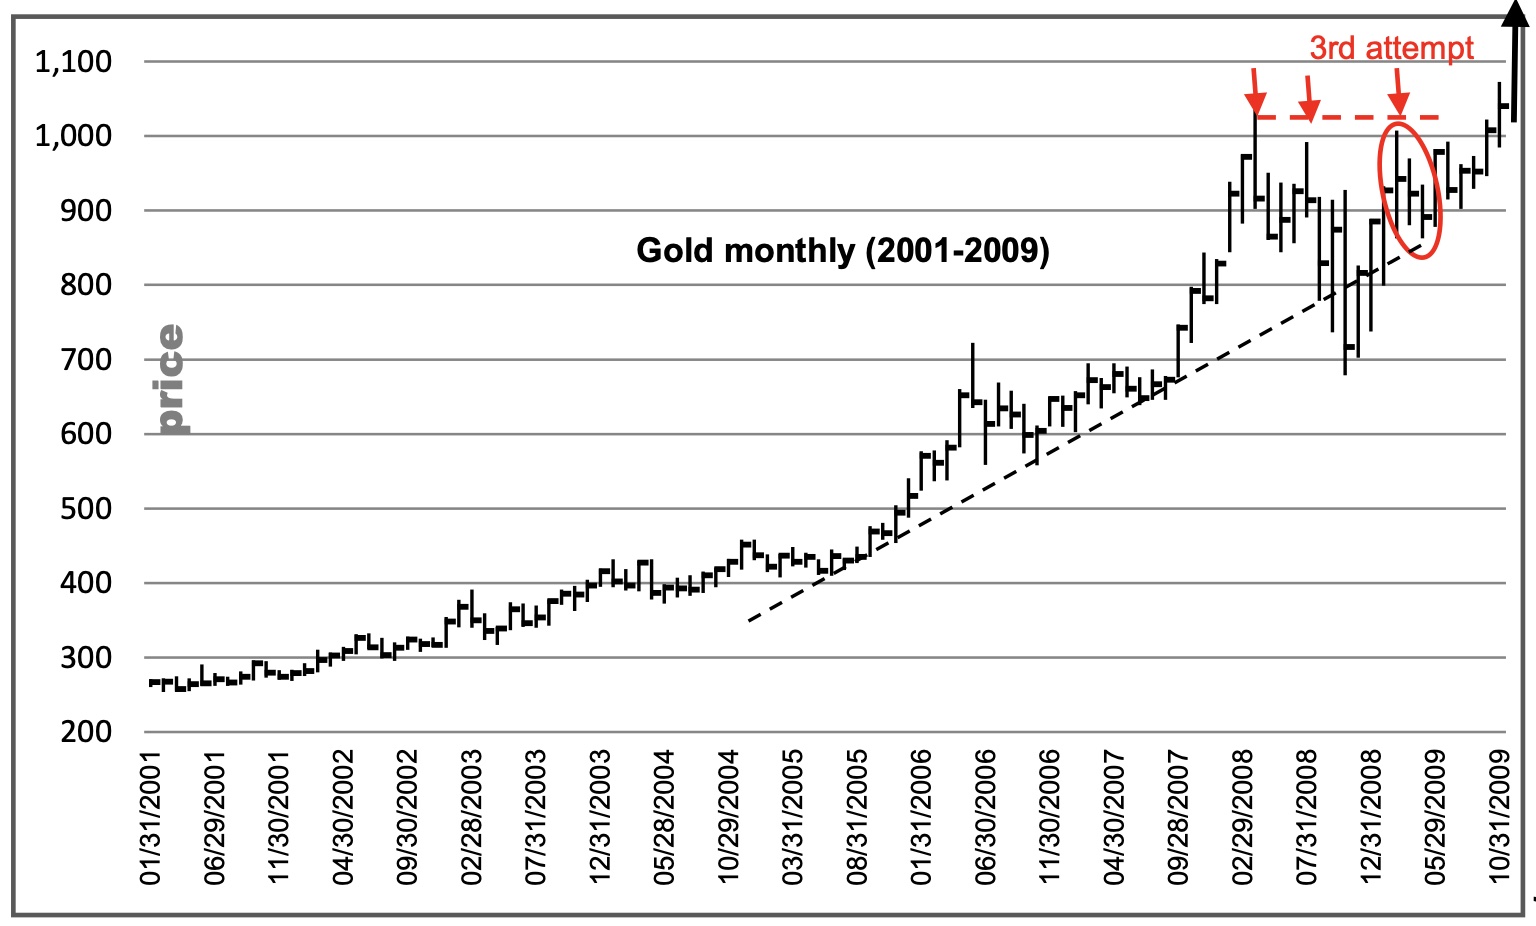
It’s the next up move, the fourth upturn, that blew the heads off the shorts. It moved above the prior highs in that fourth attempt and gold began its move from that $1000 price zone to $1920 over the next two years.
Here is the next chart to overlay on the current market.
SIMILAR TO 2019:
A Gold Blastoff Will Repeat In 2023
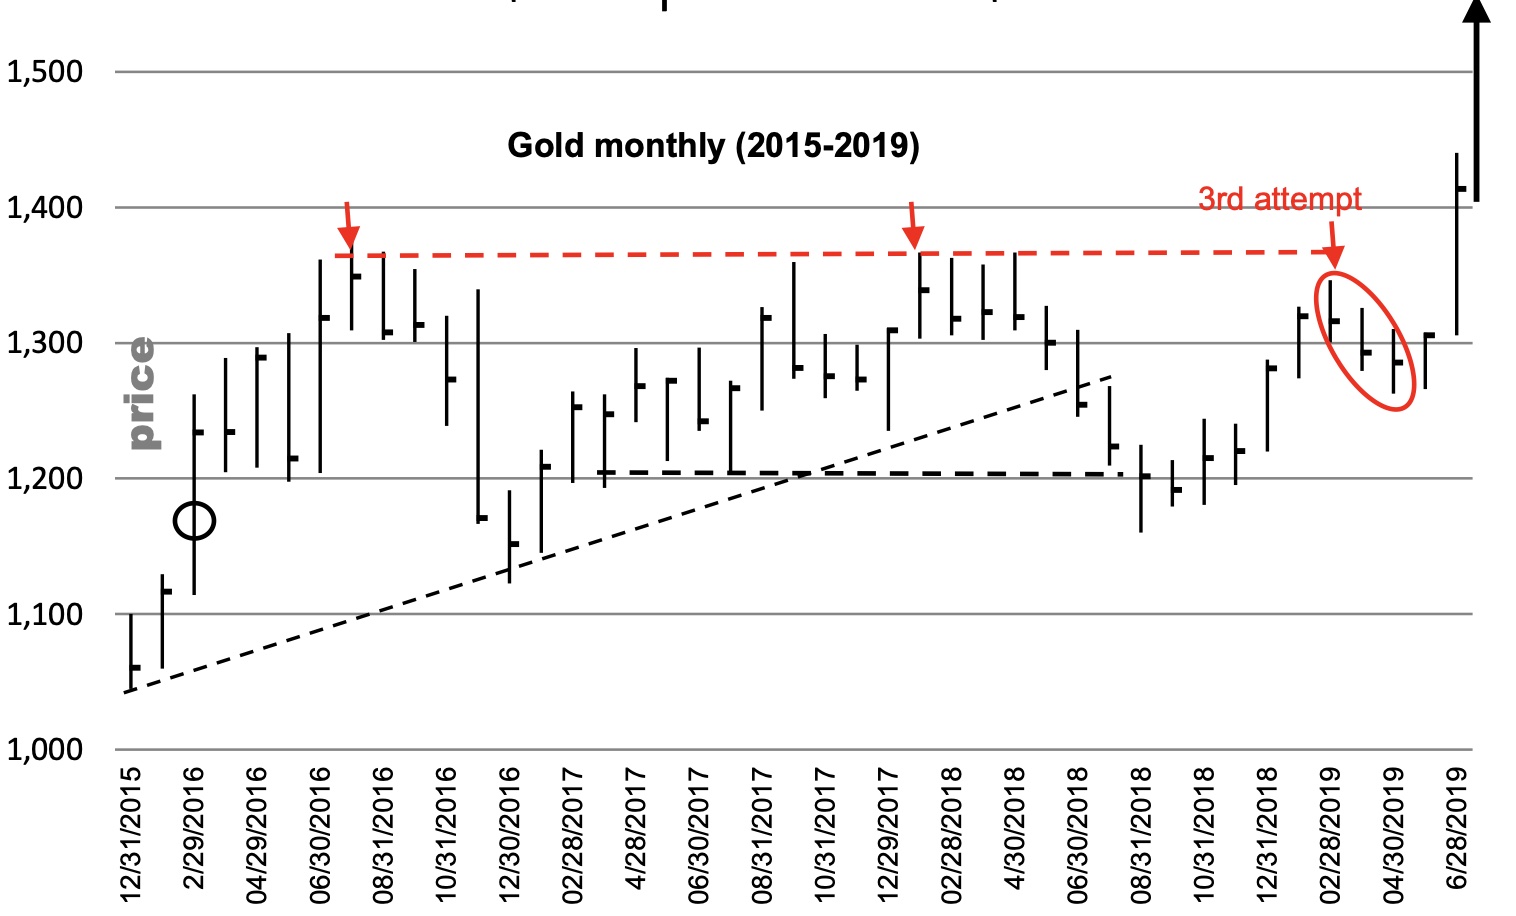
After the bear low in December 2015 at $1046, gold turned up in price. Early in that upturn, in February 2016, annual momentum (not shown here) broke out above a massive and clear base signaling a bull trend being born (black circle). We beat the table on that.
The first surge carried to $1370+, followed by a sharp drop into late 2016.
Then the next advance (a complex one) saw price again reach up to what would be a clear ceiling. The top price in early 2018 was $1365 (second arrow). That was followed by a price drop that turned many heads and brought the bears all out again. Why? Because in that drop the price action broke a clear, multi-point uptrend and took out some significant prior lows. (Shortly after that low, MSA issued reports making the case for a resurgence back to the old ceiling. We weren’t impressed by the drop. That summer 2018 decline didn’t alter our positive assessment.) But for the price chart watchers, it must be a bear! Right?!…
ALERT:
Billionaire mining legend Pierre Lassonde has been buying large blocks of shares in this gold exploration company and believes the stock is set to soar more than 150% in the next 6 months. To find out which company CLICK HERE OR ON THE IMAGE BELOW.
 Sponsored
But alas, the action gelled soon after that drop, and by early 2019 price had probed back up near the prior ceiling. But sellers came in on that third rally and shorted just below the ceiling. Why not? Risk a nickel! But that next decline (6%) only lasted a few months and didn’t drop back to the prior lows. It turned out to be a brief downturn only from the developed ceiling. The fourth upturn did the trick. It drove gold into new highs and within a year gold had surged over $2000.
Current market
There have been dual highs intramonth well over $2000, with peak monthly closes at $1970 and just below $1950. Then came the drop that turned all heads, again following the second peak. A range bottom blown out, just like after the 2011 to 2012 topping zone! But the consequence was only a further 3% or so drop, then a turnaround back above the price chart floor with a surge up to $1959 intramonth high. Sellers were waiting there at that third surge high and sold, no doubt risking the difference just below the old peaks, especially the old monthly closing highs. Risk a nickel game.
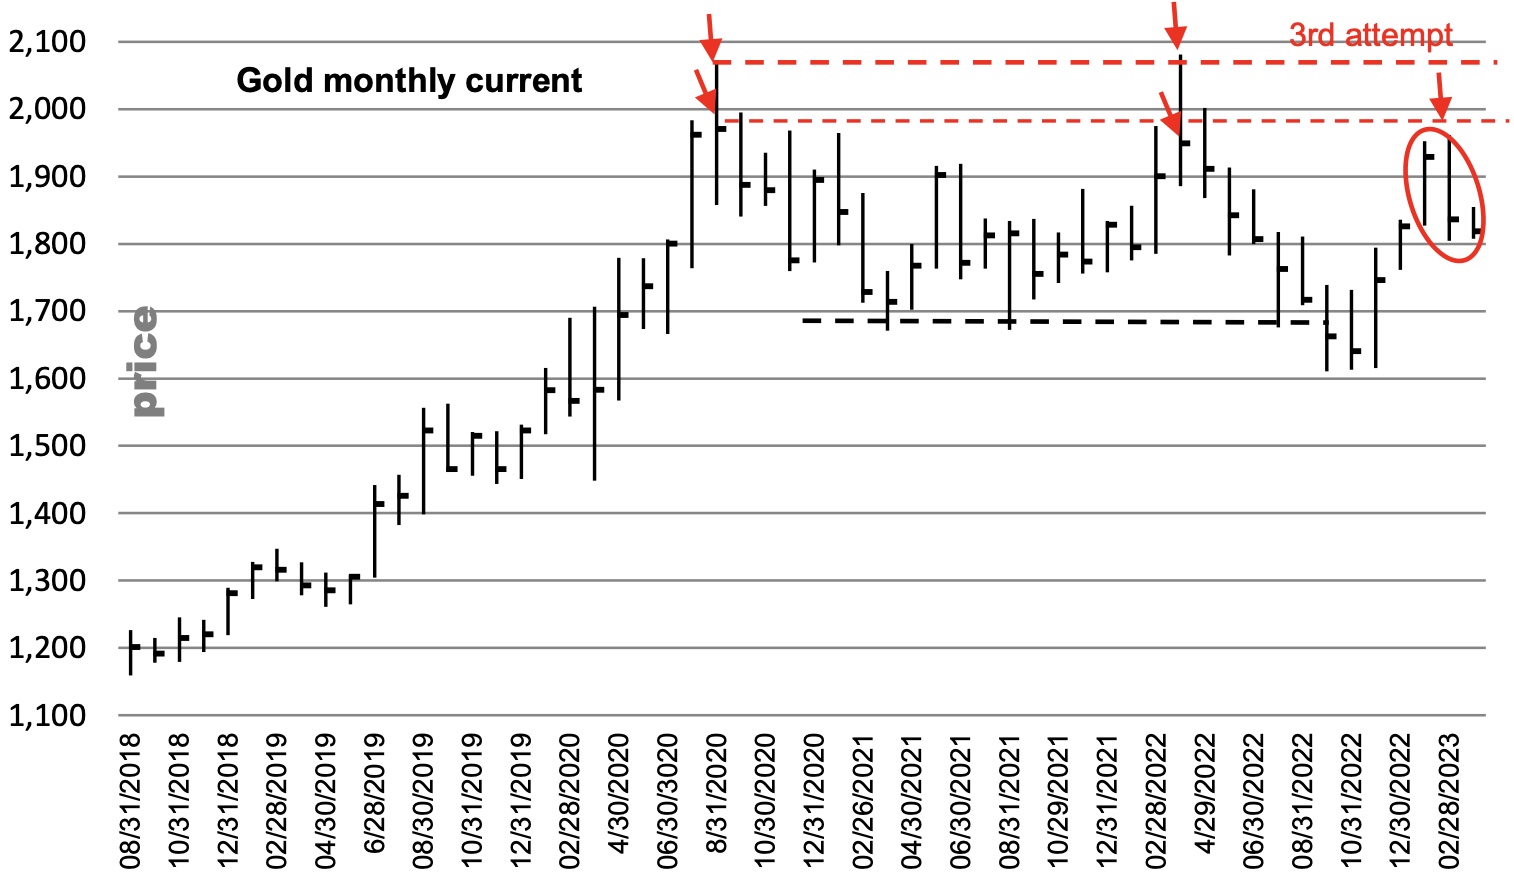
Now we’re getting a drop. If the two prior patterns hold, as we suspect they will, then this drop won’t sustain. It’s the next upturn—the fourth turn—back up to those old highs — that must be watched for. So—if you like price chart overlays and comparisons, then nail these to your trading room wall.
We don’t know of anyone who has made these comparisons, as everyone is convinced of a gold bear. To receive the special KWN discount to subscribe to Michael Oliver’s internationally acclaimed MSA Annual Research which is used by so many serious investors all over the world CLICK HERE.
ALSO JUST RELEASED: The Crumbling World Financial System Desperately Needs A Gold Anchor CLICK HERE.
ALSO JUST RELEASED: Celente – Major Businesses Are Now Fleeing U.S. Cities CLICK HERE.
ALSO JUST RELEASED: What’s Next After First Gold Price Dip Since Central Bank Gold Buying Spree Began CLICK HERE.
ALSO JUST RELEASED: Systemic Breakdown Is Accelerating And It Is Deliberate CLICK HERE.
ALSO RELEASED: Here’s Why The Dow Plunged 500 Today And Gold Is Down $35 CLICK HERE.
ALSO RELEASED: LOOK AT THIS: Now That Is One Hell Of A Collapse CLICK HERE.
ALSO RELEASED: Silver About To Radically Outperform Gold, Plus The Bear Market Is Over? Not Likely CLICK HERE.
ALSO RELEASED: CALIFORNIA DREAM OR A NIGHTMARE: This Is How Bad It Has Gotten In The United States CLICK HERE.
© 2023 by King World News®. All Rights Reserved. This material may not be published, broadcast, rewritten, or redistributed. However, linking directly to the articles is permitted and encouraged.


