

What’s next after the first gold price dip since the central bank gold buying spree began?
First Gold Dip Since Central Bank Buying Spree
March 8 (King World News) – Paul Wong, Chief Market Strategist at Sprott Asset Management: First gold dip since central bank buying spree.
Key Takeaways
- Gold prices fell in February to largely reverse year-to-date gains but remain above late-2022 lows and important support levels.
- Central banks have been buying gold at record rates — more than three times their long-term averages.
- Volatility in the macro environment continues as investors show renewed uncertainty about inflation and interest rates.
- Strength in the Shanghai gold premium indicates physical gold demand from Asia is continuing.
- We believe this shift is at an early stage and expect physical flows (rather than financial factors) to dominate gold pricing going forward.
February Review
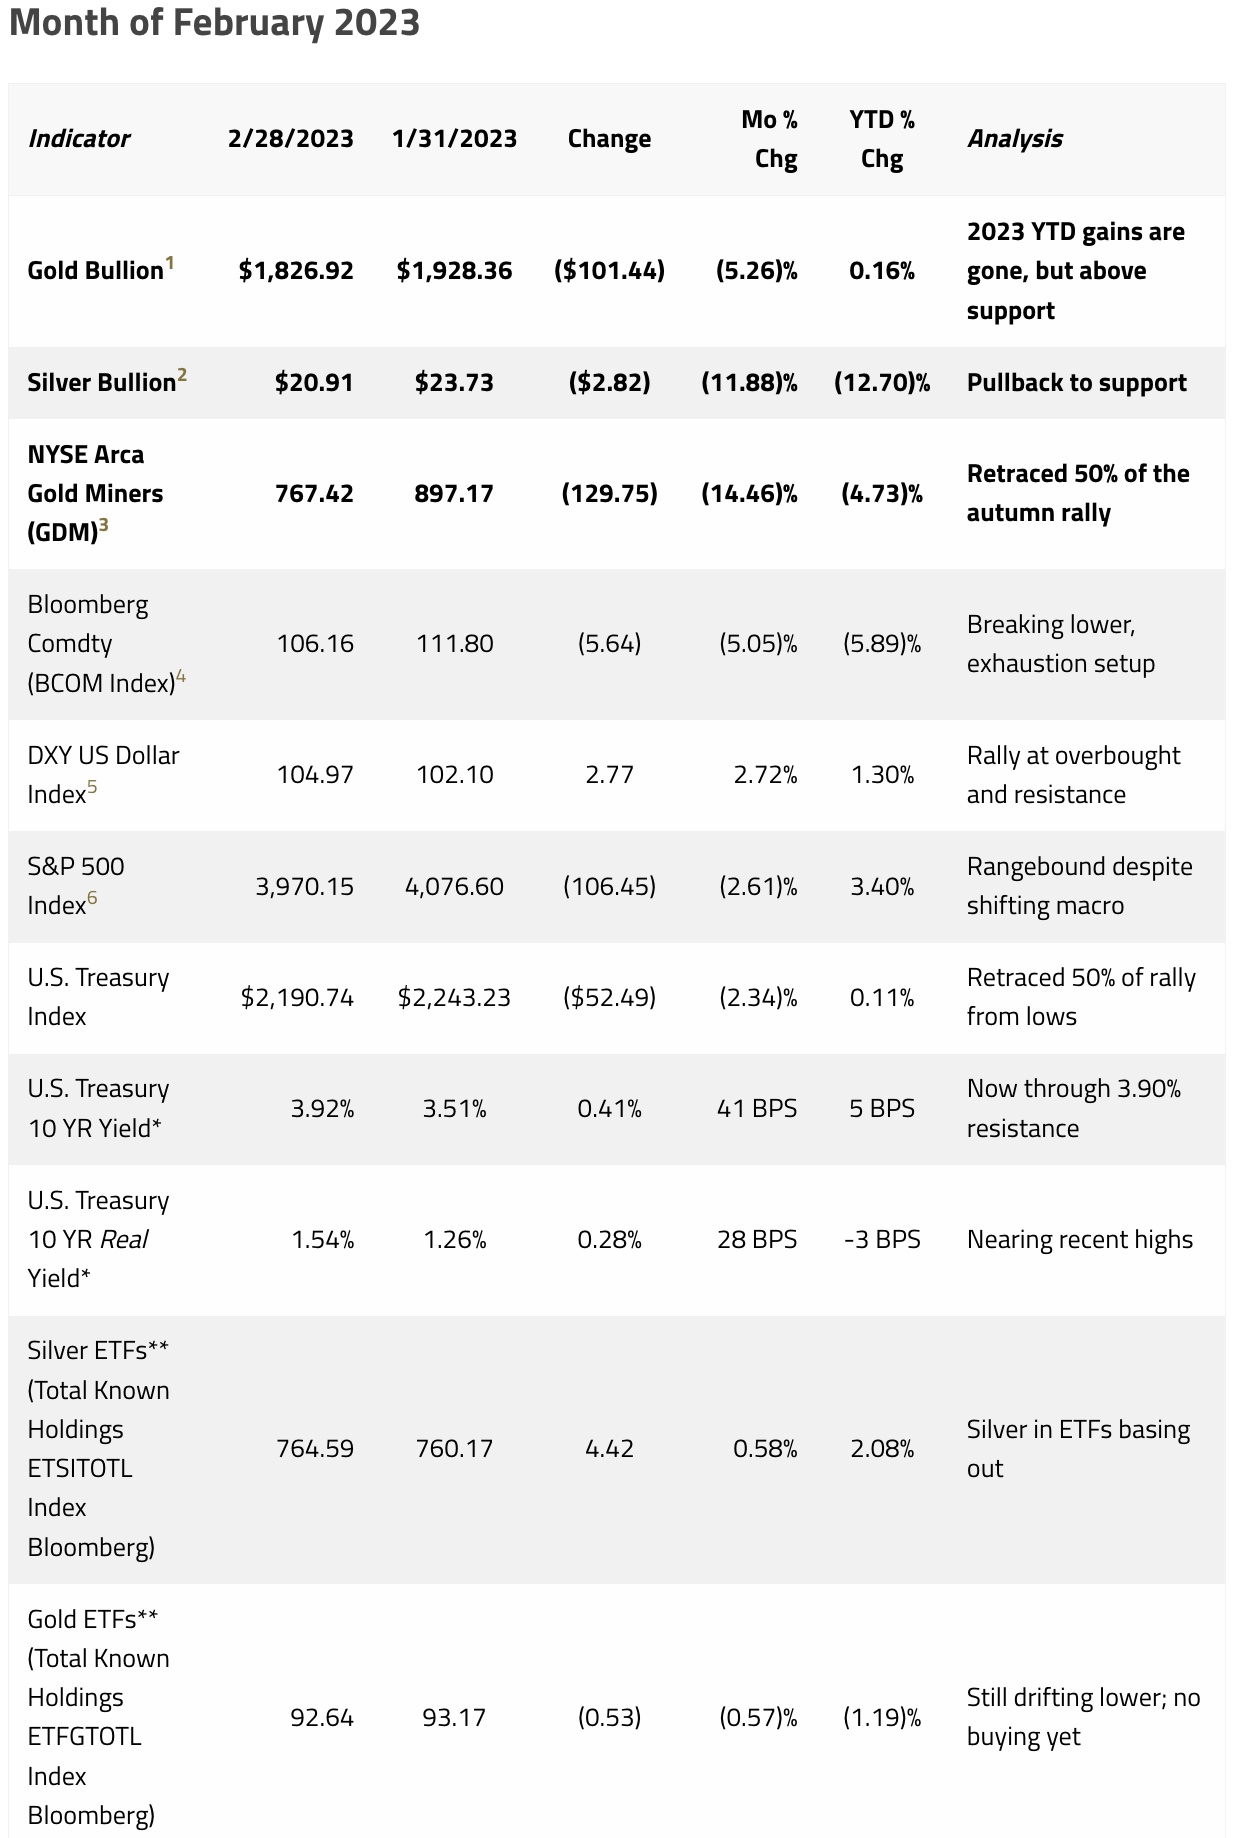
The gold spot price fell by $101.44 in February (down 5.26%) to close the month at $1,826.92/oz. This decline erased almost all of 2023’s year-to-date gains. However, gold is still up 12.61% from its lows in the autumn of 2022 and remains well above its 200-day moving average.
Strong buying from China’s “official sector” (possibly any combination of the People’s Bank of China, central bank-related entities or state banks) peaked in late January — just before the Lunar New Year — and has not resumed, but there is no indication of selling. Some profit-taking was observed from Shanghai trading desks but paled in size compared to demand from the official sector. We may see buying from other central banks, but that data will not be available for a few months.
Equity markets began the month on an upward trajectory on “forced-in buying” driven by option call volume, which was at an all-time high. Optimism about a soft landing for the U.S. economy began to give way to a “no-landing” scenario — that is, no slowing in the economy at all. The U.S. Federal Reserve (“Fed”) offered little pushback to easing financial conditions. By early February, markets were pricing in an “immaculate disinflation” scenario — a soft landing with declining inflation and no labor market pain.
Later in February, risk markets were affected by a series of data releases (e.g., January nonfarm payrolls, retail sales, the Institute for Supply Management services report and the producer price index) that pointed to a stronger-than-expected U.S. consumer seemingly immune to Fed rate hikes.
Less than three months ago, the consensus expectation was that the U.S. economy would enter a recession in the first half of 2023, leading to a Fed pause, followed by rate cuts in the second half of 2023. These hopes have been dashed, and the timing of possible rate cuts has been pushed out to early 2024. The market now expects a terminal Fed funds rate of 5.42%, 50 basis points higher than a month previously. This is a surprising change in expectations. The 2YR U.S. Treasury yield is now 4.82% (a new high) and the U.S. dollar has staged a sharp rally back to resistance levels. Macroeconomic volatility remains high.
Where Does the Gold Market Stand Today?
As of the end of February, gold had reversed its year-to-date gains but was still up 12.61% (or $204.56/oz) from its autumn 2022 low ($1,622 on 9/26/2022) and holding above its 200-day moving average. Gold also remained above the 50% Fibonacci retracement level of the trailing year.
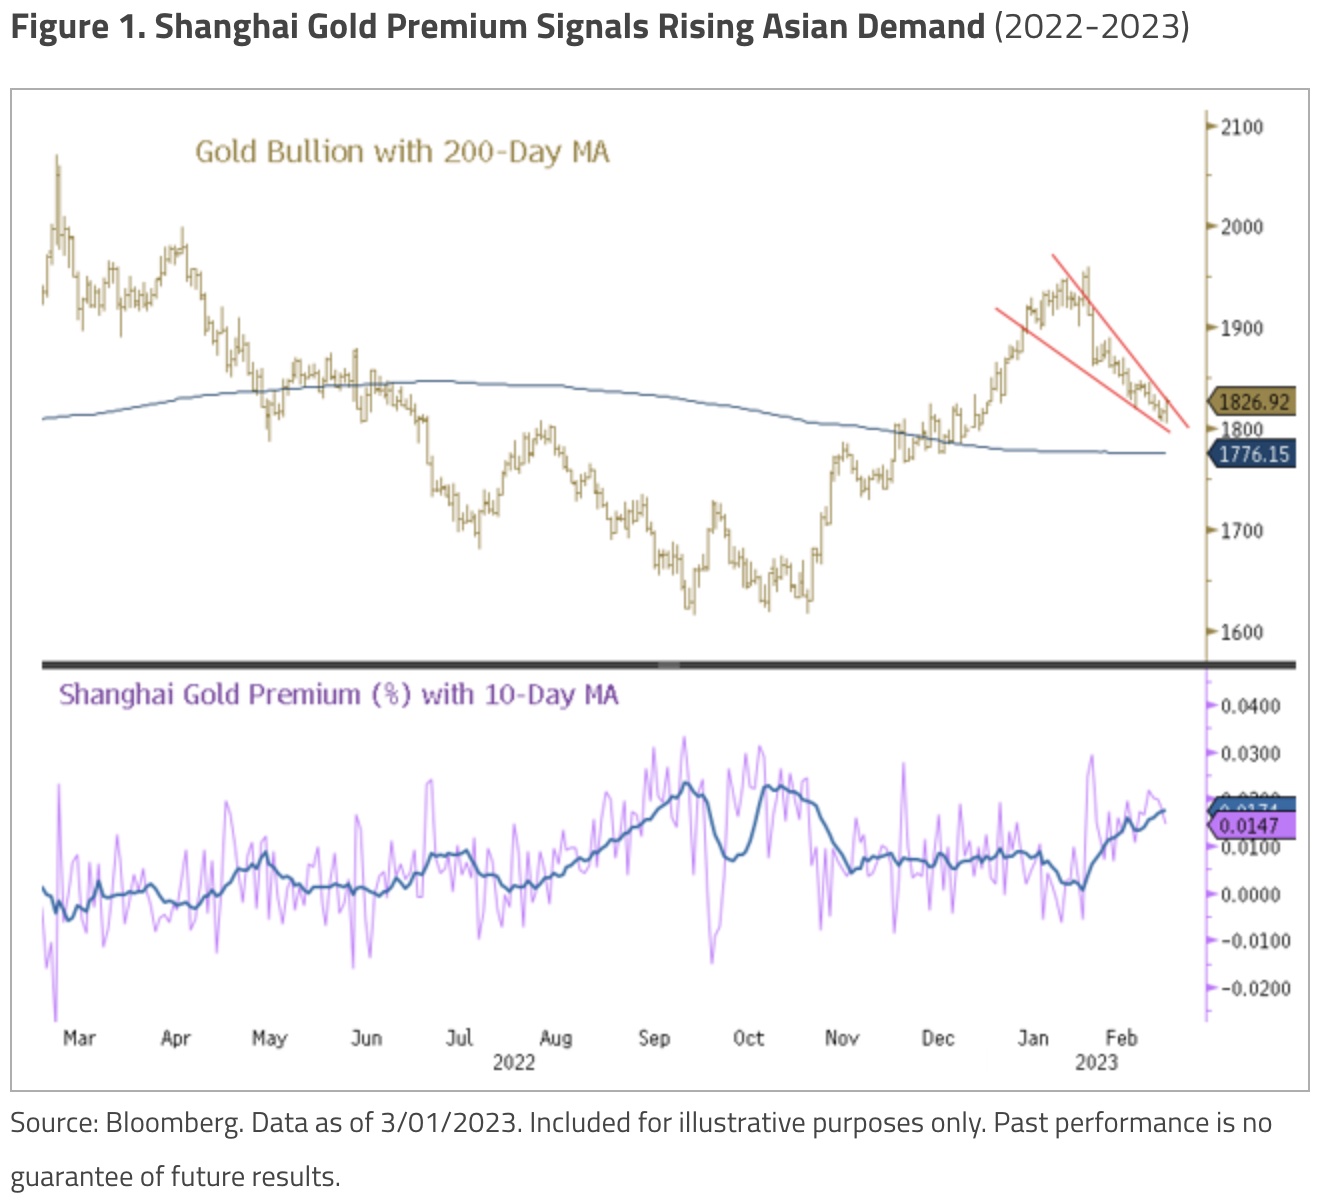
Figure 1 highlights the correction from the January 2023 gold price highs in context with the Shanghai gold premium. U.S. Commodity Futures Trading Commission (CFTC) data for February is not yet available, but holdings of gold ETFs remain in a steady decline. After a two-day sharp drop, gold ended February on a low-volatility decline. Technically, gold held well above its 200-day moving average and the 50% Fibonacci level and has shaped a descending wedge pattern (an exhaustion pattern).
The Shanghai gold premium represents the percent difference between reference prices on the Shanghai Gold Exchange and the LBMA (London Bullion Market Association) gold price — the global benchmark price. This premium remains elevated, as shown in the lower panel of Figure 1, indicating strong demand for physical gold in Asia.
Overall, February seems to be the first leg of a correction (a stall in buying, but not yet selling pressure) since the central bank demand-driven move up from the autumn 2022 low.
Macro Volatility Continues to Rise
Several key macro factors have not only caused inflation to increase but have also caused inflation volatility to rise. The Great Moderation — commonly defined as the period from the early 1990s to 2020 characterized by a reduction in the volatility of business cycles and financial markets compared with prior decades — continues to unwind and reverse. Deglobalization came to the forefront during the 2018 U.S.-China trade war. The COVID pandemic and Russia-Ukraine war exposed the risks in inventory supply chains, and geopolitical realities have accelerated the reshoring of supply chains. Commodities, including food, have become weaponized, as have currencies. Geopolitical strife is leading to rising nationalism and protectionism.
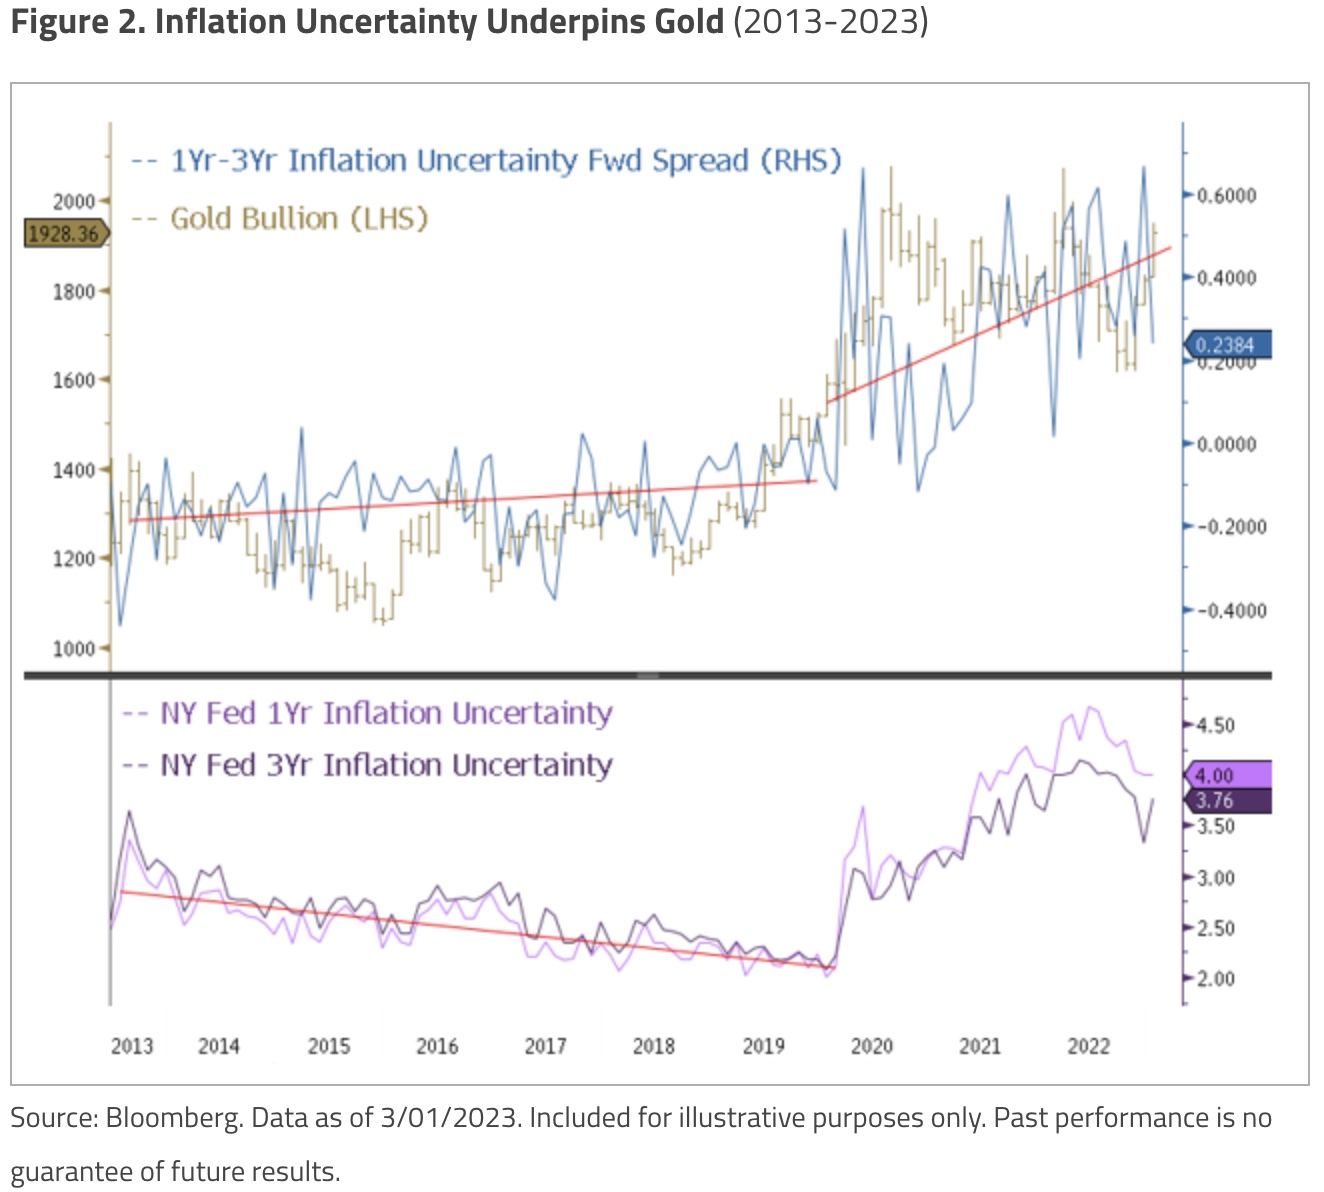
Figure 2 below highlights the Federal Reserve Bank of New York’s Inflation Uncertainty Indices. The upper panel shows a forward spread (one-year minus three-year inflation uncertainty). This forward curve has been in backwardation (one-year greater than three-year) since early 2020 and is in a rising trend. It indicates that inflation uncertainty (or volatility in inflation expectations) is not only elevated but still increasing. We overlaid gold bullion on this chart to illustrate the relation of gold prices to inflation uncertainty (r-squared = 0.56).
The lower panel of Figure 2 shows the one-year and three-year Inflation Uncertainty Indices for reference. Note that the pre-2020 declining trend in inflation uncertainty has long since ended.
If macro volatility itself is the cause of inflation uncertainty, then we will likely see inflation expectations priced higher. There are growing concerns that the market’s estimate of the real neutral interest rate, which neither
stimulates nor contracts growth, is understated as demonstrated by the U.S. labor market and consumers showing no signs of cracking despite aggressive Fed rate hikes. If so, the monetary response we have seen is not enough, and rates may need to go much higher.
Global Money Supply Surge Distorts Markets
The impressive risk rally from the 2022 autumn lows likely had an extra liquidity boost from a global surge in the money supply.
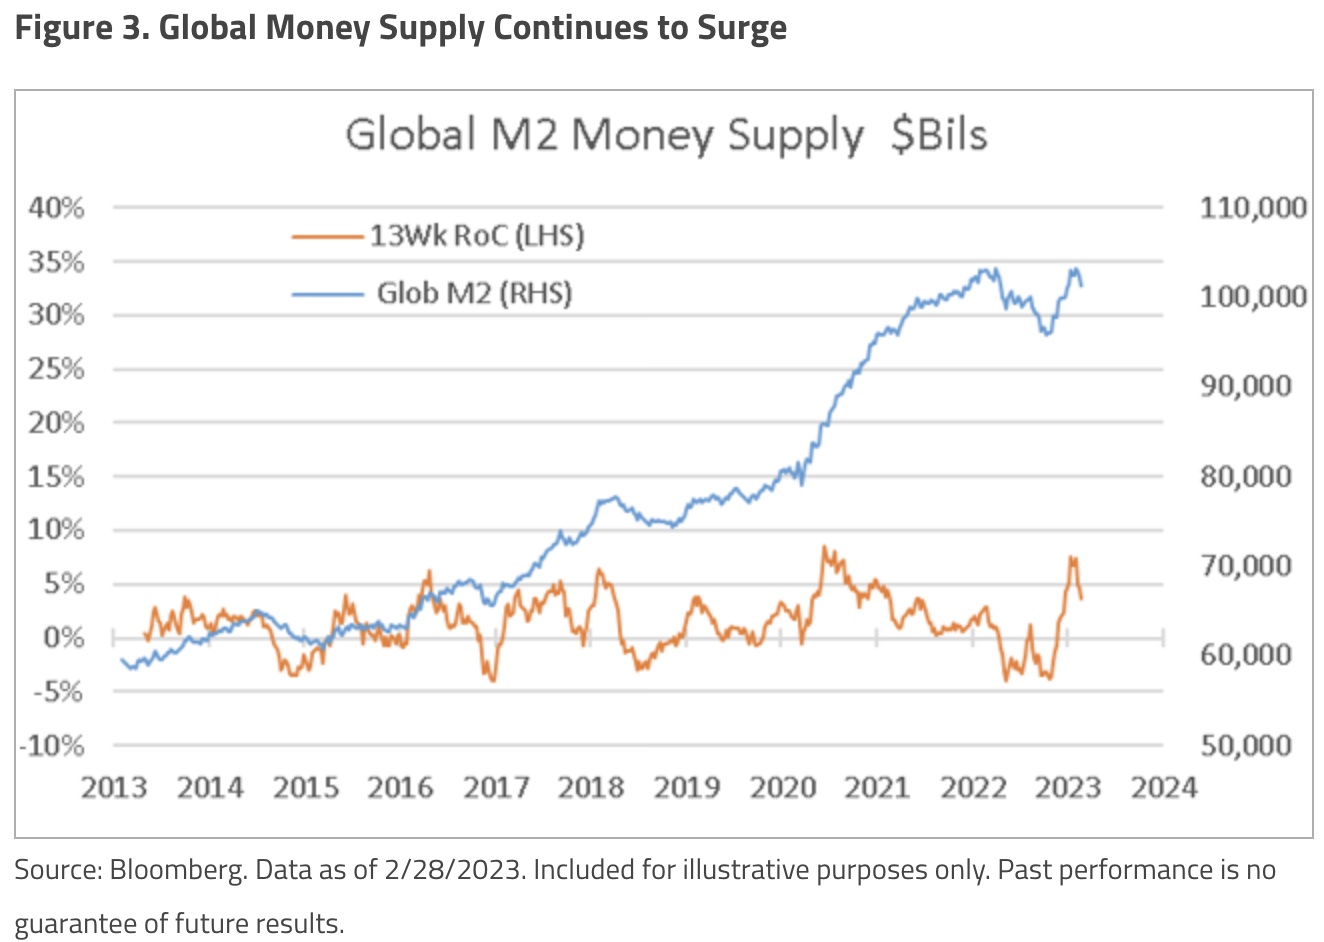
Figure 3 shows global M2 money supply in USD terms, calculated by combining M2 for the U.S., EU, China, Japan and eight other countries (approximately $102 trillion). Since early October 2022, the 13-week rate of change in global M2 increased significantly (up 7.5% or approximately $7.5 trillion). Most of this liquidity surge came from China, which was providing stimulus to combat its zero-COVID policy, and Japan, which was buying bonds to support its yield curve control (YCC) policy. Quantifying the degree to which this liquidity will affect asset price is difficult, but the effect may be considerable because liquidity is fungible across global assets.
However, the M2 surges in China and Japan are likely over, and there is a significant risk that they will reverse. China has reopened its economy following its zero-COVID policy and new central bank heads are being introduced. Bank of Japan governor Kuroda Haruhiko’s tenure expires in April, and the new governor, Kazuo Ueda, may begin to phase out YCC. If the recent rally in financial markets was liquidity-driven, speculative financial assets would probably roll over along with global M2, and we may see a separation between the performance of physical and financial assets. The swings in global M2 money supply will likely spark further market volatility.
Central Banks Buy Gold at Record Levels
Central banks have been buying record amounts of gold. The latest gold purchasing data shows central banks bought 417 tonnes in Q4 2022 (Figure 4). The data for Q3 2022 was revised upward to 445 tonnes from 399 tonnes. (For context, the average quarterly purchase since 2013 was 128 tonnes).
We have identified several reasons for central bank gold purchases over the past months. These include the need to diversify reserves due to sanctions risk, the poor performance of sovereign bonds in the face of high inflation, a desire for outside money and the de-dollarization process.
The current scale of central bank buying is massive — an annualized rate of 1,724 tonnes vs. an average of 512 tonnes over the past decade. Central bank gold purchases as a percentage of global gold demand have also tripled to 34% from their average of 11% over the past several years.

Why Gold Matters to Central Banks
Central banks hold a mix of assets as reserves to achieve specific policy objectives, which typically include maintaining exchange rate stability, providing liquidity in times of crisis, earning income on reserves and managing risks. According to 2021 International Monetary Fund (IMF) data, primary central bank reserve assets include:
- Foreign Currencies (63%): typically, major currencies (USD, euros, yen, etc.) held to support exchange rate stability, facilitate international trade and provide liquidity in times of crisis.
- Government Bonds (23%): typically bonds from high credit quality issuers, held to earn income and maintain a lower risk profile.
- Gold Bullion (7%): held as a store of value, for portfolio diversification and as a source of international liquidity.
- Other Assets (7%): mostly special drawing rights (SDRs), a form of international reserve asset created by the IMF, consisting of a basket of currencies that includes the U.S. dollar, euro, yen and British pound. Other financial instruments, though much less common, are equities, corporate bonds and/or commercial paper for income diversification.
A reserve manager at a central bank manages foreign exchange and gold reserves to ensure that the bank has enough on hand to meet its obligations and maintain financial system stability. Effective reserve management helps mitigate risks, optimize returns and ensure the bank can fulfill its mandate.
Central banks have held gold since their beginnings for several reasons. Gold as a reserve provides an internationally accepted store of value that has been a reliable hedge against inflation and currency devaluations. Gold helps to diversify portfolios and reduce exposure to currency and market risks. Gold is also a symbol of monetary stability, value and credibility to the public and other central banks. Holding gold as a reserve remains a widely accepted practice among central banks worldwide.
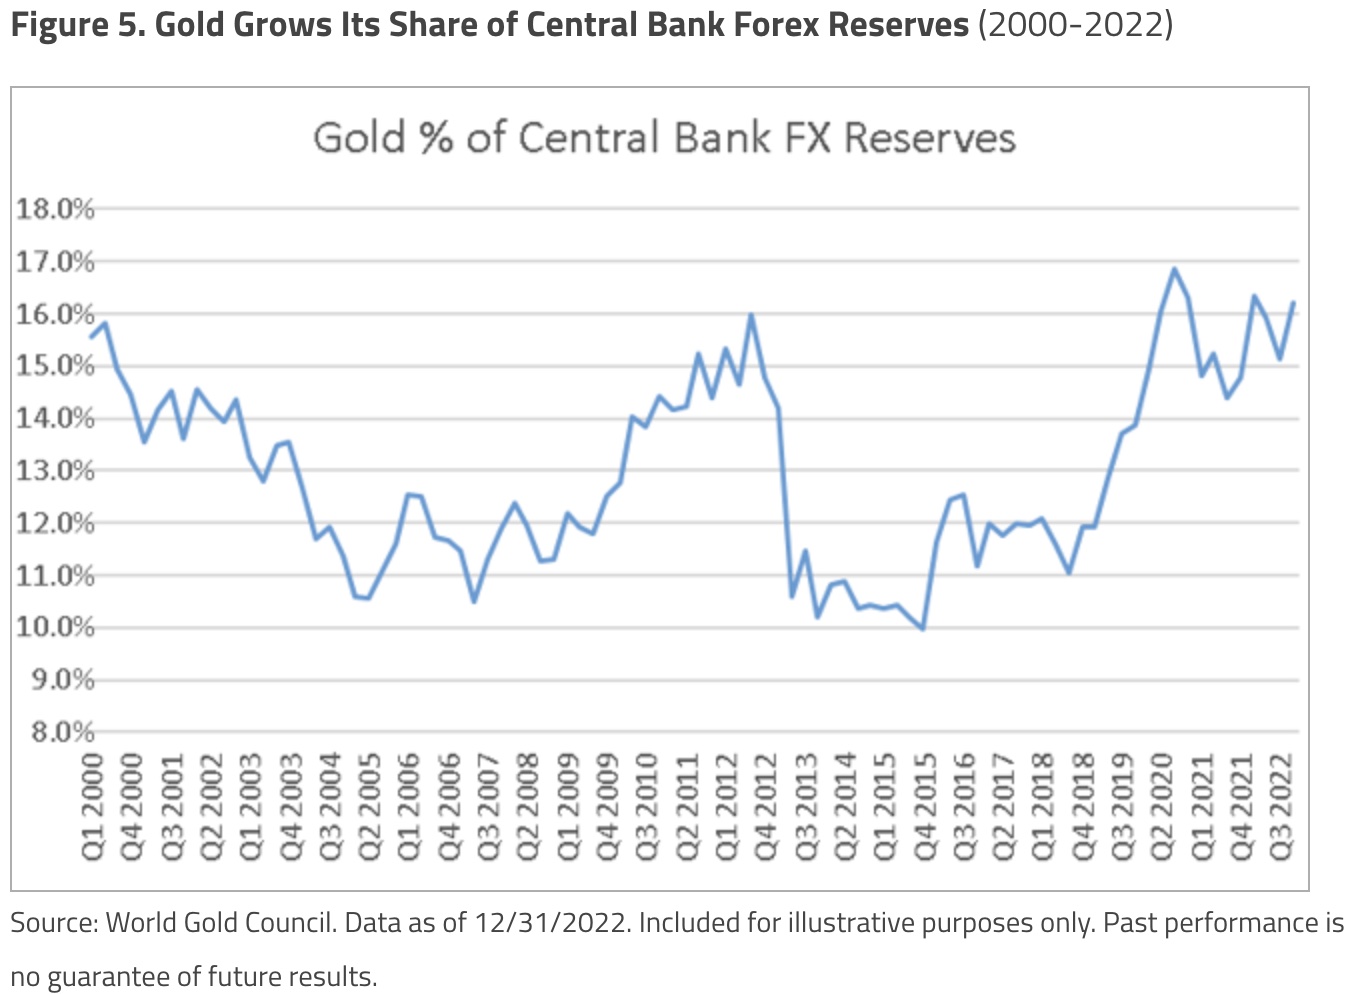
Central Bank Gold Holdings at a 50-Year High
A recent World Gold Council report noted that gold held in central banks has risen to its highest level in 50 years — estimated at 36,782 tonnes. Over the past several years, gold has steadily grown as a percentage of central banks’ foreign exchange reserves (see Figure 5). Given the seizure of Russia’s foreign exchange reserves, increasing U.S. dollar weaponization, growing deglobalization trends and the trend towards de-dollarization, we expect gold to increase as a percentage of foreign exchange reserves over the next few years. Rising geopolitical tensions would likely add fuel to this increase.
Gold Outperforms Other Central Bank Assets
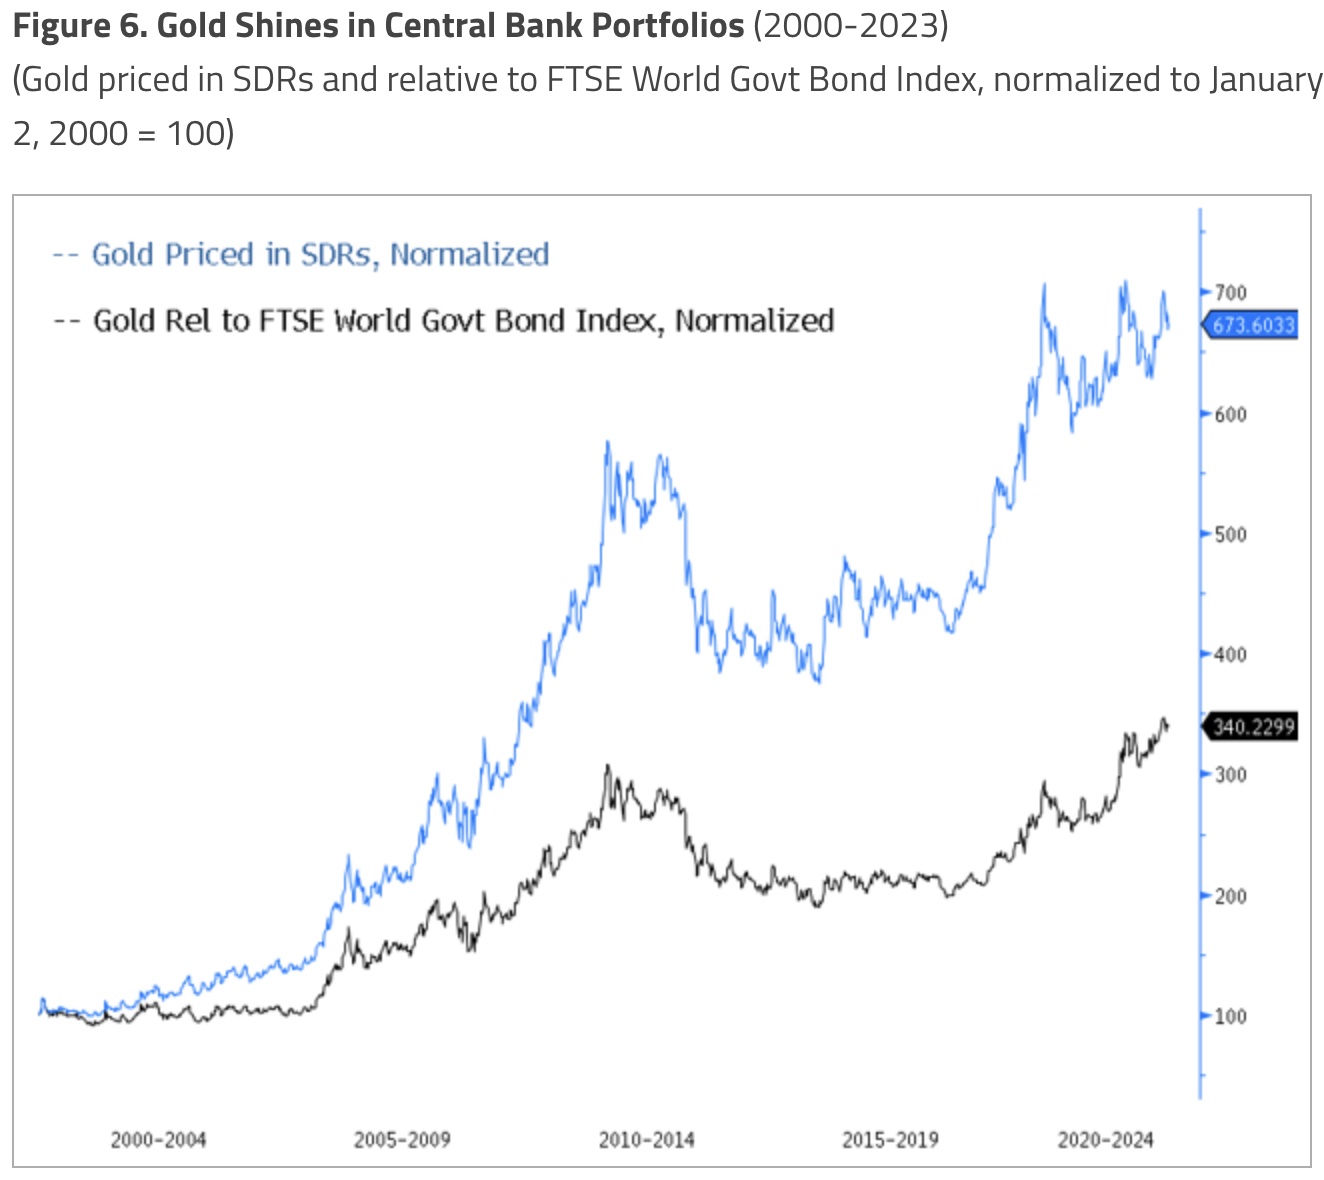
Central banks continue to favor gold because it is expected to hold its value through turbulent times and safeguard against possible reductions in the attractiveness of foreign currency assets in international financial markets. Unlike currencies and bonds, gold does not rely on any issuer or government (no one’s liability, i.e., outside money). Gold also enables central banks to diversify away from assets like U.S. Treasury bonds and the U.S. dollar, if desired.
In Figure 6, we show the performance of gold in special drawing rights (SDR) terms against the FTSE World Government Bond Index. Since 2000 — which can be considered long-term even by central bankers’ definition — gold has significantly outperformed both SDRs and bonds, beating SDRs by 6.7x and global bonds by 3.4x.
Gold Physical Flows Likely to Dominate Going Forward
Gold appears to have completed its first correction from its autumn lows in a manner typical of a low-event pullback. We believe we are in the early stages of gold-buying shifting dramatically to Asia, where physical flows — rather than financial factors such as real interest rates — dominate pricing dynamics.
Central bank buying has accelerated since early 2022 as geopolitical strife, deglobalization pressures, de-dollarization and secular inflation have threatened the value of central bank reserve assets. Macroeconomic volatility remains high and may increase further. The dramatic rise in the Fed’s expected terminal interest rate remains a greater risk to financial assets than to the economy, which has been resilient against rate hikes so far.
ALSO JUST RELEASED: Systemic Breakdown Is Accelerating And It Is Deliberate CLICK HERE.
ALSO JUST RELEASED: Here’s Why The Dow Plunged 500 Today And Gold Is Down $35 CLICK HERE.
ALSO JUST RELEASED: LOOK AT THIS: Now That Is One Hell Of A Collapse CLICK HERE.
ALSO JUST RELEASED: Silver About To Radically Outperform Gold, Plus The Bear Market Is Over? Not Likely CLICK HERE.
ALSO JUST RELEASED: CALIFORNIA DREAM OR A NIGHTMARE: This Is How Bad It Has Gotten In The United States CLICK HERE.
***To listen to Alasdair Macleod discuss the remarkable situation in the gold and silver markets CLICK HERE OR ON THE IMAGE BELOW.

© 2023 by King World News®. All Rights Reserved. This material may not be published, broadcast, rewritten, or redistributed. However, linking directly to the articles is permitted and encouraged.


