

Today Sprott came out with its top 10 things to watch in 2023. Every King World News reader around the globe should read this closely so they know what to keep a close eye on this year.
2023 Top 10 Watch List
De-Globalization and the Clean Energy Transition
January 17 (King World News) – Paul Wong, Market Strategist at Sprott Asset Management: This year’s top 10 list offers Sprott’s thoughts on what will likely drive markets in the coming year and decade, from a macro perspective and the vantage of our asset classes: Precious Metals and Energy Transition Materials.
We believe the global clean energy transition will grow more urgent as energy markets continue re-ordering and energy security becomes synonymous with national security. The signposts point to a commodity-intensive, inflationary and capital-intensive decade where energy transition materials and precious metals will become far more valued than in the prior market regime…
To Find Out Which Uranium Company Is Positioning Itself To Become A Powerhouse In Nevada Click Here Or On The Image Below.
The top 10 things we think investors should watch in 2023:
#1. De-Globalization and the Great De-Moderation
#2. Energy Markets are Realigning as Oil/Energy Trade Flows are Re-Ordered
#3. An Existential Commodity Supercycle as Competition for Commodities Increases
#4. Uranium: Clean Energy That Offers Secure Power Generation and Enhances National Security
#5. Copper: Structural Supply Deficit and Demand Shock
#6. Lithium: Battery TINA (There Is No Alternative)
#7. Energy Transition Metals Continue to Outperform
#8. Gold Bullion, Setting Up to Test the Upside in 2023
#9. Silver: Oversold Secular Low
#10. Gold Miners, Escape from Hyper Correlations
We break up our Top 10 Watch List into three categories: A) Global Macroeconomic Changes; B) Growing Demand for Energy Transition Materials; and C) The Important Role of Precious Metals.
Part A: Global Macroeconomic Changes
#1. De-Globalization and the Great De-Moderation
The “Great Moderation” occurred from the early 1990s to 2020 and was marked by low inflation, stable low economic growth and low macro volatility relative to prior decades (and centuries). The forces of the Great Moderation were many and overlapping, such as globalization (off-shoring to low-cost countries), deregulation, technology, debt, demographics, capital over labor, the fall of the Soviet Union leading to pax Americana and an enormous surge in commodity supply from the former Soviet Union, a prior significant non-accessible source. Each of these forces was very powerful, but their powerful convergence over just a few decades was extraordinary.
Several of these forces are now reversing or are in full retreat, pressuring inflation and macro volatility higher. If globalization drove low inflation, stability and macro volatility, then de-globalization will put all this into reverse. One of the critical fallouts from de-globalization will be its fracturing effect on supply chains. The world has entered an economic war (U.S. and China) and a hot war (Russia, Ukraine and NATO by proxy), and global supply chains are an immediate casualty. Reshoring or near-shoring requires rebuilding supply chains and securing inventory. Inventory will move from a just-in-time model to a just-in-case model, requiring more supply and higher inventory levels than in the past. The economic and military geopolitical realignments are moving quickly. Markets remain highly focused on headline inflation, but de-globalization realities are moving forward rapidly…
ALERT:
Billionaire mining legend Pierre Lassonde has been buying large blocks of shares in this gold exploration company and believes the stock is set to soar more than 150% in the next 6 months. To find out which company CLICK HERE OR ON THE IMAGE BELOW.
 Sponsored
#2. Energy Markets are Realigning as Oil/Energy Trade Flows are Re-Ordered
Since the peak of the last secular bull market in commodities in early 2011, chronic underinvestment driven by cyclical factors and attention to ESG concerns (environmental, social and governance) have created structural supply shortages and tighter supply-demand balances than prior investment cycles. And now, spillover from sanctions has taken a bigger bite from the supply. For example, the U.S. has sanctioned countries accounting for 40% of the world’s oil reserves (Russia, Iran and Venezuela), resulting in much of this oil trade flow going to China at steep discounts. Furthermore, China continues to make inroads with the GCC (Gulf Cooperation Council, an economic union of six oil producers, notably Saudi Arabia, UAE, Kuwait, etc.) for long-term oil purchases and investment in its upstream sectors (refining, storage, transportation, etc.). The GCC accounts for another 40% of the world’s oil reserves. Facilities for settlement systems have been created (or nearly) for renminbi (RMB) settlement, currency swaps and foreign exchange transaction systems. In short, we appear to be in the early days of an emerging “petroyuan” and another step in long-term de-dollarization.
As the economic war with China deepens and energy trade flows are re-ordered, it becomes apparent the transition to alternative (and cleaner) energy sources is quickly becoming essential for the West from a national security, industrial sovereignty and competitive economics point of view. Although the U.S. is oil-independent, the European Union (EU) and other U.S. allies are not, and energy prices are set globally. Moreover, China receives price discounts, and security of supply, while securing downstream investments in GCC countries, a considerable advantage in an economic war.
If some see the future planetary threat from global warming as distant, then the danger of re-ordering the energy market is immediate (with other commodities to follow). The world order of the last several decades is at risk (Western perspective), and energy supply shocks and resultant inflation are significant risks. The 1970s was a tumultuous macro environment riddled with nonlinear left-tail risks11 and today’s similarities are uncomfortably familiar.
#3. An Existential Commodity Supercycle as Competition for Commodities Increases
Wars (hot, cold or economic) are commodity-intensive, inflationary and capital-intensive. The West will spend trillions of dollars over the next decade or so to restock, build and secure commodity supplies to 1) rearm their militaries to preserve and defend the current world order; 2) ensure industrial security by reshoring supply chains and production after decades of off-shoring; and 3) build out the infrastructure for the energy transition to cleaner forms. This immediate demand shock from these three broad themes will be highly commodity and capital-intensive but interest-rate-insensitive (inflationary).
This sudden and massive demand shock is colliding with a woefully inadequate supply situation due to a decade of underinvestment, sanctions on Russia (the world’s largest producer of most commodities) and rising resource nationalism spurred by geopolitical tensions. The level of capital intensity necessary will also mean increased long-term debt (both government and private), even higher than today’s already steep levels. The commodity supercycles of the past featured supply shocks (1970s OPEC embargo) and demand shocks (2000s China). This upcoming commodity supercycle has elements of both supply shock (chronic supply shortages, sanctioned Russian supply) and demand shock (energy transition, reshoring, rearming, etc.). The global competition to secure commodities is increasing…
This Company Has A Massive High-Grade Gold Project In Canada And Billionaire Eric Sprott Has A Huge Position! To Learn Which Company Click Here Or On The Image Below.

Part B. Growing Demand for Energy Transition Materials
Before the Russia-Ukraine war, the demand for energy transition metals and materials was already a long-term secular demand story. The Russia-Ukraine war, rapid de-globalization and developments in the global oil markets have moved the energy transition metals to an immediate demand shock. There are many metals and materials required for the energy transition to occur; this note will focus on uranium (generation), copper (transmission) and lithium (storage).
#4. Uranium: Clean Energy That Offers Secure Power Generation and Enhances National Security
Nuclear energy has the highest capacity factor (amount of energy produced) of any fuel energy source (traditional or alternative) with the lowest carbon emissions.12 Nuclear energy remains the cleanest, most reliable and safest baseload power generation. Nuclear power is essential to complement renewable sources of energy, such as wind and solar, which operate intermittently. Demand for uranium will continue to outstrip supply as countries worldwide move to build new reactors, restart idle reactors and reconsider the closing of legacy reactors.
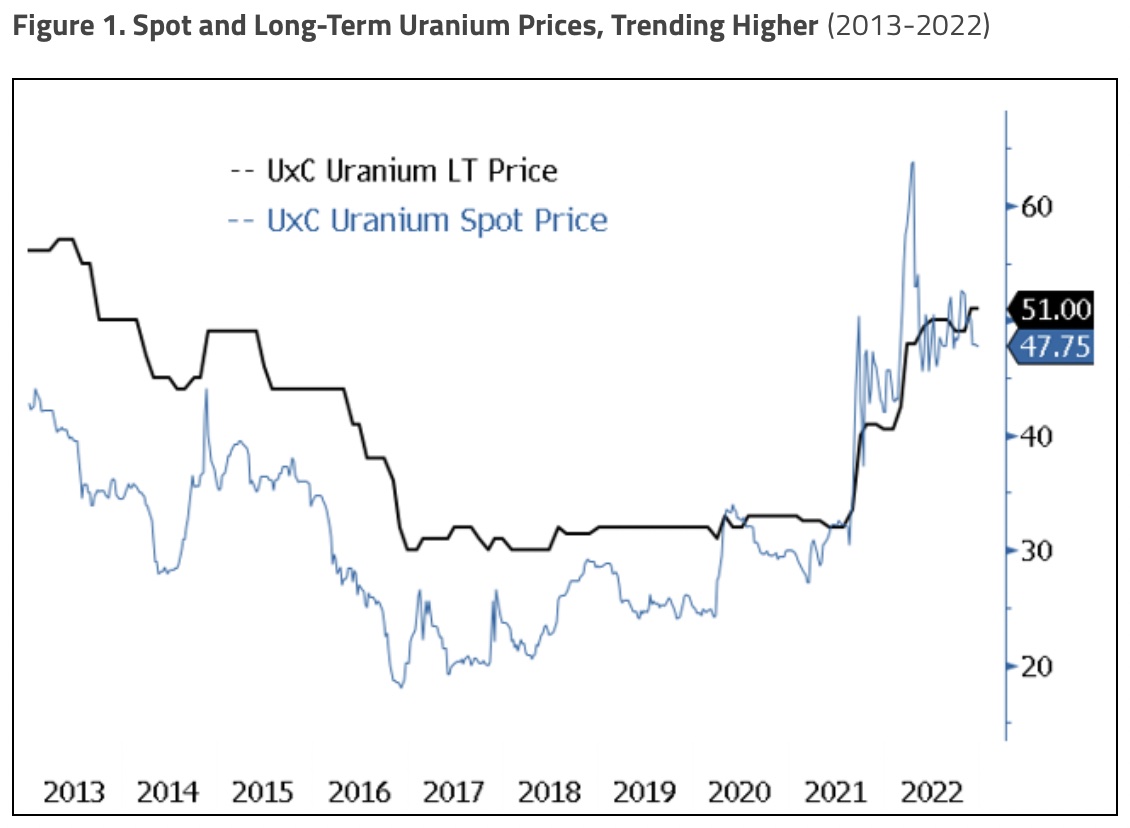
2022 was a breakthrough year for positive sentiment for nuclear power and an affirmation of the long-term bullish fundamentals for uranium (Figure 1). The fallout from the Russia-Ukraine war has skyrocketed energy prices in the EU, cascading into crises on multiple fronts. But the most important was the realization that national security requires energy security and the recognition of the strategic importance of nuclear power. Since then, nearly every country with a nuclear power fleet has announced extensions to the service life of their plants, announced future expansions and affirmed that nuclear energy is a cornerstone of their national energy policies. There is no alternative to nuclear energy in terms of baseload generation capability and security, with such a low carbon footprint. Uranium will be the critical generation component of the global energy transition theme.
The uranium supply chain, however, is strategically vulnerable. Russia controls about 39% of the global uranium fuel enrichment and 27% of the conversion capacity. With sanctions on Russia, Western enrichment will need to switch to “overfeeding” (using more uranium hexafluoride UF6 as feedstock), significantly increasing U3O8 demand. In terms of mine supply, Kazakhstan supplies 45% of the world’s uranium. Kazakhstan’s internal unrest and tenuous relationship with Russia highlight the vulnerability of the world’s uranium supply and the need to secure and reshore a significant portion of the uranium supply chain back to the West.
#5. Copper: Structural Supply Deficit and Demand Shock
Copper is one of the most vital metals powering the global energy transition, especially given that it is essential for electricity generation and transmission. Copper is critical for wind, solar, hydroelectric and thermal renewable energy and electric vehicles, and the amount required as demand for electricity increases is potentially immense. Renewable energy systems require 5-7x the amount of copper versus traditional designs, and electric vehicles (EVs) require 3x the amount of copper compared to gasoline-powered cars.
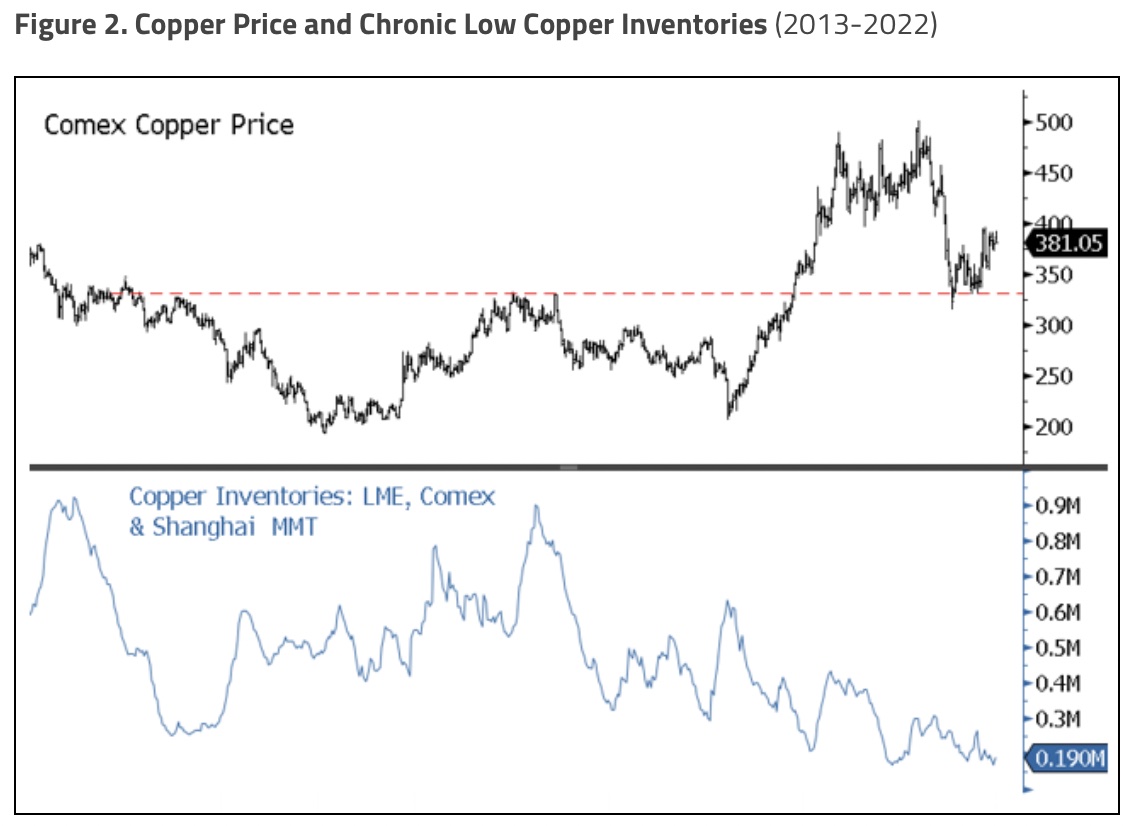
Inventory levels for copper (and all industrial metals) are critically low (see Figure 2). Over a decade of underinvestment followed by COVID-induced restrictions and supply chain issues hampered supply growth leading to structural supply shortages with the tightest supply-demand balance in decades. The surprisingly post-COVID solid global recovery in demand has put copper in a deficit situation, requiring draws on inventories to balance supply and demand.
In times of low inventories, physical deliverable contracts for copper are highly susceptible to price volatility from financial markets. The risk of a global recession, continuing growth struggles in China and typical Q1 seasonal weakness could produce near-term price weakness in copper. But into Q2 seasonal buying strength, a price squeeze higher is likely as physical deliveries (with low inventories) are required into expiry. Insufficient stock and inventory cover will likely prevent sustained copper price weakness, and the demand from the energy transition argues for higher long-term copper prices.
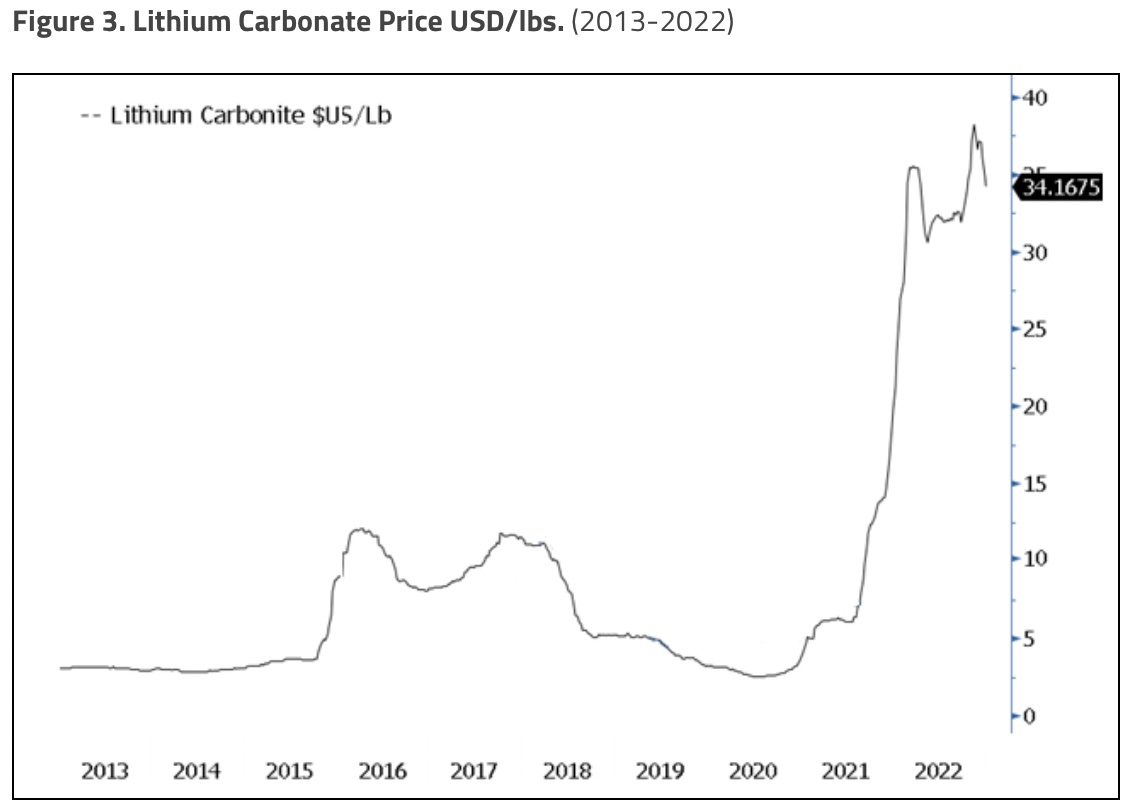
#6. Lithium: Battery TINA (There Is No Alternative)
Lithium is the critical element of lithium-ion batteries, the predominant battery type used in electric vehicles and many consumer electronics. These deep-cycle batteries are designed to give power over sustained periods and have a high power-to-weight ratio, specific energy and energy density — reducing the vehicle’s weight. Lithium demand is expected to have extraordinary growth, rising from 0.5 MMT (million metric tonnes) of lithium carbonate equivalent (LCE) in 2021 to ~ 3 MMT by 2030 (22% per annum growth versus ~3% per annum growth for mature metals), with batteries accounting for 95% of demand.
Lithium began as an EV story as various governments announced the phase-out or elimination of new internal combustion engine (ICE) vehicles by 2030-35. The EV story quickly morphed into a security of supply story as companies, governments and policymakers began to understand the strategic importance of securing these raw materials (Figure 3). Although China accounts for only 13% of lithium mine production and 8% of reserves, it dominates in the midstream and downstream portion of the lithium value chain. China has a dominant 45% share of lithium carbonate and hydroxide production, 75% cathode production and 70% lithium-ion battery cell production. This dominance in lithium by China is an untenable situation, more so now with China’s growing influence in the oil markets. The West is in the process of securing its EV supply chain via legislative acts and policies.
Uranium, lithium, copper and other critical elements for the energy transition theme may be more insulated from economic cycles than other basic commodities as securing supply chains outmatches cyclical forces.
#7. Energy Transition Metals Continue to Outperform
Reality Check: Energy Transition Materials versus Other Commodities
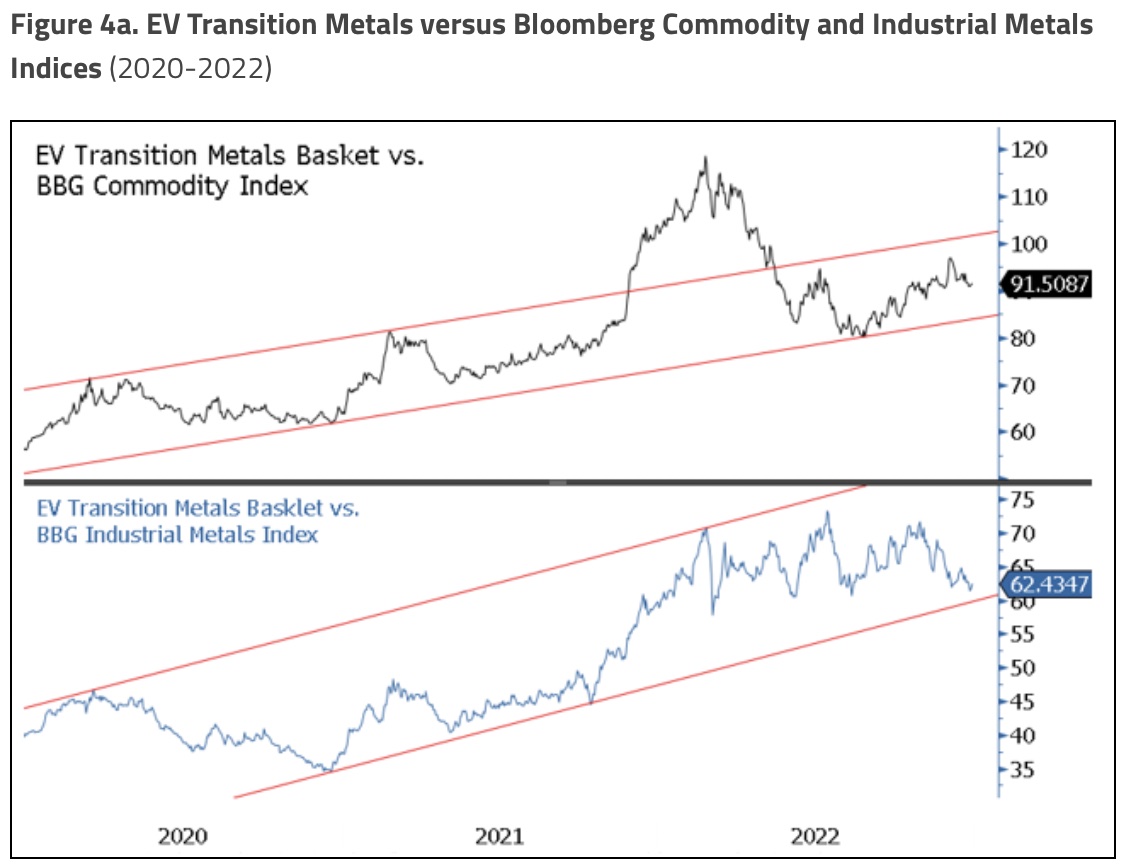
From a macro and fundamental perspective, we believe the energy transition investment opportunity is promising, but how well have critical minerals performed on a relative basis? We created charts to provide a visual as to their relative performance against standard benchmarks.
In Figure 4a, we created an unweighted basket of seven transition energy metals used in an EV battery. We compared this EV metals basket to the Bloomberg Commodity Index (a broad commodity index) and the Bloomberg Industrial Metals Subindex (base metals). Since 2020, the basket of battery metals has been in a steady outperformance trend relative to both the broad commodity and base metals indices.
Part C: The Important Role of Precious Metals
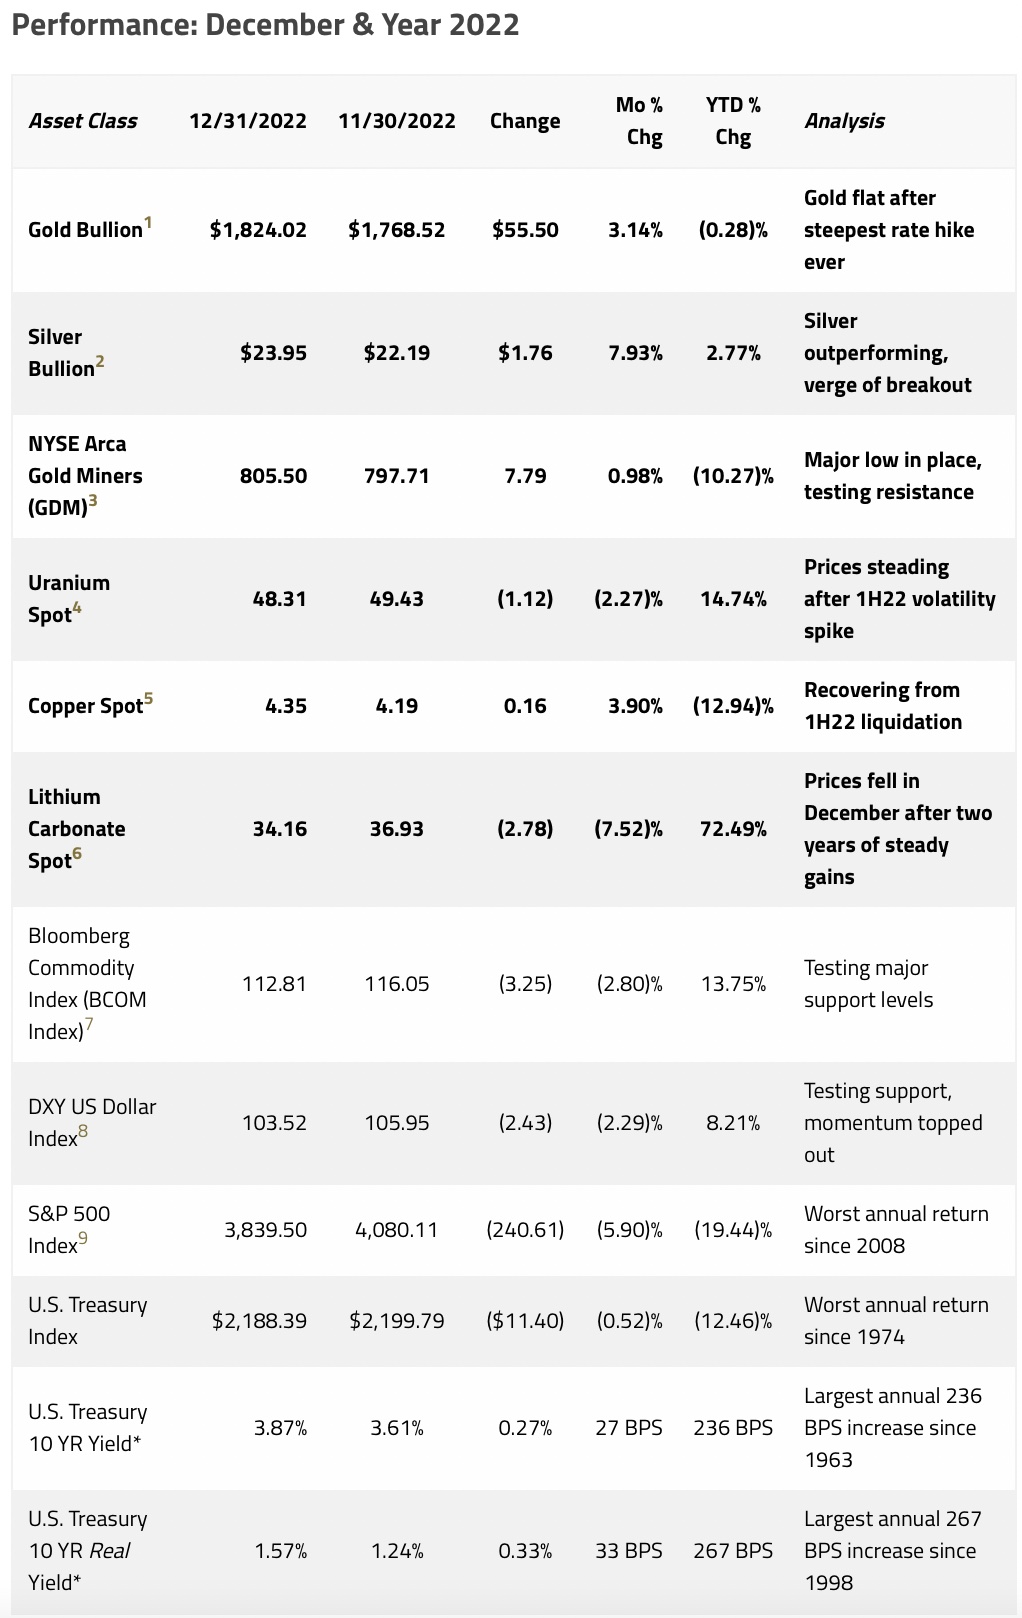
2022 Year in Review
Gold closed 2022 down $5.18 per ounce or -0.28%, to close at $1,824.02. For the year, the spot gold average was $1,802.46 versus an average of $1,798.85 for 2021 (up $3.61 per ounce). Gold began the year surging to a closing high of $2,050.76 by late February as Russia invaded Ukraine, sparking fears of a broader military conflict involving nuclear superpowers. Within weeks, the war had reached a military stalemate, and gold began to drift lower, driven by a new concern: a very hawkish Fed caught offside by surprising soaring inflation. A series of much-higher-than-expected inflation reports sparked four consecutive 75 basis point rate hikes, pressuring gold and virtually all risk assets.
2022 saw the most aggressive interest rate hikes in over 40 years, compressing valuation multiples and long-duration assets. Due to the lag effects of monetary policy, we believe that 2023 is when economic and financial system risks are likely to emerge. Gold historically performs poorly with rising interest rates but does better in risk-off environments as a safe-haven asset. Gold sold off during the aggressive rate hike portion as CTA-type funds reduced longs and heavily shorted gold. With the Federal Reserve (“Fed”) announcing the end of outsized rate hikes and better-than-expected inflation data (CPI, consumer price index), gold, by yearend, had recovered from its summer price swoon.
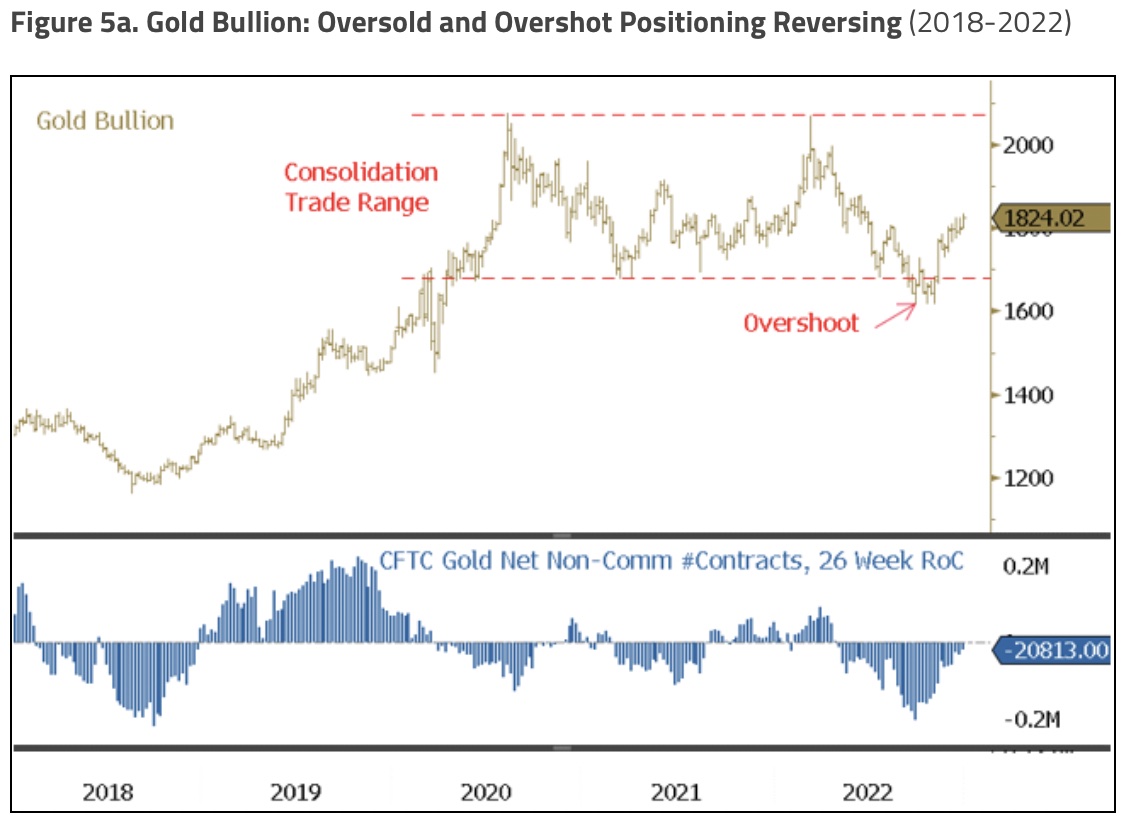
#8. Gold Bullion, Setting Up to Test the Upside in 2023
From the March 2022 highs, short-term gold prices were mainly dictated by investment trading flows dominated by CTA types. Figure 5a in the lower panel shows the CFTC Net Non-Comm gold positioning change on a rolling six-month rate of change to highlight the trading intensity. In our November commentary, we highlighted several factors that indicated that gold had reached a cyclical low…
This Is Now The Premier Gold Exploration Company In Quebec With Massive Upside Potential For Shareholders click here or on the image below.
As global oil contracts increasingly use the yuan, gold may return as a settlement medium via RMB-gold convertibility in China’s new rival economic and monetary system. The need to build sufficient gold for this facilitation is another possible reason for the massive surge in gold imports from China in 2022 and the early days of 2023. As the de-dollarization process takes hold, gold will likely become much more attractive than the U.S. dollar for any country aligned in this new China-led economic sphere due to RMB-gold convertibility and avoiding sanctions risks from the West. De-globalization requires a competing financial banking system, and gold appears to be the primary “outside money” capable of seamlessly crossing between the systems. Also, this development would likely significantly reduce gold lending banks’ desirability to facilitate shorting gold as the risk of liquidity mismatch would be so significant once gold re-enters settlement markets (“paper gold” becomes an unstable borrow).
The emergence of a “petroyuan” and concurrent de-dollarization, combined with RMB-gold convertibility, may lead to an increased correlation between gold, oil and the RMB/yuan over time. Although perhaps early on, the change in macro drivers for gold would be essential to understand changes in gold pricing dynamics.
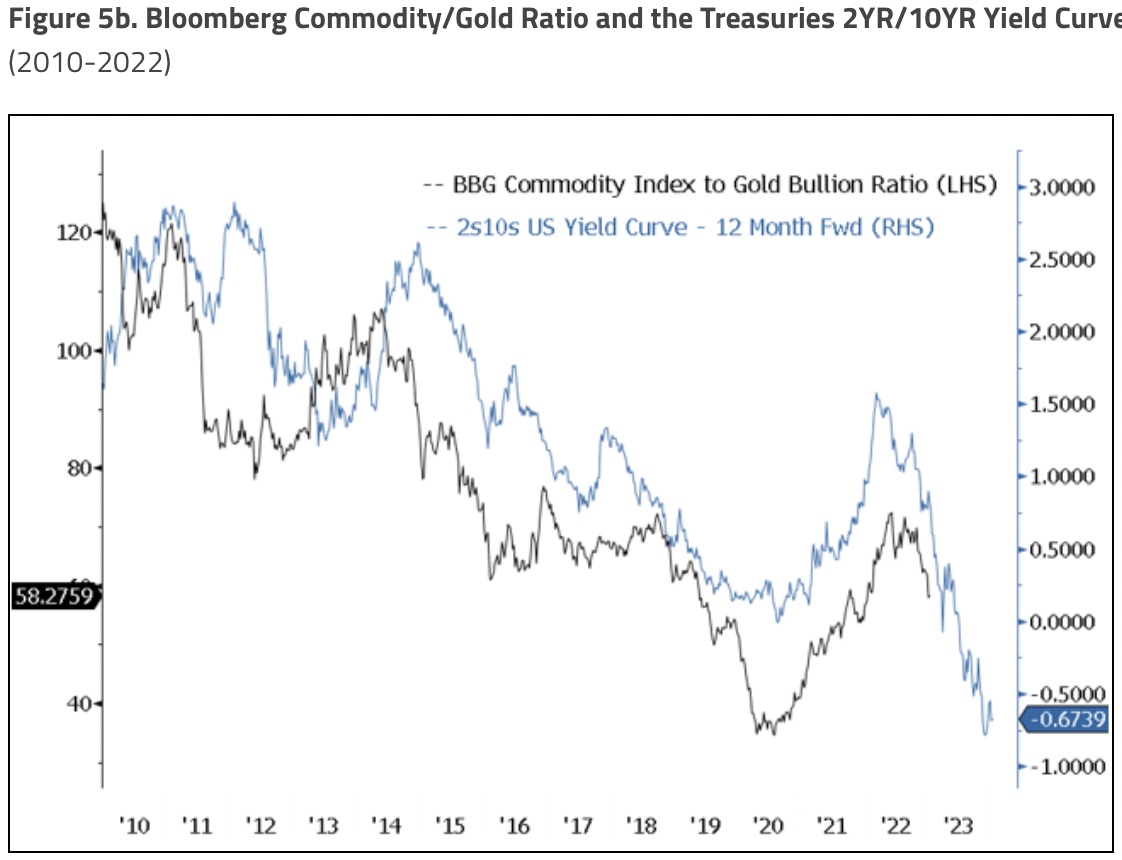
Near term, we highlight Figure 5b for consideration from a broad commodity versus gold bullion point of view (or sensitive economic asset versus safe haven asset). The blue line is the 2s10s yield curve forwarded 12 months, providing an excellent lead indicator for the Bloomberg Commodity Index versus gold bullion ratio. The U.S. Treasury 2YR/10YR yield curve is steeply inverted, warning of a possible recession. After underperforming the broad commodities for a few years, we would expect gold to outperform in 2023. The harder the landing, the more significant the relative gold outperformance.
#9. Silver: Oversold Secular Low
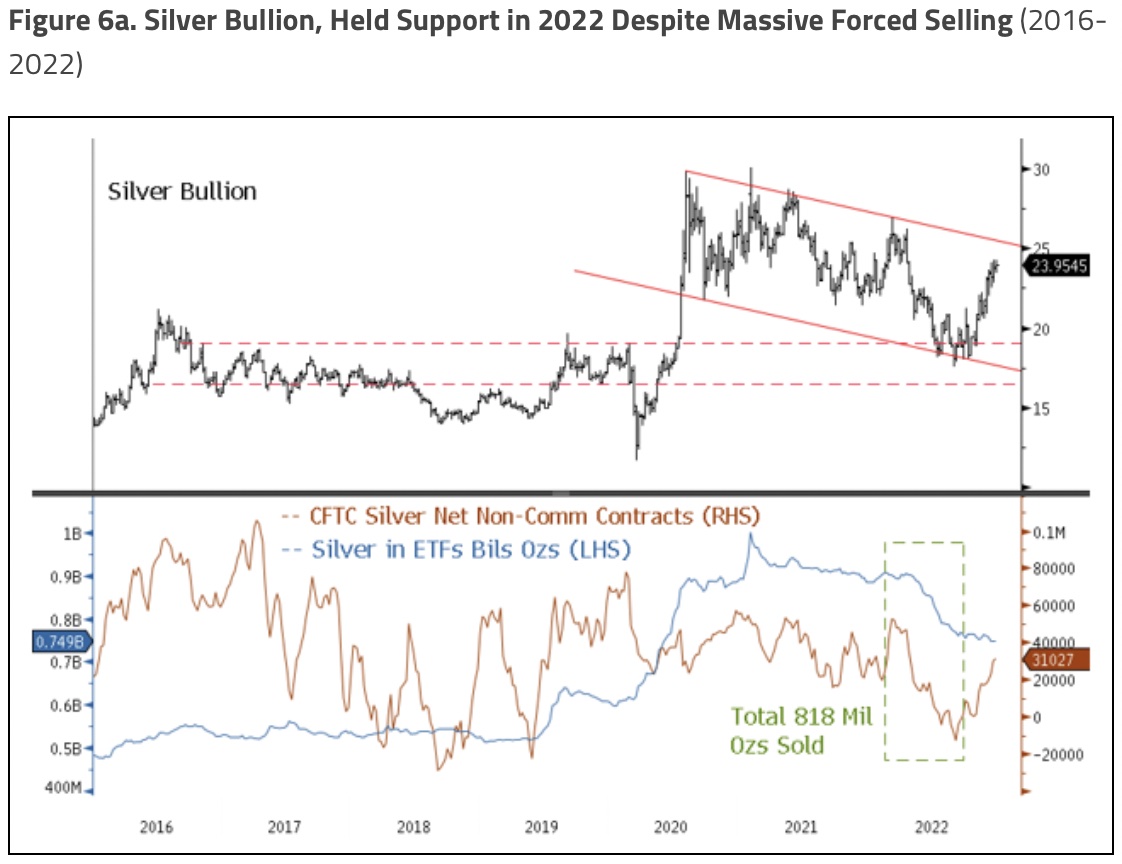
Silver closed 2022 higher by $0.65 (or 2.77%) to close at $23.95. Like gold, silver began the year on a firm footing before it was overwhelmed by CTA-type and retail selling (Figure 6a). From the March 2022 peak, over 818 million ounces of silver (or 52%) of combined CFTC14 and ETF silver were liquidated over six months. This selling wave was the most seen from retail-dominated ETF selling ever, indicating capitulation activity. By the September 2022 lows, CFTC silver positioning had reached a 3%-tile reading over the past 10 years, and silver in ETFs saw a -25% drawdown versus prior maximum drawdown levels of ~-10%. Considering the strong silver supply-demand fundamentals, silver liquidations were likely forced selling.
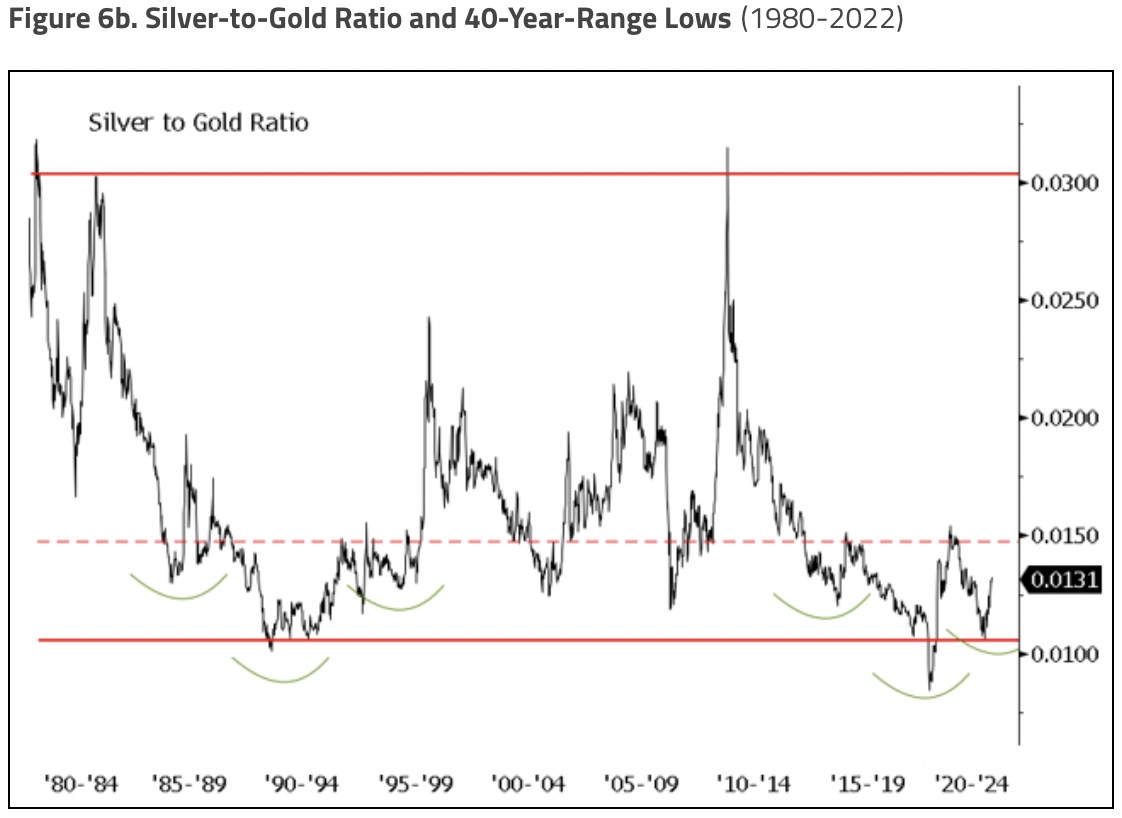
Silver and gold, as precious metals (similar macro variables), unsurprisingly have a very high correlation of 0.84 from 1981 (post the Hunt Brothers craziness) to 2022. In Figure 6b, we highlight the silver-to-gold ratio, a less common expression of the relative relationship. At the September lows, this ratio reached the 1%-tile reading and the primary support level. This 1%-tile level is an extreme undervaluation of silver relative to gold. As the 40-year chart demonstrates, the silver-gold ratio is mean-reverting. Silver fundamentals remain excellent, with virtually all its future demand growth tied to solar panel growth (silver is also an energy transition metal with monetary qualities). Similar to lithium, China accounts for 84% of global solar panel manufacturing, which must be reshored.
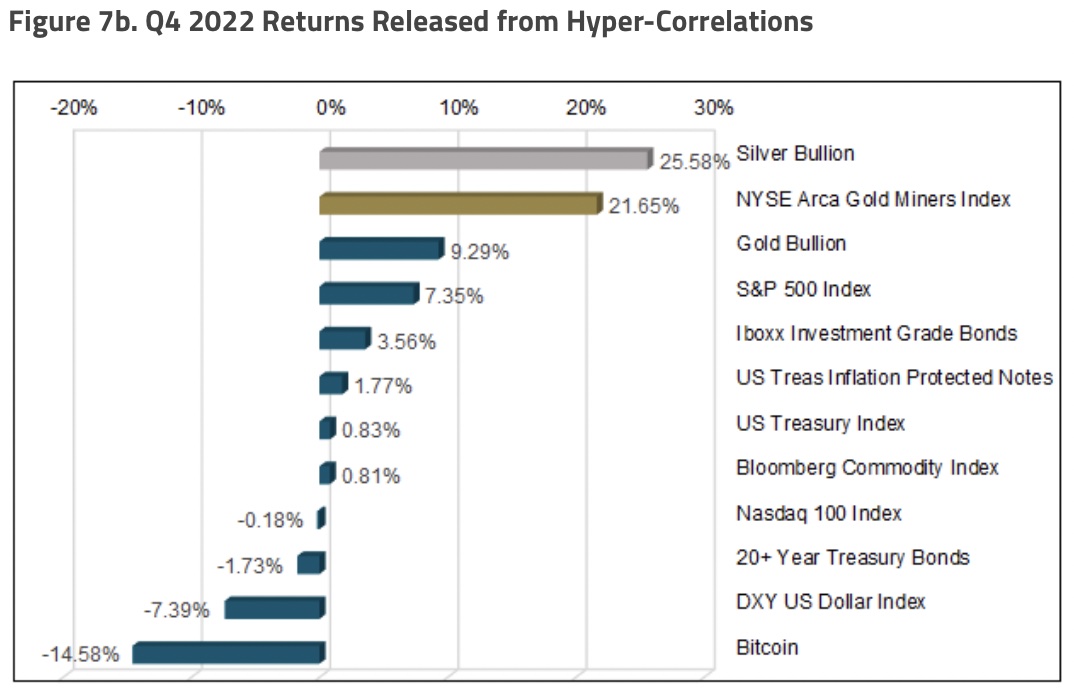
#10. Gold Miners, Escape from Hyper Correlations
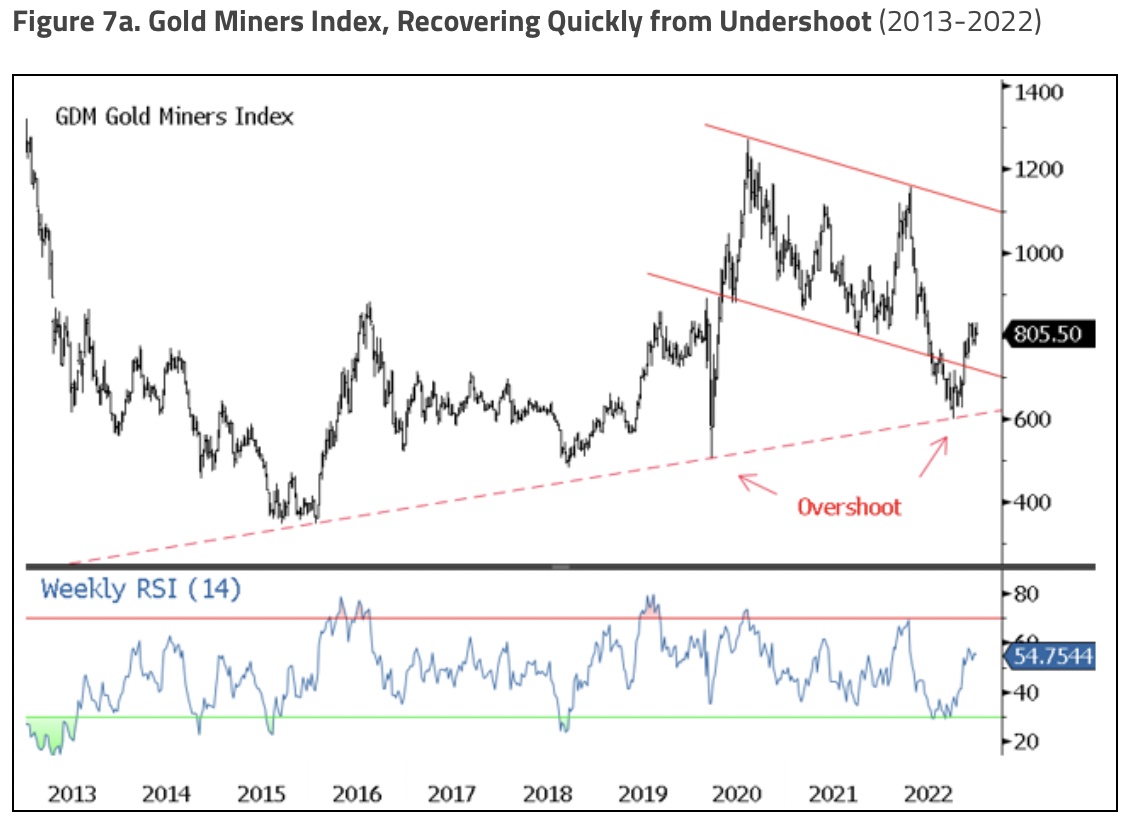
Gold miners had a very volatile year as well. Like gold and silver, the gold miners also had a downside overshoot due to severely poor market trading liquidity. All equities (not just gold equities) had a high level of intra-stock correlation due to the Fed tightening financial conditions (higher USD, higher real yields, lower liquidity). The 30-day rolling correlation between gold miners and the S&P 500 reached its highest level in 10 years, meaning broad market pricing flows dictated gold miners’ price action, not fundamentals. Since the Fed signaled the aggressive portion of its interest rate hikes is over, there has been an unclenching of hyper-correlation across asset classes as fundamentals reassert themselves. Figure 7b is the Q4 2022 returns for various asset classes. It highlights the now diverging returns of the “better” asset classes (precious metals) that we believed were caught in the liquidity vortex versus fundamentally problematic asset classes.
From One Market Regime to Something Very Different
The final act of the Great Moderation was likely when market structures became optimized for QE, ZIRP, NIRP and low volatility. During that time, the Fed became very responsive to market outcomes (i.e., the Fed put). The Fed effectively allowed the market to influence policy resulting in market-friendly and volatility-killing policies. The events of 2022 (inflation, war, geopolitics) have ushered markets to a new market regime much closer to their normal pre-GFC (global financial crisis) state, where asset prices may take much longer to resolve, something not seen in decades. This regime change could not be more extreme.
ALSO JUST RELEASED: GOT GOLD? Madness In World Bond Markets Ahead Of Global Reset CLICK HERE.
Gerald Celente shares with King World News listeners around the globe what may send the price of gold soaring to $2,100-$2,300 in a matter of weeks. To listen CLICK HERE OR ON THE IMAGE BELOW.

© 2023 by King World News®. All Rights Reserved. This material may not be published, broadcast, rewritten, or redistributed. However, linking directly to the articles is permitted and encouraged.


