As we get ready to head into what could be a wild month of trading in October, here is a look at gold, stocks, the Great Bond Bubble and the painful truth.
The Painful Truth
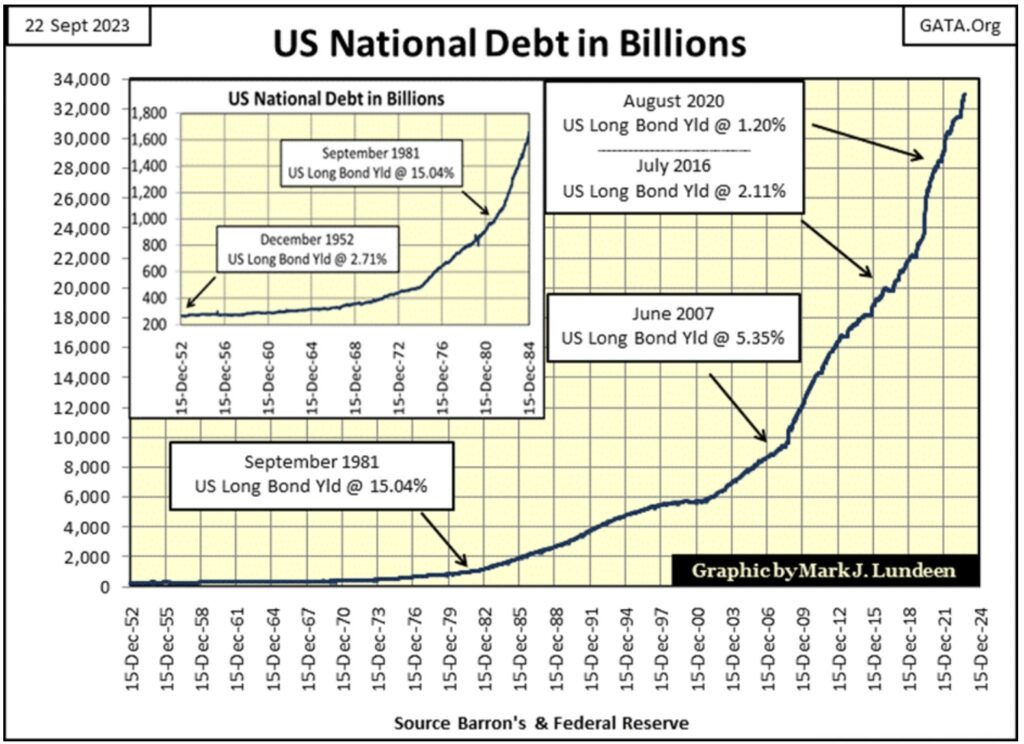
September 28 (King World News) – Mark Lundeen: In August 1971, the US National Debt was 406 billion dollars. In September 2023, the US national debt has now broken above 33,000 billion dollars. With all these new dollars circulating in the global economy, who is better off for it? The painful truth is that most people, as is the US Government and corporate America, are heavily in debt, and are not better off for it.
Not good, not good at all. With bond yields and interest rates rising, the servicing of this ever growing $33 trillion-dollar dead horse, a non-productive burden on government finances will become crushing. It’s not just Treasury debt. Corporate debt and consumer debt have also risen to levels that would not be believed possible in August 1971. Rising bond yields and interest rates will impact them just as much.
There is a crisis looming over the horizon, that the wise can see coming.
All this debt is owned by someone; wealthy individuals, banks & central banks, insurance companies, and trust funds. Uncle Sam owes a lot more money than what is plotted above. For instance, the non-negotiable bonds backing his liabilities for the Social Security System, and who knows what else?
It’s just a fact; the Federal Government currently spends trillions-of-dollars every year, much of it borrowed from the debt market. The individuals on the receiving end of this massive flow of funds don’t take kindly to anyone who wants to turn off the valve to their flow of funds. Say, like to their useless war in Ukraine, their moronic carbon-free solar and wind power schemes, or to the anticipated second Covid vaccine, the deep-state is now planning for the 2024 presidential election year…
Listen to the greatest Egon von Greyerz audio interview ever
by CLICKING HERE OR ON THE IMAGE BELOW.
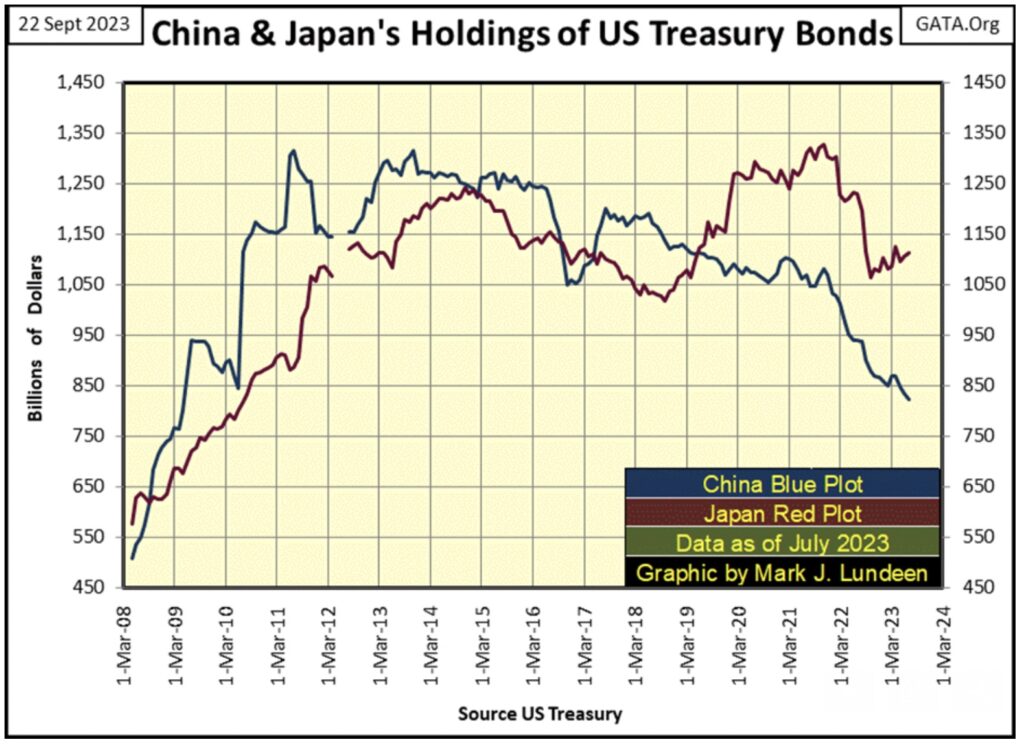
The US Treasury published a monthly database; of which country owns the T-debt seen above. It doesn’t breakdown what kind of Treasury debt, whether its 30d T-bills or 30yr T-bonds. The data is in US dollars, but I doubt these dollars are based on market valuation. Let’s look at the international holdings of US Treasury Debt, first looking at the holdings of T-debt by Japan and China, the two largest foreign holders of Uncle Sam’s IOUs.
China’s holdings peaked in July 2011, while Japan’s holdings peaked ten years later in November 2021. Note below how each nations’ holding of T-debt surged in the aftermath of the 2007-09 sub-prime mortgage crisis. No doubt because they too, like the United States wanted to “stabilize” the global-financial system following this sub-prime debacle in the credit markets.
But that was then, and this is now. As seen below, both nations holdings of T-debt are down, China by 37.59%, and Japan by 16.27% from their peak. That means China and Japan have been net sellers of T-debt for years. So, who is buying what China and Japan have been selling in the Treasury market?
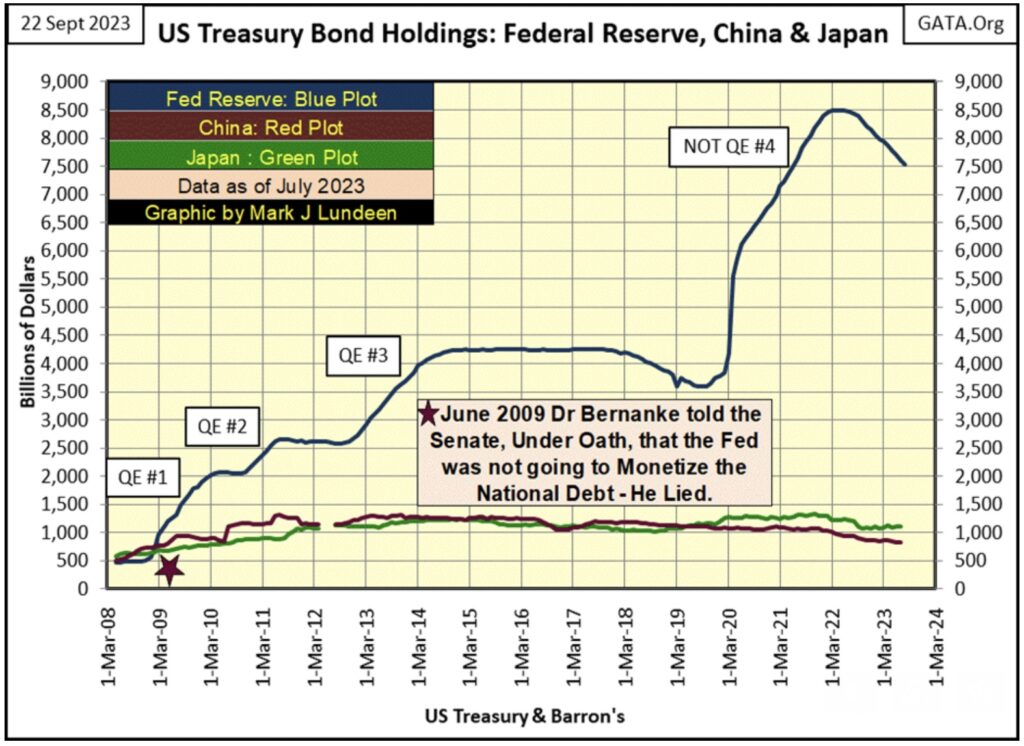
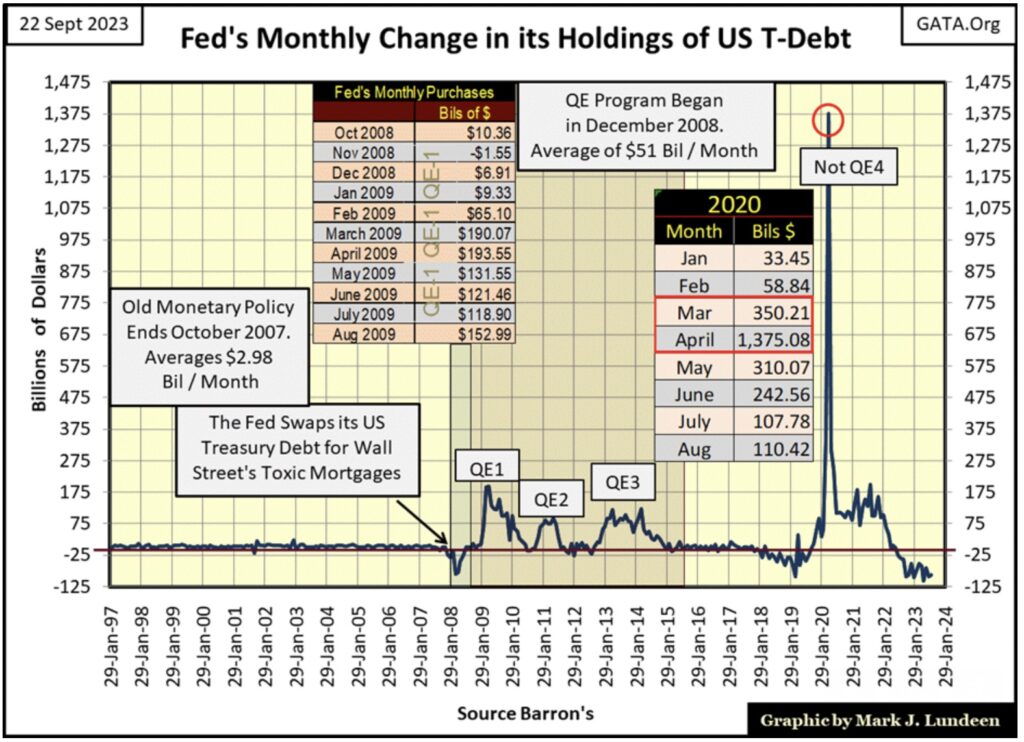
If you believe the data from the Federal Reserve, it’s not the FOMC, which has been a net seller of T-debt since it implemented its QT in May 2022. Data from the Federal Reserve is not included in this data set from the US Treasury, but I have it, so why not use it? Following its peak holdings of T-debt, the FOMC in the past fifteen months has sold off 10.43% of its portfolio of Treasury debt in its ongoing QT, as seen in the chart below.
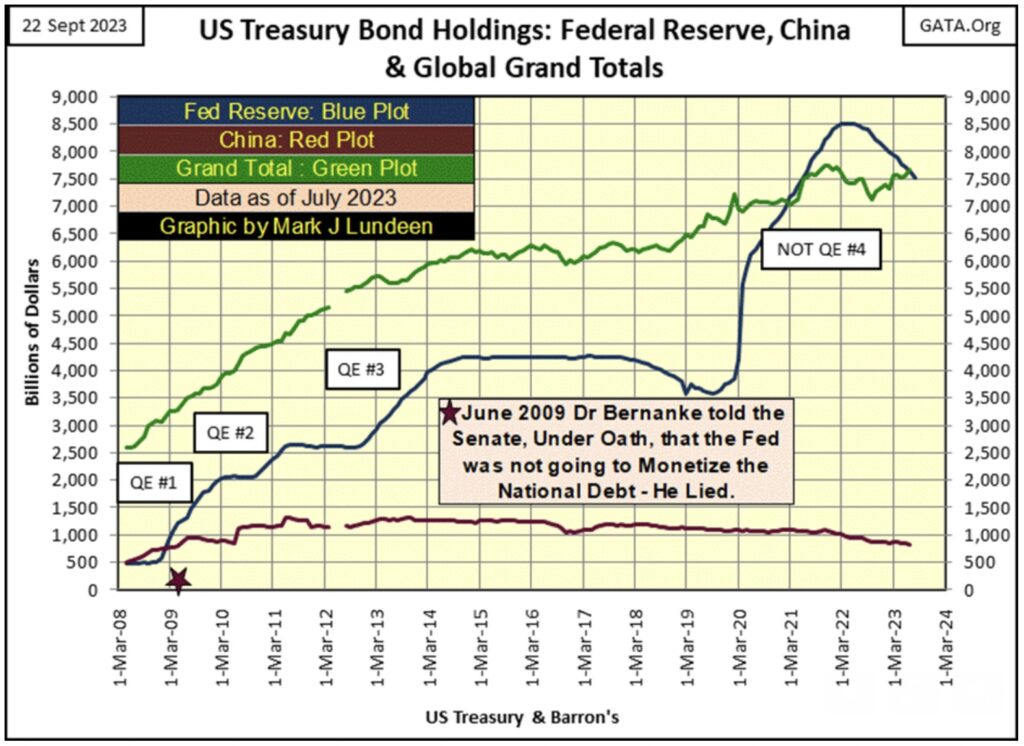
Okay, the FOMC isn’t buying China’s and Japan’s Treasury debt in the debt market. We’re told they too are net sellers in the Treasury market. Looking at the Grand Total holding, published by the Treasury Department in the chart below, it too is down by 1.20% from its peak holding.
In these charts, we looking at trillions-of-dollars of sell orders going into the Treasury market. So, who is buying? Obviously, someone is absorbing the sales of T-bonds by China, Japan, the FOMC, and many other countries too. These unknown buyers must also be absorbing the tsunami of new debt currently issued by the US Treasury, at prices no sane person would be willing to pay to “stabilize T-bond yields,” or so it seems to me.
I’m just a retired enlisted-man from the US Navy. Analyzing the international flow of funds in the Treasury market is a topic I claim no expertise in, and that is something my readers should keep in mind. But, does one need a degree in forensic accounting to understand the selling of Treasury debt is overwhelming its purchases in the charts above, and table below?
Looking at the table below Percent From / Max Val column (blue tab), the reduction of Treasury debt from peak holdings is given. In July 2023, only three countries’ holdings of Treasury debt saw new all-time highs (BEV Zeros / 0.00%);
- Luxembourg
- Canada
- Norway
None of these countries were ever big holders of Treasury debt, as China and Japan still are today. So, who is buying all of Uncle Sam’s IOUs being sold in the Treasury market?
Powell “injected” over two trillion dollars of “liquidity” into the financial system from March to May 2020, and he is ready to do so again should the financial system once again needs to be “stabilized.”
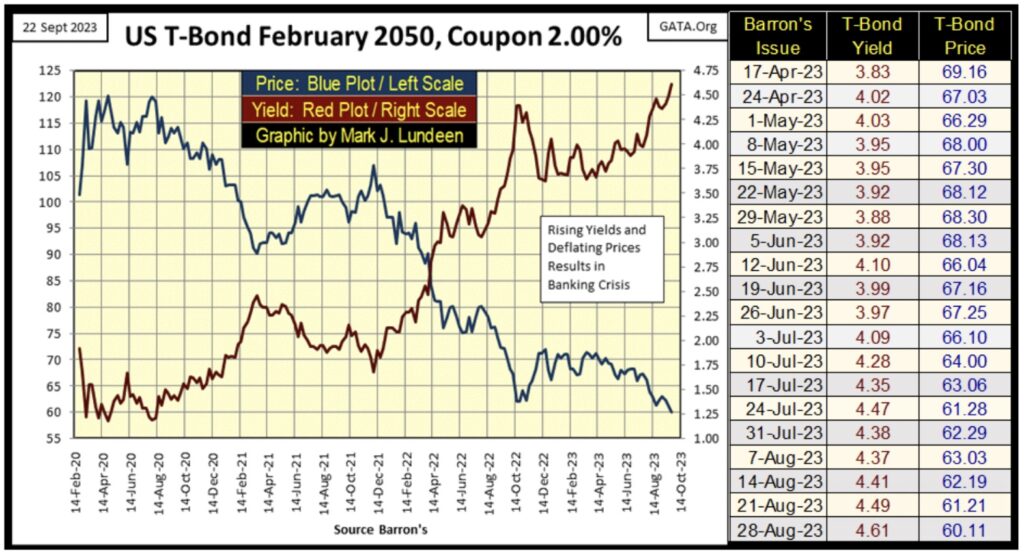
Next is the chart for a 30yr T-bond, issued in February 2020. This week, it closed with its all-time high yield of 4.61%. Multiples of its 1.19% yield seen in Barron’s 03 August 2020 issue.
The painful fact of life in the bond market; these yield increases have had a devastating impact on bond values. This bond has lost half of its market value since August 2020, a bigger loss than any of the major market indexes.
The Great Manipulation: Gold & Paper Assets
The “policy makers” have for decades been “stabilizing” market values for the stock market, while for decades they’ve done all they could do to destabilize market values in the gold and silver futures markets. I see it this way; the “policy makers” can’t get the Dow Jones to close on its BEV Zero line with a new all-time high, and have failed to force gold back down below its BEV -10% line.
Come the day when all their market machinations are terminated by Mr Bear, values in the stock market will deflate explosively, as flight capital flees to the safety of the old monetary metals – gold and silver.
Gold doesn’t want to close below $1900. That is good. But as I’ve pointed out for quite a while, the bull market in gold isn’t going to get exciting until gold once again sees frequent days of extreme market volatility – 3% days, where gold moves (+/-) 3% or more from its previous day’s closing price.
So far in 2023, gold has seen only one day of extreme market volatility; on March 16th, gold closed 3.51% above where it closed on March 15th. And so far in 2023, gold hasn’t done much for the bulls. But in the fullness of time, in a market where bond yields have no where else to go but upward, in God’s good time, we’ll see plenty of volatility, and advances in valuation in the gold market.
ALSO JUST RELEASED: GOT GOLD? Look At What Major Currency Is Being Destroyed As Global Collapse Accelerates CLICK HERE.
ALSO JUST RELEASED: Ignore Gold & Silver Takedown And Take A Look At This… CLICK HERE.
ALSO JUST RELEASED: James Turk – Silver Preparing For Massive Breakout That Will Take Price To All-Time High CLICK HERE.
ALSO JUST RELEASED: Greyerz – Gold Is On The Verge Of Being Revalued Thousands Of Dollars Higher CLICK HERE.
Timely And Fantastic Interview Just Released!
To listen to Nomi Prins discuss the radical moves she expects to see in the gold, bond and foreign currency markets CLICK HERE OR ON THE IMAGE BELOW.
NEW!
To listen to Alasdair Macleod discuss what to expect next week in the gold and silver markets as well as what surprises are in store across the globe CLICK HERE OR ON THE IMAGE BELOW.
© 2023 by King World News®. All Rights Reserved. This material may not be published, broadcast, rewritten, or redistributed. However, linking directly to the articles is permitted and encouraged.


