

What is happening right now is quite stunning as China is replacing U.S. Treasuries with gold. This is going to have huge implications for the forex and gold markets in 2023.
Strong China Demand Boosts Gold Rally
January Review
February 9 (King World News) – Paul Wong, Market Strategist at Sprott Asset Management: Gold had another strong month and the best start to a year since 2015 as spot gold rose $104.34 (or 5.72%) to close January at $1,928.36. While the gold price was supported by the decline in the U.S. dollar (USD) and real yields in January, the magnitude and persistence of the bid for gold were high. Gold bullion trading desks have confirmed this strong interest is a continuation of flow demand from China since early November 2022, and the estimated tonnages bought would align with the most significant numbers since 2017. Price action and trading desk anecdotes denote large buying from China’s “official sector” (possibly any combination of People’s Bank of China, central bank-related entities or state banks) for undisclosed reasons.
January was a solid month for risk assets as investment funds were underexposed for a positive, right-tail outcome. The significant left-tail risks of 2022 quickly faded or reversed as we headed toward the new year. In the U.S., fears of hyperinflation and additional Federal Reserve (“Fed”) rate hikes ended abruptly as the Fed signaled it would slow its rate hikes just as inflation data finally moderated. In Europe, a far warmer-than-expected winter prevailed, allowing the EU to dodge the worst of an energy-spike-induced hard landing and associated stress events. After years of a strict zero-COVID policy, China quickly reversed to a full reopening, instantly giving the world an unexpected growth shock. With all three major economic regions experiencing a sudden reversal from left-tail (negative) to right-tail (positive) outcomes, massive forced buying was triggered…
This Company Has A Massive High-Grade Gold Project In Canada And Billionaire Eric Sprott Has A Huge Position! To Learn Which Company Click Here Or On The Image Below.

Furthermore, with the pause in Fed rate hikes in sight, both the USD and interest rates declined sharply, easing financial conditions and paving the way for a rebound in many financial assets. Whether this rally is the beginning of the consensus-desired soft landing or yet another bear market rally remains to be seen. We expect that macro volatility will likely remain high in the months ahead.
Gold Bullion Update
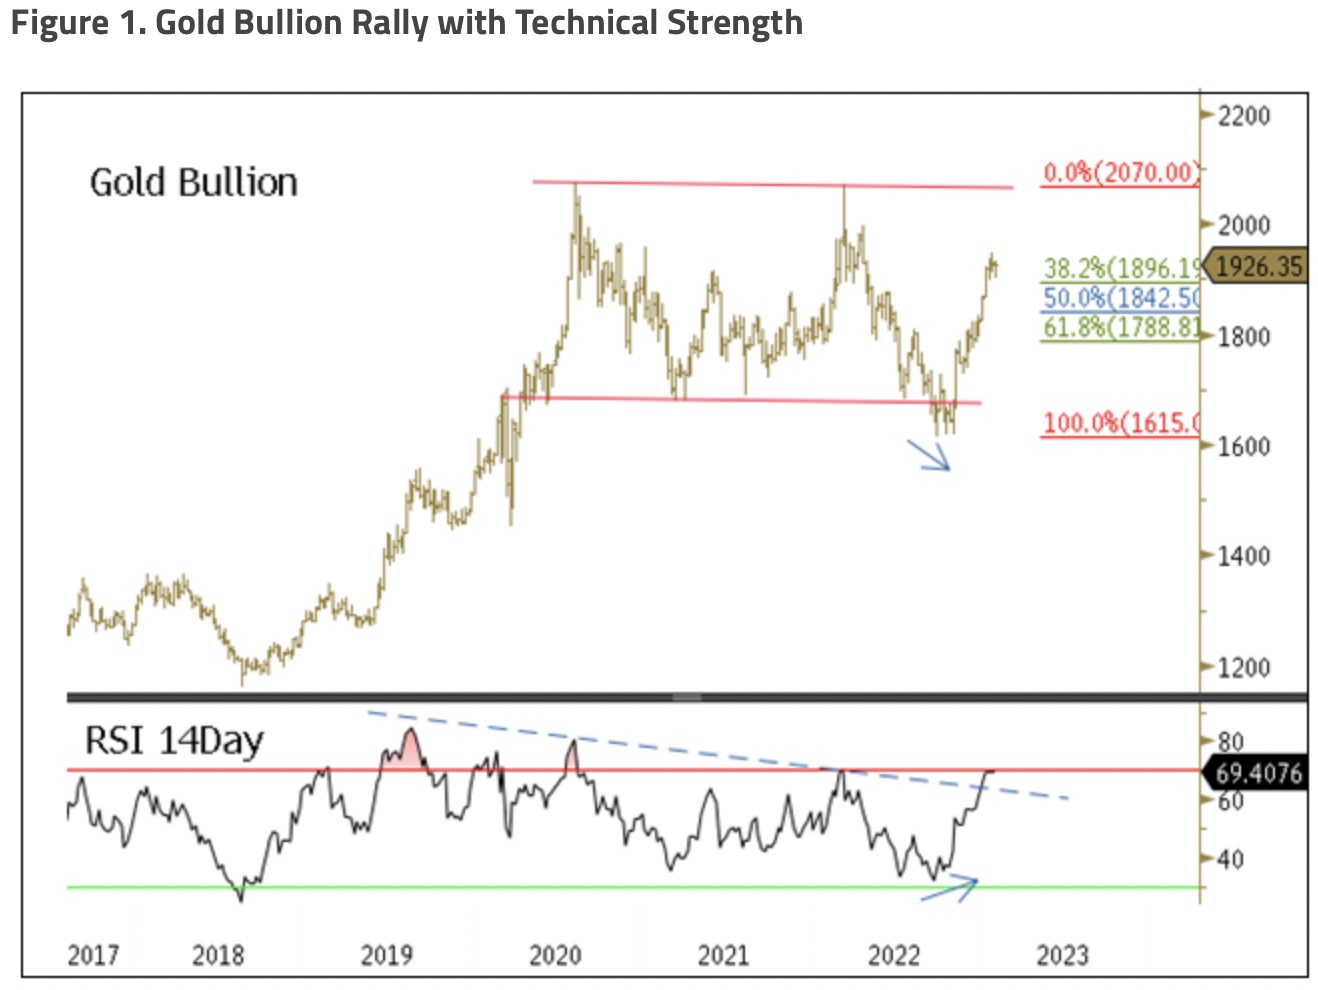
Gold bullion since the autumn lows, based on a three-month rate of change, had the most significant increase since 2011. Since the lows, the gold price has broken through technical resistance levels and Fibonacci retracement levels with remarkable ease, reinforcing the evidence that the buyers are not likely financial market types. From gold’s early November lows of approximately $1,625 to $1,775, the price action has the look and feel of short covering in the face of an aggressive buyer. But since gold has reached the $1,775 level, the narrow up-channel and low bid-ask dispersion indicate a persistent large bid in gold that is not concerned with market-related overbought conditions. Lastly, the weekly Relative Strength Index (RSI) put in a positive divergence during the autumn lows and has broken above the RSI downtrend line (lower panel of Figure 1).
Gold Investment Positioning Remains Low
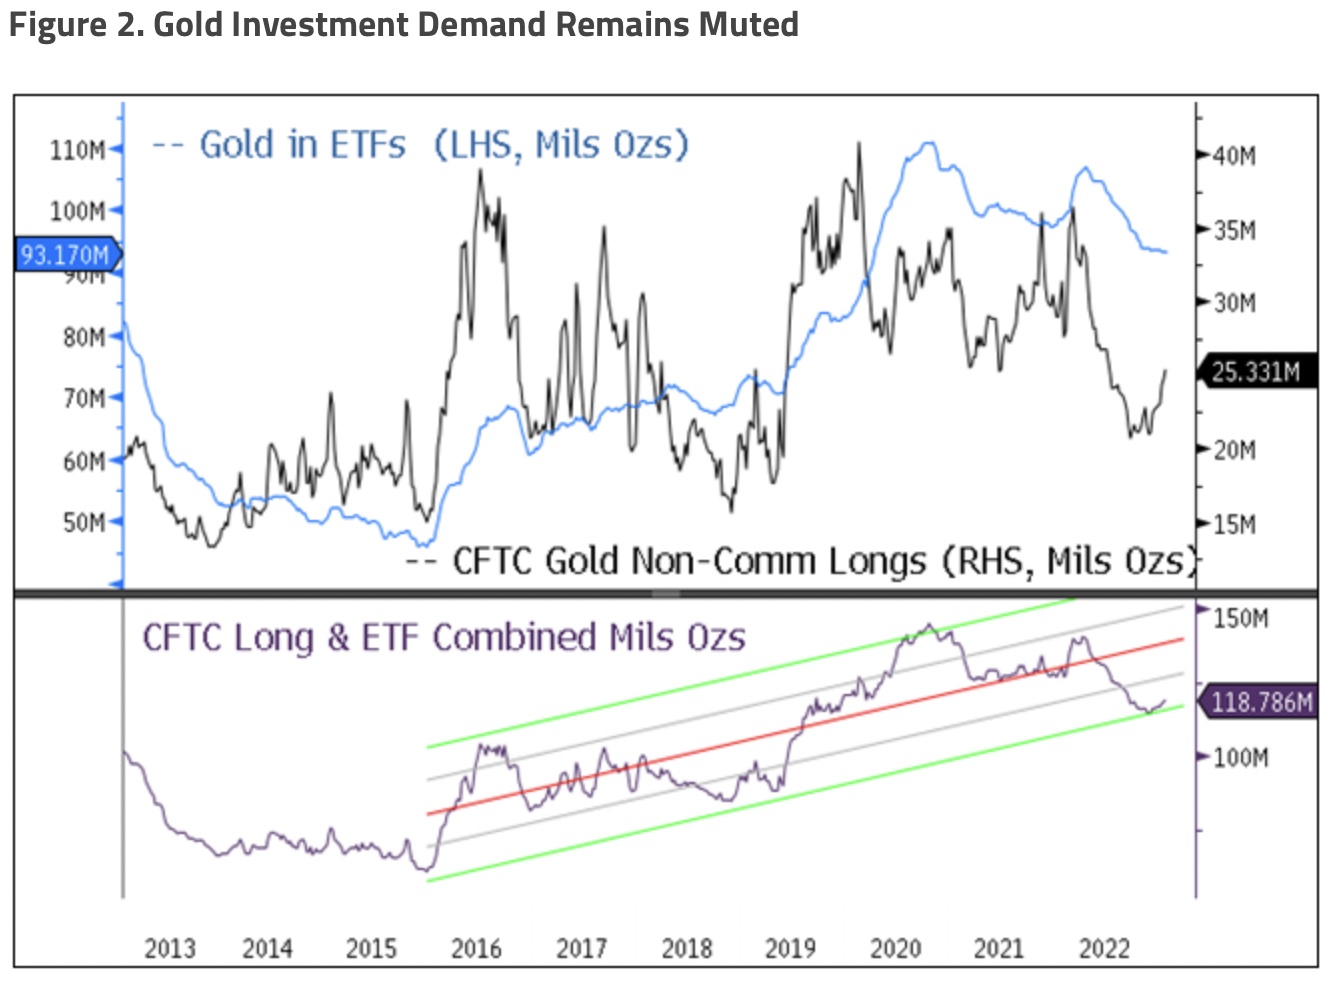
Despite the rise in gold, the long gold CFTC (Commodity Futures Trading Commission) net non-commercial positions and ETF holdings remain muted, like a deer caught in a headlight (Figure 2). Gold held in ETFs (mainly retail and smaller funds) remains near +2.5-year lows and has not shown any buying indication yet. CFTC non-commercial long gold positioning, too, remains near the low end of its 10-year range. Neither of these two sources of investment “longs” is likely to sell off further as they are more trend following than leading. The last source of investment flows, short positions, are even less likely to add to selling flows. First, there is no overriding primary bearish macro driver (interest rate hikes are near the end, and the USD is weakening); second, shorting into massive buying is outright dangerous. The combined CFTC gold longs plus ETF gold holdings are now at their -2 standard deviation lows (lower panel, Figure 2) with macro drivers positive and massive buying from China and central banks. The risk from long positioning remains skewed to increasing longs, not divestment.
U.S. Dollar Strength and U.S. Treasury Liquidity Functioning
The U.S. Dollar Index (DXY) reached the upper end of its 16-year-long uptrend and has now fallen at a remarkable pace not seen since the volatile years of 2008 to 2010. The three-month rate of change of the DXY has recorded its second sharpest decline in the past 20 years. This dramatic fall in the USD has also eased financial conditions, creating a powerful tailwind for gold and other risk assets. Typically, policy coordination comes to mind when currencies sharply and quickly reverse from levels detrimental to market functioning, with such high correlations. Unfortunately, if policymakers have decided on a coordinated USD strength reduction policy, we won’t know until much later when it becomes evident in hindsight.
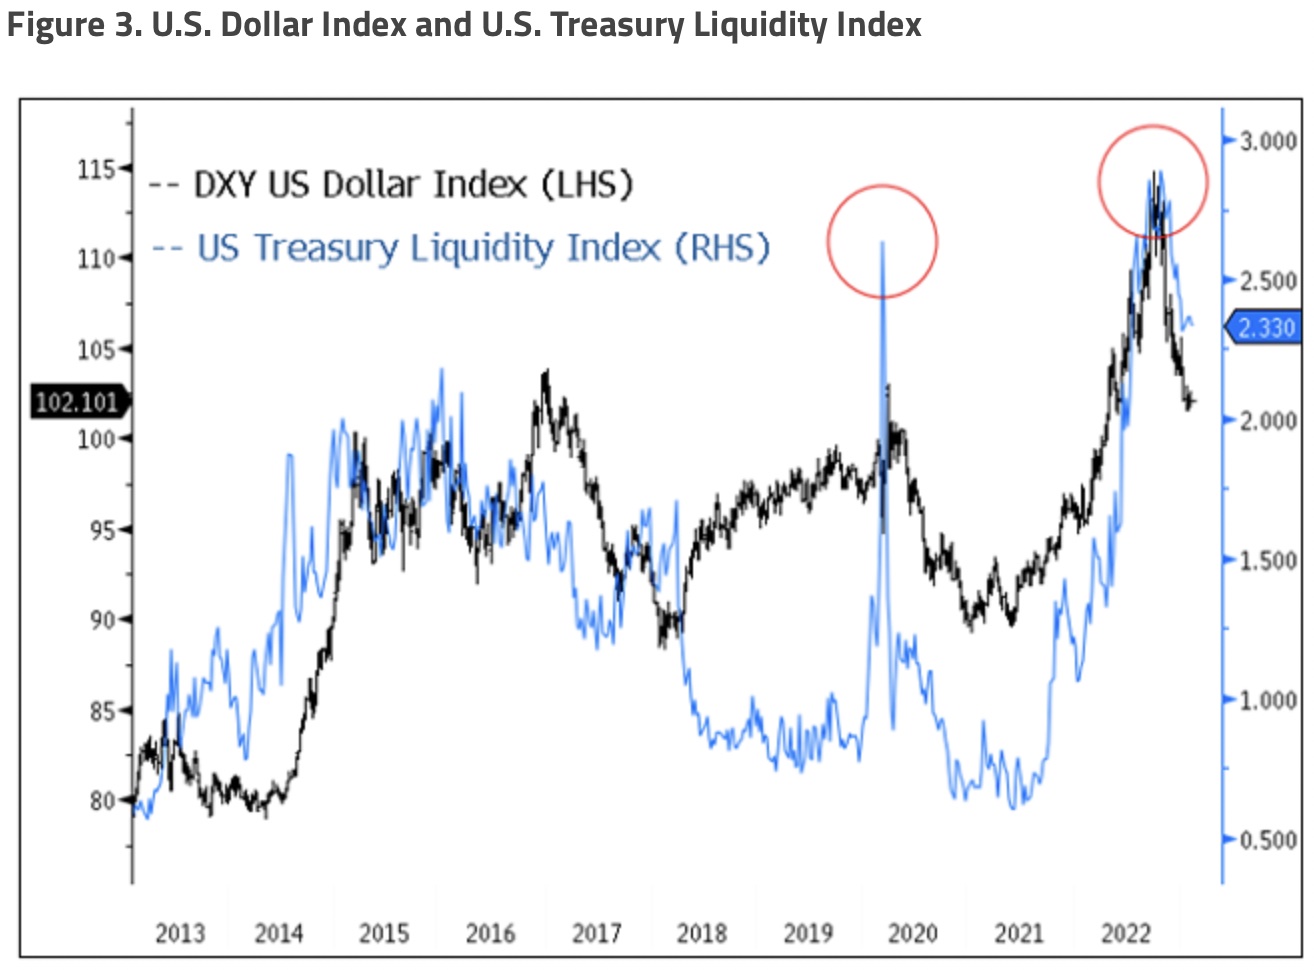
The Bloomberg US Government Securities Liquidity Index (a measure of liquidity condition for U.S. Treasuries) surpassed the crisis levels of March 2020, the last time the Fed was forced to intervene to restore market functioning with interest rate cuts, liquidity injections, swap facilities, etc. Generally, a strong USD reduces systematic market liquidity, and Figure 3 highlights this relationship. The U.S. Treasury market is the world’s largest and most liquid market. If it were to cease functioning properly, the spillover effects could be catastrophic in an overleveraged financial system under the wrong conditions. We would expect the days of runaway USD strength will not be allowed due to liquidity functioning alone.
Foreign Selling of U.S. Treasuries is Accelerating
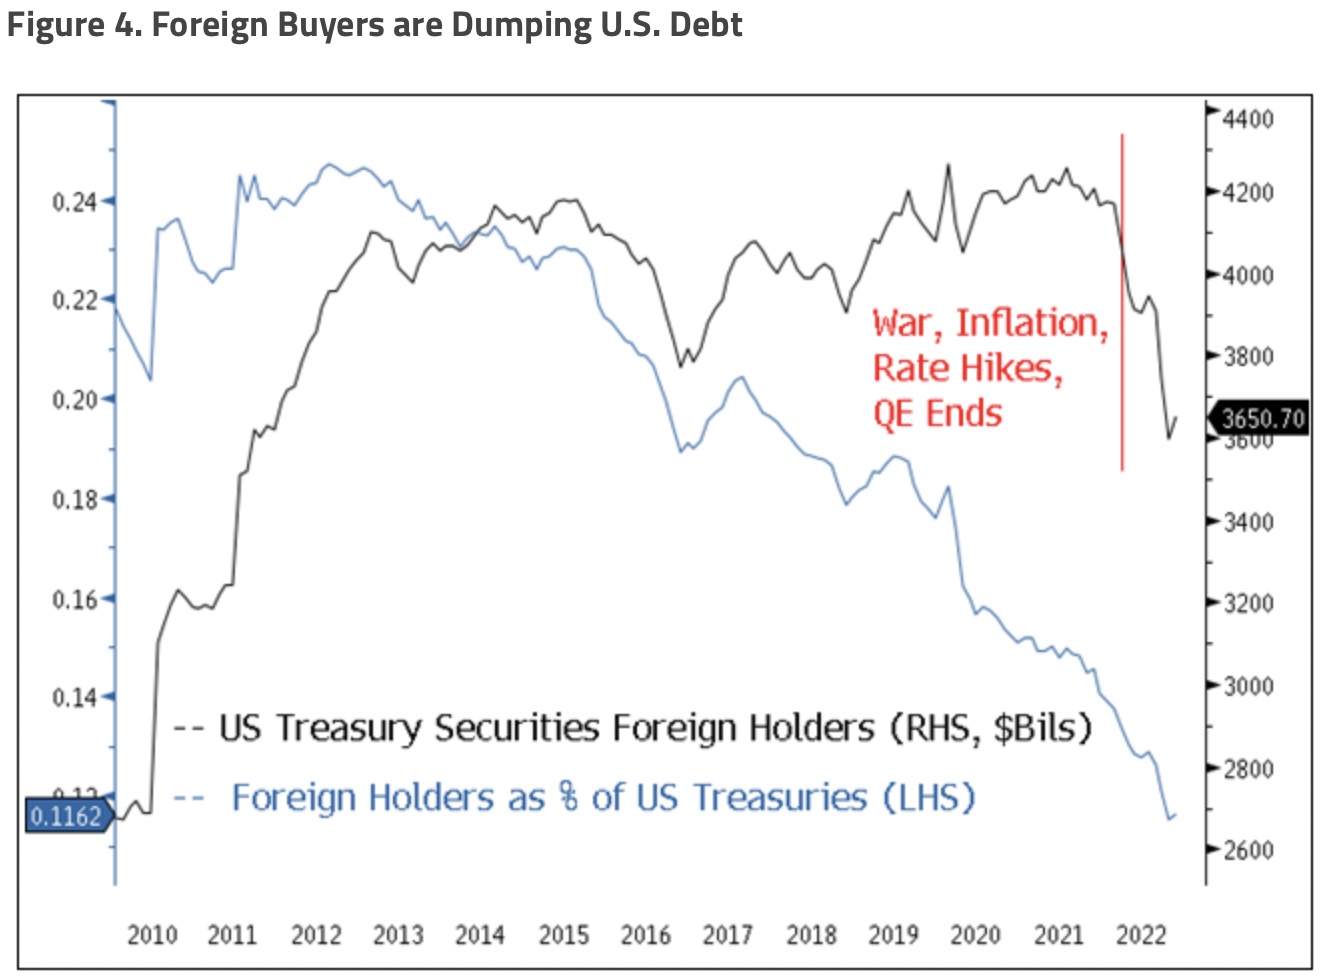
Foreign holdings of U.S. Treasuries as a percentage of total holdings peaked in 2013, a decade ago. Most of this time, the Fed provided quantitative easing (QE) programs, negating the need for foreign funding of Treasuries. In Figure 4, we highlight foreign ownership of U.S. Treasuries and the rapidly decreasing percentage of foreign ownership of U.S. Treasuries. In March 2022, foreign holders saw notable selling (~$516 billion). There were several reasons, including 1) the Fed ending its latest QE program; 2) geopolitics (the Russia-Ukraine war and intensifying de-globalization; 3) the start of an aggressive string of Fed rate hikes along with tightening by other central banks; and 4) USD weaponization, which had been occurring for several years but accelerated with the seizure of Russia’s foreign exchange (FX) reserves. After these events, U.S. Treasury Liquidity began to deteriorate, even worse than in March 2020. Without liquidity support for U.S. Treasuries, the probability of another QE program (or a variation built around YCC, i.e., yield curve control) within the next few years is no longer remote, even in the face of high inflation.
China Replacing U.S. Treasuries with Gold?
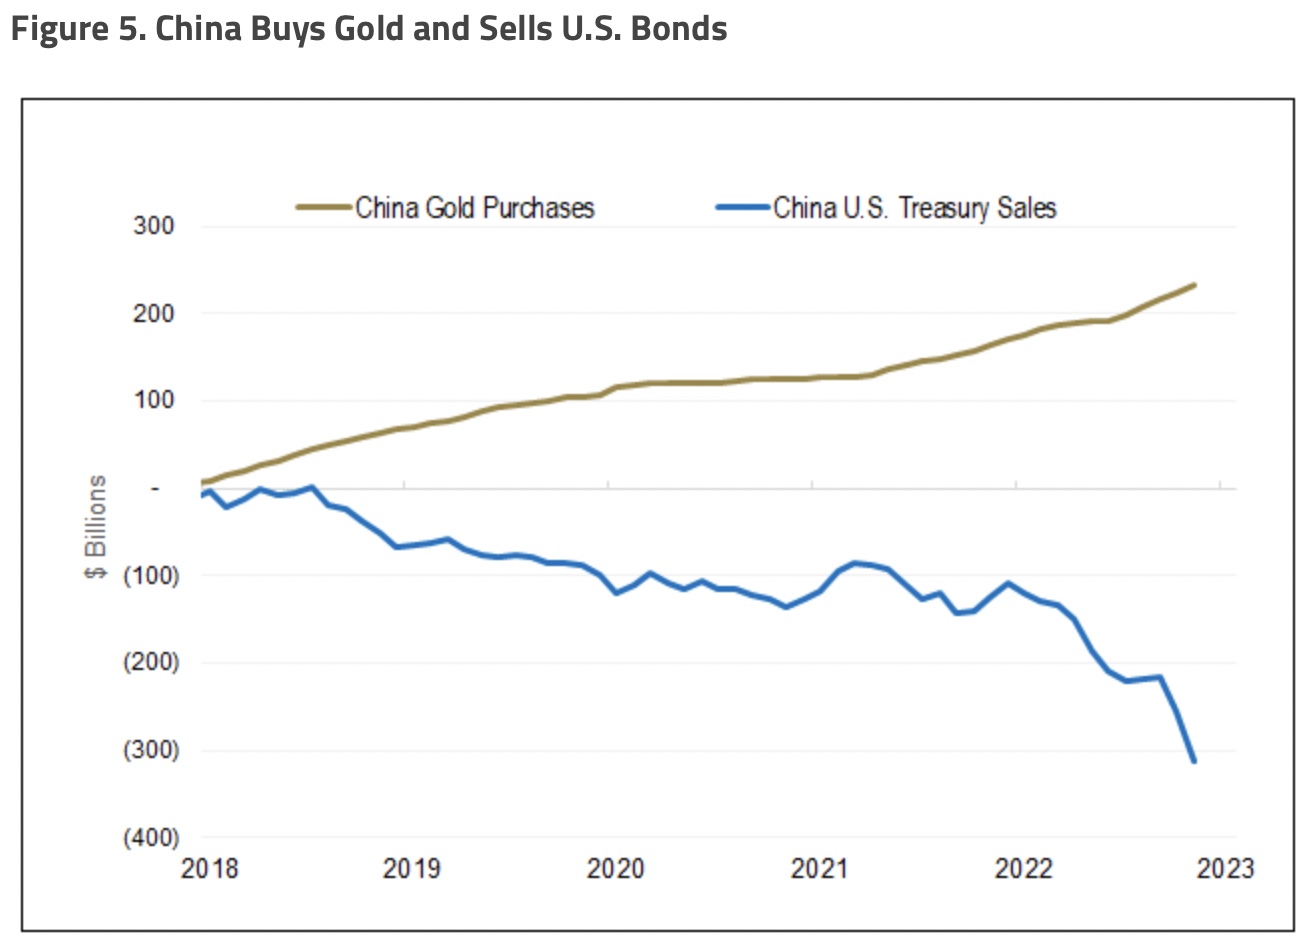
Since 2008, China has been the largest foreign holder of U.S. Treasuries. Though the peak has been in place since 2013, China has recently accelerated its selling of Treasuries. The reasons for China selling U.S. Treasury securities are varied and not disclosed. Still, since the U.S. sanctioned Russia’s FX reserves, China has a tremendous incentive to diversify its FX reserves. Figure 5 highlights the cumulative change in China’s gold imports and U.S. Treasures since 2018, measured in USD. 2018 was the first year of the U.S.-China trade war. The recent accelerated selling in U.S. Treasuries occurred at the start of the Russia-Ukraine war and in response to sanctions on Russia’s FX reserves. We expect China to continue reducing its U.S. Treasuries holdings as the economic war extends and intensifies, and the risk of future U.S. sanctions on China’s FX reserves remains present.
Since 2018, we estimate that China has sold $310 billion of U.S. Treasuries ($199 billion in 2022 alone) and has imported $230 billion of gold. China is estimated to have the seventh-largest global bond market, with the top six positions held by the U.S. and its allies. The list of the most liquid tradeable currencies has the same size ranking. In terms of market liquidity, safety as outside money and convertibility (sanctions resistant), gold remains a highly desirable asset for China.
Japan Yield Curve Control (YCC) and Selling U.S. Treasuries
The Bank of Japan (BoJ) began YCC in 2016 (0.25% cap on its 10-year yield) to achieve an inflation target of 2% and stimulate economic growth by controlling long-term interest rates. By late 2022, the BoJ did “technically” achieve its goals, although not the hoped-for “virtuous growth cycle” outcome. However, the costs were enormous as global yields soared while Japanese government bond (JGB) yields were capped at 0.25% by the BoJ. The yen had fallen in value by 22.5%, driving import cost inflation so high that the Ministry of Finance had to intervene in the currency market to defend the yen, while at the same time, the BoJ continued with YCC weakening the yen. If this makes no sense, then you have read this correctly.
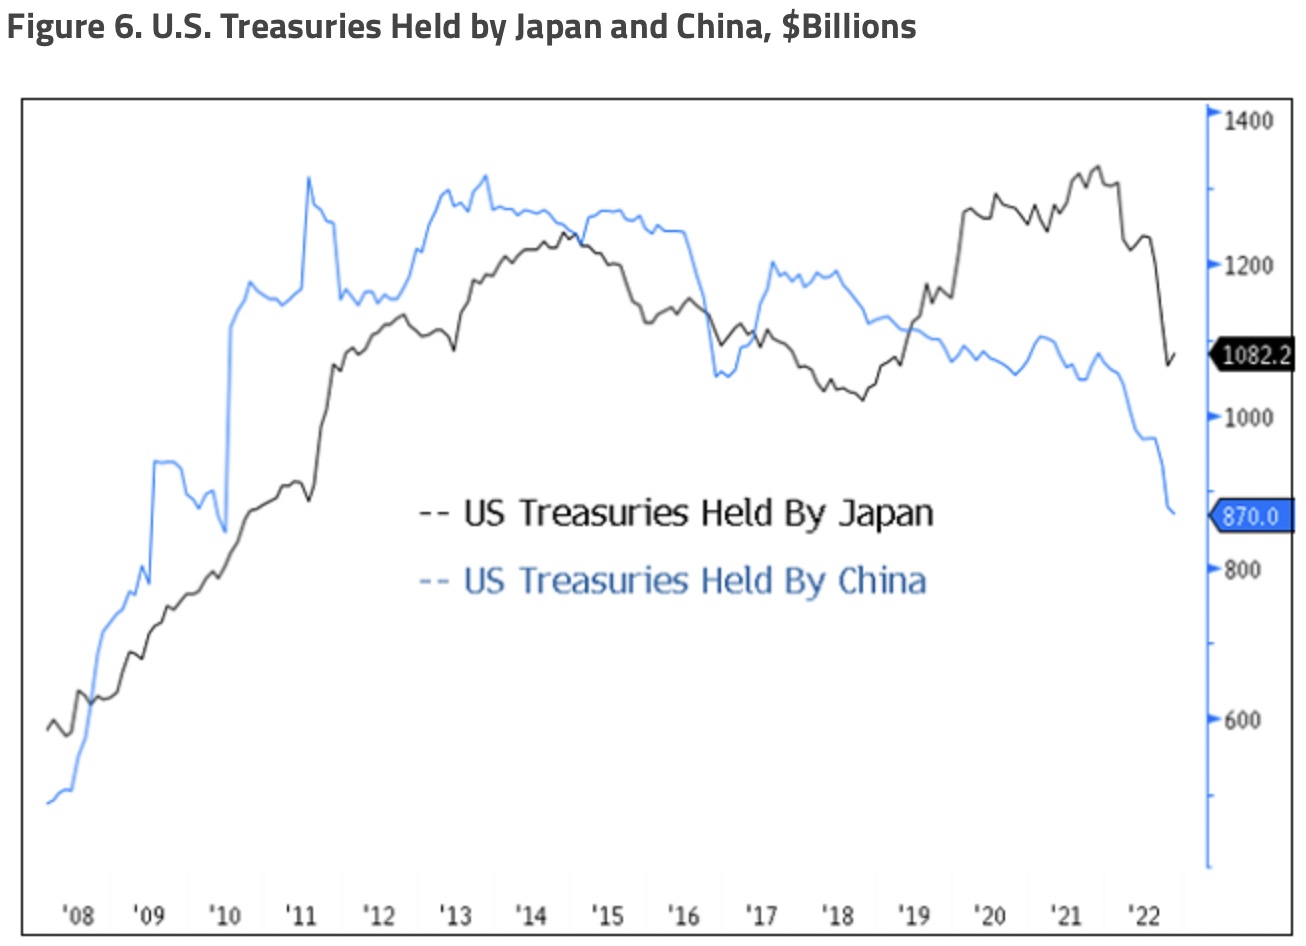
In December 2022, in a surprise move, the BoJ lifted the YCC cap to 0.50% from 0.25%, signaling to the market that the BoJ YCC had likely reached its best-before date. Since then, the yen has strengthened by ~15%, contributing to USD weakness. Capping JGB yields in the second half of 2022 as global yields soared required massive purchases of JGBs via QE. This 2H 2022 QE event was a monetary stimulus of 76 trillion yen or $550 billion (~14% of GDP, i.e., gross domestic profit). The end of this stimulus is likely to act as a de facto global tightening. Raising the yield cap also removed a global “low-yield anchor” on rates. Not only is this yield anchor fading, but Japanese institutional investors, one of the world’s largest foreign bond buyers, are returning to JGBs. Year to date as of this writing, U.S. Treasury holdings in Japan have declined ~$220 billion since the start of 2022. For various reasons, the two largest holders of U.S. Treasuries have sold $420 billion, or 17.5% of their combined holdings in 2022.
Foreign selling of U.S. Treasuries is increasing, and the Fed being in quantitative tightening (QT) mode leaves U.S. domestic investors as the primary buyers for U.S. Treasuries. Maintaining U.S. Treasury liquidity is now more critical than ever, and the looming debt ceiling standoff will be the next challenge. For gold, the immediate bullish catalyst is a weaker USD and lower real yields. Rising JGB yields will lead to higher U.S. nominal yields but lower breakeven yields (removal of stimulus weakens growth), resulting in lower real yields.
Gold vs. Bonds, Heresy Anyone?
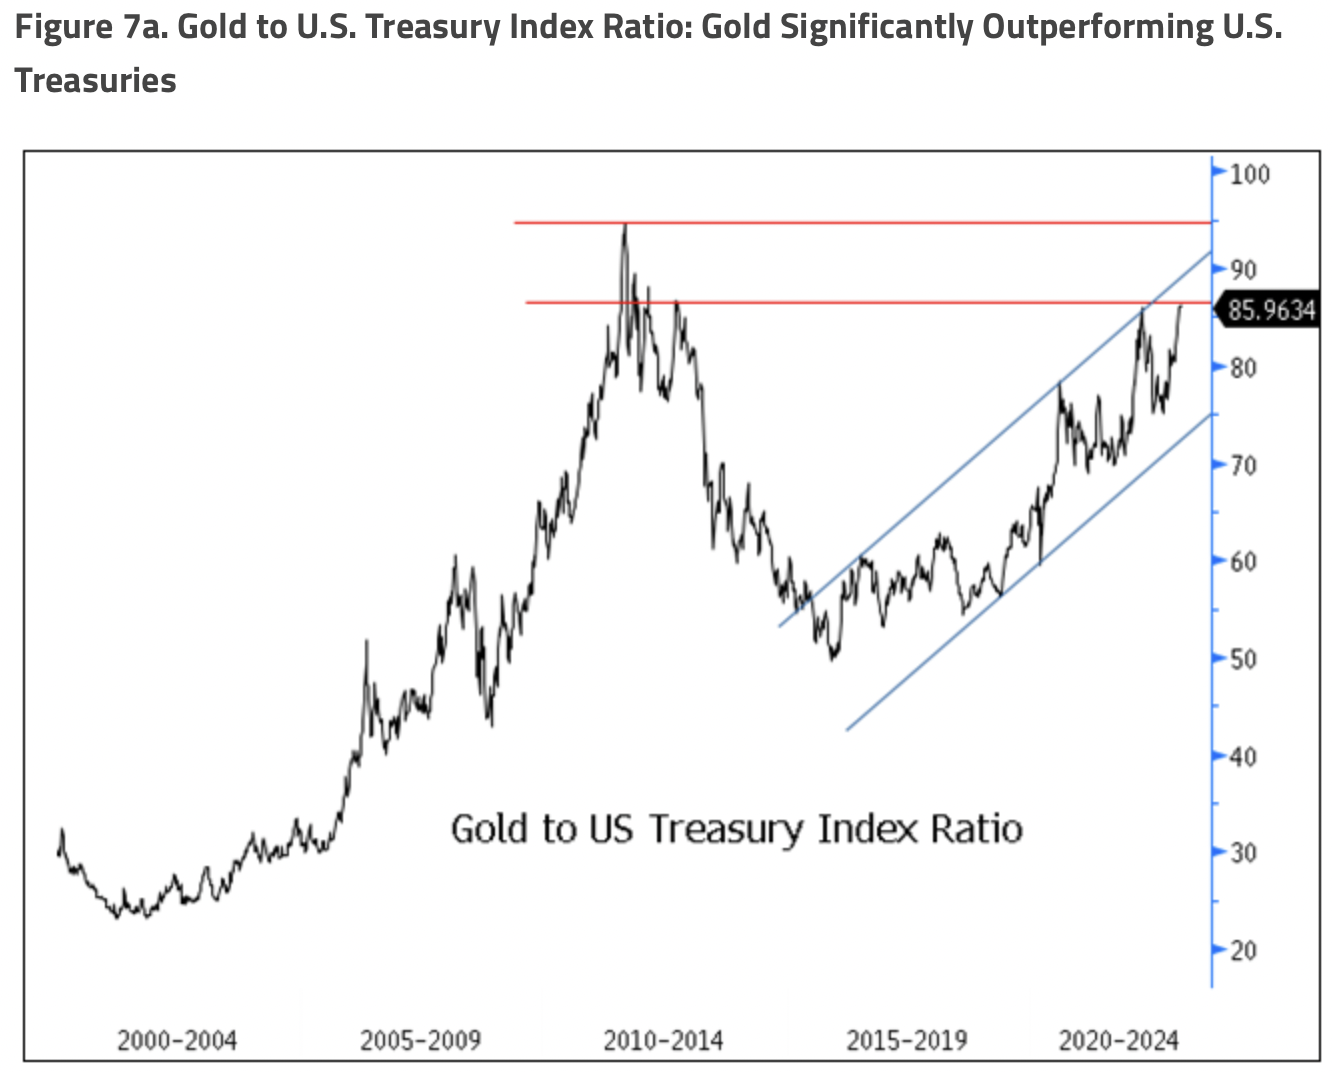
Thus far in 2023, there have been near-record capital inflows into the bond market after 2022 recorded the worst year for bond returns in 48 years of available data. In Figure 7a, we update the gold bullion to the U.S. Treasury Index ratio, highlighting that gold has outperformed over the past several years and even the past 20 years. The gold-Treasury ratio is testing the upper resistance level, and we expect an eventual break higher. Figure 7b highlights the performance of gold versus U.S. equities and U.S. bonds over the past five and 20 years, with performance and portfolio metrics highlighting how well gold has performed and behaved.
Despite these positive metrics, gold is still not widespread in investment portfolios. In the past five years, gold compared to both equities and bonds, has a better Sharpe ratio (risk-adjusted return), a better Sortino ratio (lower downside volatility) and the lowest market correlation (increased diversification).
Gold has outperformed U.S. Treasuries over the past two decades despite the bond market having the advantages of a dovish accommodative Fed (QE, ZIRP, NIRP) with volatility-destroying practices (forward guidance, Fed put). Furthermore, most of the past 20 years were dominated by low inflation, low macro volatility, negative stock-bond correlations, etc., all favoring bond performance. In our 2023 Top 10 Watch List, we highlighted several significant macro changes underway, all pointing to higher inflationary pressures and increasing volatility. If gold outperformed U.S. Treasuries in the past decades, we believe the chances are excellent that it is also likely to do so in the next several years.

ALSO JUST RELEASED: James Turk – Here Is The Big Picture For Gold & Silver After Pullback CLICK HERE.
ALSO JUST RELEASED: Lowest In More Than 50 Years? Plus Another Recession Warning CLICK HERE.
ALSO JUST RELEASED: Silver May Hit $700 After Multi-Decade Breakout CLICK HERE.
ALSO JUST RELEASED: Newmont Newcrest Merger May Kickoff A Golden Wave Of Merger Mania CLICK HERE.
ALSO RELEASED: The Global Financial System Is Already Doomed And The Collapse Will Be Terrifying CLICK HERE.
To listen to Stephen Leeb discuss Putin, gold, China, the US and what surprises to expect in 2023 CLICK HERE OR ON THE IMAGE BELOW.

To listen to Alasdair Macleod discuss the $100 takedown in the paper gold market and what to expect next CLICK HERE OR ON THE IMAGE BELOW.

© 2023 by King World News®. All Rights Reserved. This material may not be published, broadcast, rewritten, or redistributed. However, linking directly to the articles is permitted and encouraged.


