

Sprott says that China is aggressively buying gold, which is a major reason for the recent price spike, but look at what is boosting silver.
Central Banks Support Gold & Solar Demand Boosts Silver
October 24 (King World News) – Paul Wong, Market Strategist at Sprott Asset Management: Central banks support gold and solar PV demand buoys silver.
Key Takeaways
- In bullion markets, gold fell modestly in the third quarter, while silver remained largely rangebound due to a lack of specific catalysts.
- Investment demand for gold has slumped, based on funds’ gold positioning, while demand from sovereigns and central banks remains solid.
- Among sovereigns, China is the most significant gold consumer globally, and recent spikes in the Shanghai gold premium suggest continued demand for gold in China.
- Green technologies have emerged as the largest demand vector for silver — including the uptake of solar panel technology, the rise of electric vehicles and the shift to 5G cellular service.
- Industrial demand for silver, especially for solar panels, is expected to put the silver market in deficit again this year and create significant market imbalances in the future.
Gold/Silver Market Overview: High Yields Hamper Risk Assets
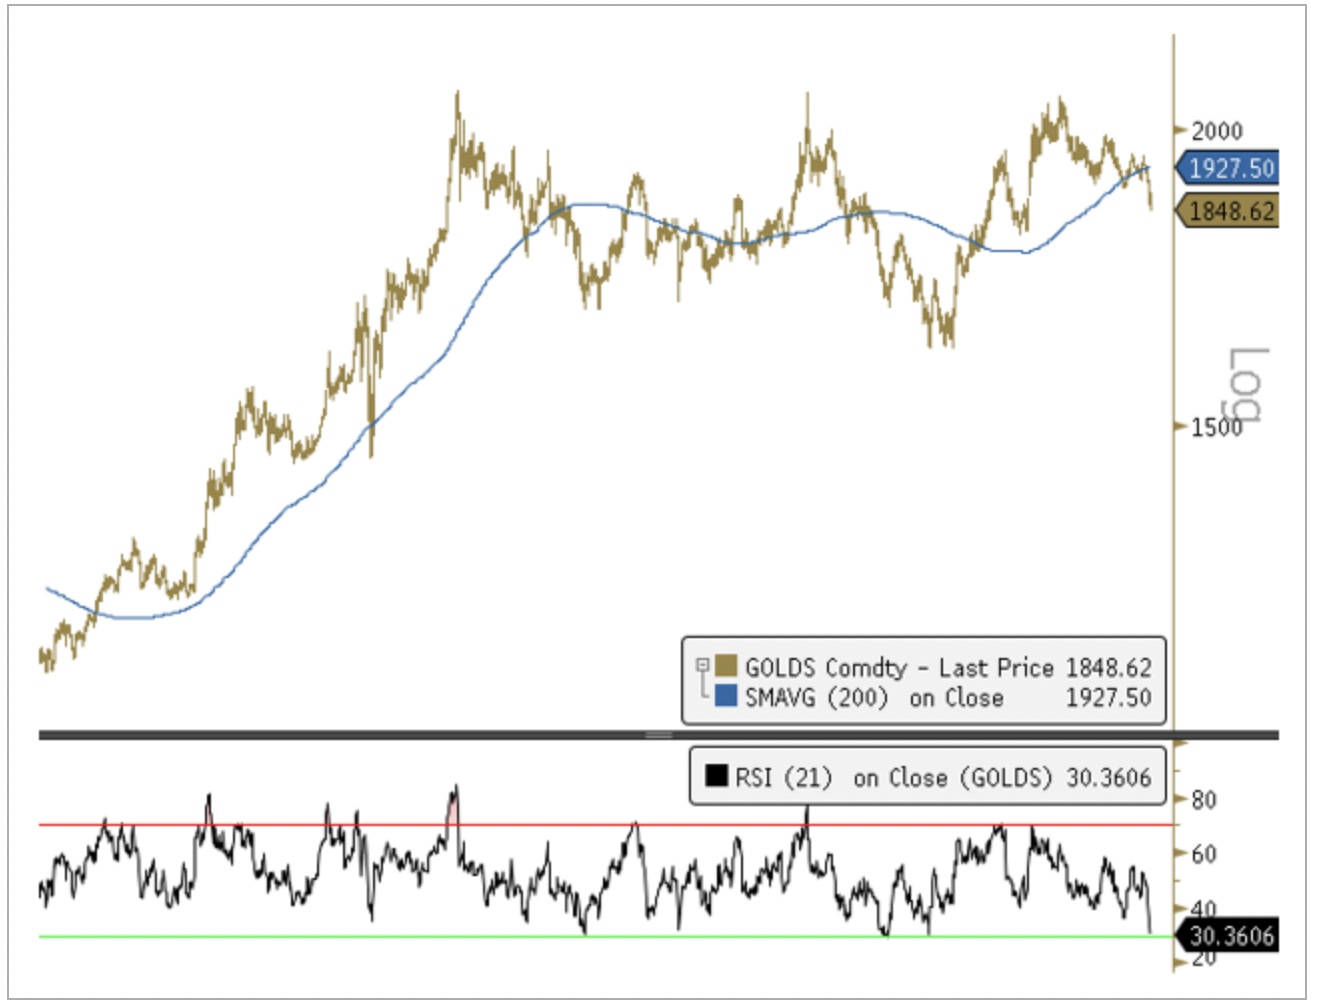
Gold bullion fell $70.72/oz (or -3.68%) during the quarter ended September 30 to close at $1,848.63. Gold had held flat until the last week of September despite the surging U.S. dollar (USD) and bond yields. U.S. 10-year Treasury bond yields closed at their highest level since 2007, and the U.S. Dollar Index (DXY) rallied for 11 consecutive weeks to close 6.9% above its 52-week low. Silver dropped $0.60/oz (or -2.61%) last quarter to close at $22.18. Gold mining equities were more exposed to the macro environment, falling 10.38% during the third quarter.
After peaking in late July, the broad equity market faced challenges due to a convergence of factors, including a surging USD, worries about increased debt issuance and deficits, rising real yields and widening economic disparities among the U.S., China and the EU. Weaknesses in major currencies such as the yen (due to the Bank of Japan’s yield curve control policy) and the yuan (due to China’s economic and credit problems) continue to aid the USD, but also create currency and liquidity risks. Countries with weak currencies that cannot afford further depreciation are straining under the higher rates needed to defend their currencies. The other option for currency support — selling foreign exchange reserves — effectively drains liquidity and is an even worse outcome. The spike in crude oil prices adds to this risk by further draining liquidity and increasing growth concerns, particularly in the already fragile Chinese and EU economies.
Real yields have reached 15-year highs at an alarming pace, further tightening financial conditions. Historically, simultaneous increases in the USD, real yields and crude oil prices have detrimentally impacted risk assets via the liquidity channel…
ALERT:
Legendary investors are buying share of a company very few people know about. To find out which company CLICK HERE OR ON THE IMAGE BELOW.
 Sponsored
Gold Bullion: China Keeps Buying as Funds Pull Back
Like many other assets, gold bullion has come under selling pressure from the global liquidity drain. Rising yields (nominal and especially real yields) are draining capital from all assets, and the rising USD is adding stress to U.S.-dollar funding liquidity. CTA-type funds have sold down, but mainly added to their short positions as liquidity pressures mounted.
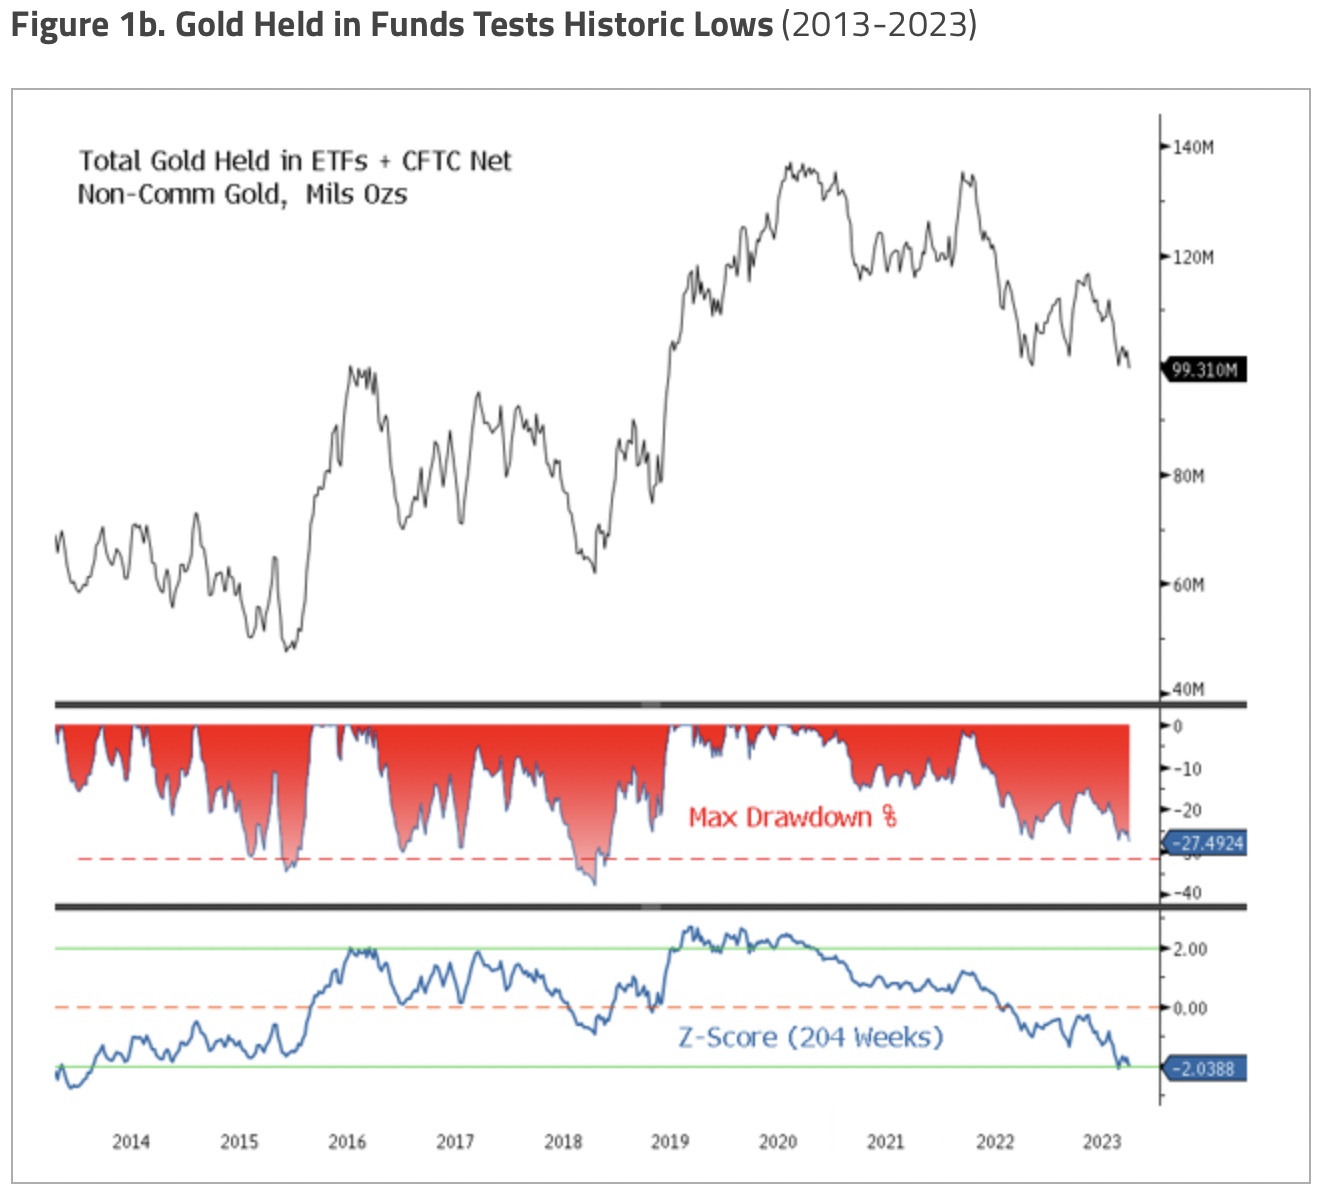
When reviewing the positioning of investment funds, we use the total amount of gold held in ETFs and CFTC net non-commercial gold holdings as a proxy. As shown in Figure 1B, the amount of gold held by investment funds is quickly approaching historical maximum drawdown levels, with its two-year Z-score falling below -2 for the first time in a decade (a Z-score of less than -2 means the funds’ current gold holdings are more than two standard deviations below their historical mean). From the 2023 highs, CFTC long reductions accounted for approximately 20% of the decline in positioning. Short additions and ETF selling were about 40% each, indicating a high degree of vulnerability to a possible future short squeeze, should one develop.
China Boosts Gold’s Price Floor
As the world’s most significant gold consumer, China has been a subject of speculation regarding the amount of gold it consumes annually. This speculation centers on purchases from its central bank, the People’s Bank of China (PBoC). Many believe that the PBoC’s official reports underestimate the true extent of China’s gold holdings.
The Shanghai Gold Exchange (SGE) plays a significant role in China’s gold market. The PBoC controls gold bullion imports through quotas issued to approved commercial banks, with all bullion imports passing through the SGE. Domestically mined gold is also incentivized to be refined into Shanghai Good Delivery (SGD) products and sold through the SGE. Renminbi (RMB) weakness has led to reports that the PBoC has halted the issuance of new gold import quotas to prevent the selling of RMB to buy gold. This restriction has tightened the domestic gold market, resulting in a rise in the Shanghai gold premium over London prices.
Geopolitical tensions, concerns over USD hegemony and the PBoC’s desire to increase international use of the RMB (de-dollarization) will likely drive continued additions to China’s gold holdings. If the PBoC were to target its official gold reserves to match the average global central bank, it would need to purchase several hundred tonnes of gold under various assumptions. While these purchases may not immediately impact gold prices, they contribute to a higher price floor and reinforce gold’s long-term importance as an asset class…
This silver explorer recently did a huge transaction with a $4.5 billion market cap producer CLICK HERE OR ON THE IMAGE BELOW TO LEARN MORE.

The Pull of Gold for China
China and others (like Russia) have employed gold to mitigate the impact of USD weaponization and potentially exert influence on the global financial system. Gold is critical for China’s currency management due to external selling pressures and its longer-term goal to internationalize the RMB. China’s commitment to bolstering its gold reserves has been unwavering throughout the past decade, driven by China’s need to enhance its economic and geopolitical standings.
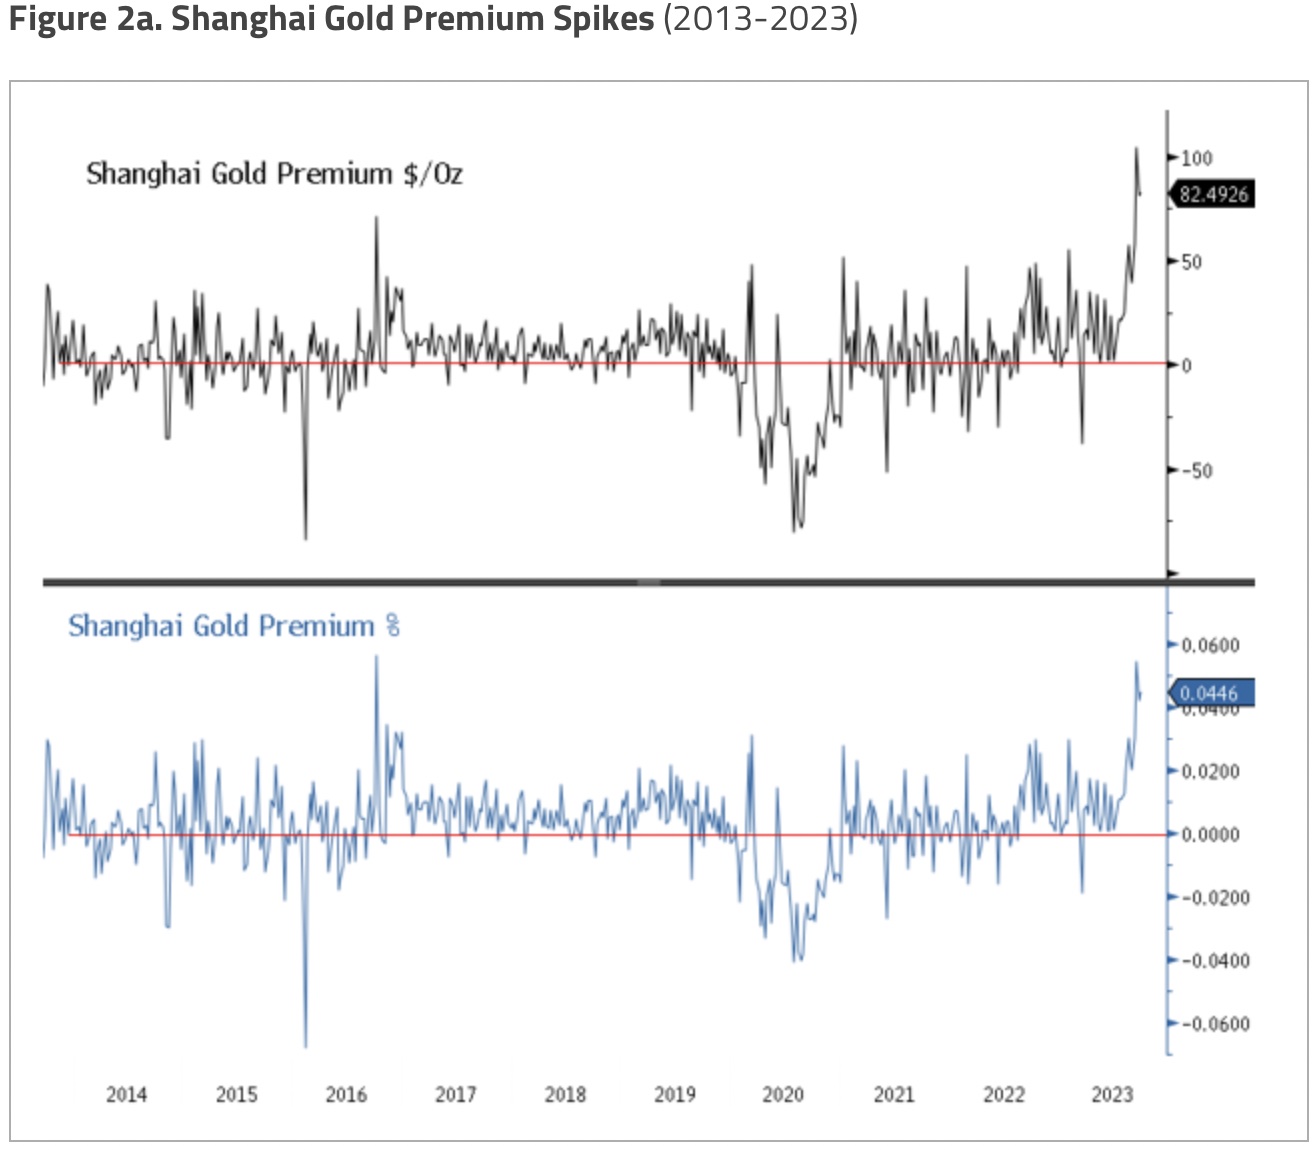
The SGE differs from other exchanges because of its specialized focus on precious metals, emphasis on physical delivery, domestic orientation and role in determining benchmark prices for the Asian market. These distinctions make it a singular institution in the global financial landscape and serve a specific niche within the commodities market. The SGE also plays a pivotal role in China’s gold strategy due to its unique structure, granting China substantial influence on the global price of gold. This influence manifests as a higher gold price in China — the Shanghai gold premium — encouraging increased imports (see Figure 2a).
Traditionally, gold flowed from the west to the east when gold prices experienced a decline and, conversely, moved in the opposite direction when prices surged. However, recent market dynamics have shifted, and gold is migrating from west to east despite the rising gold price. The Shanghai gold premium has surged to record highs, possibly due to tightening local demand and supply conditions as the PBoC alters import quotas to prevent further selling of RMB to buy gold. The PBoC has been attempting to stem or slow the RMB’s relentless decline, but the spike in the gold premium indicates a strong pull of gold toward China.
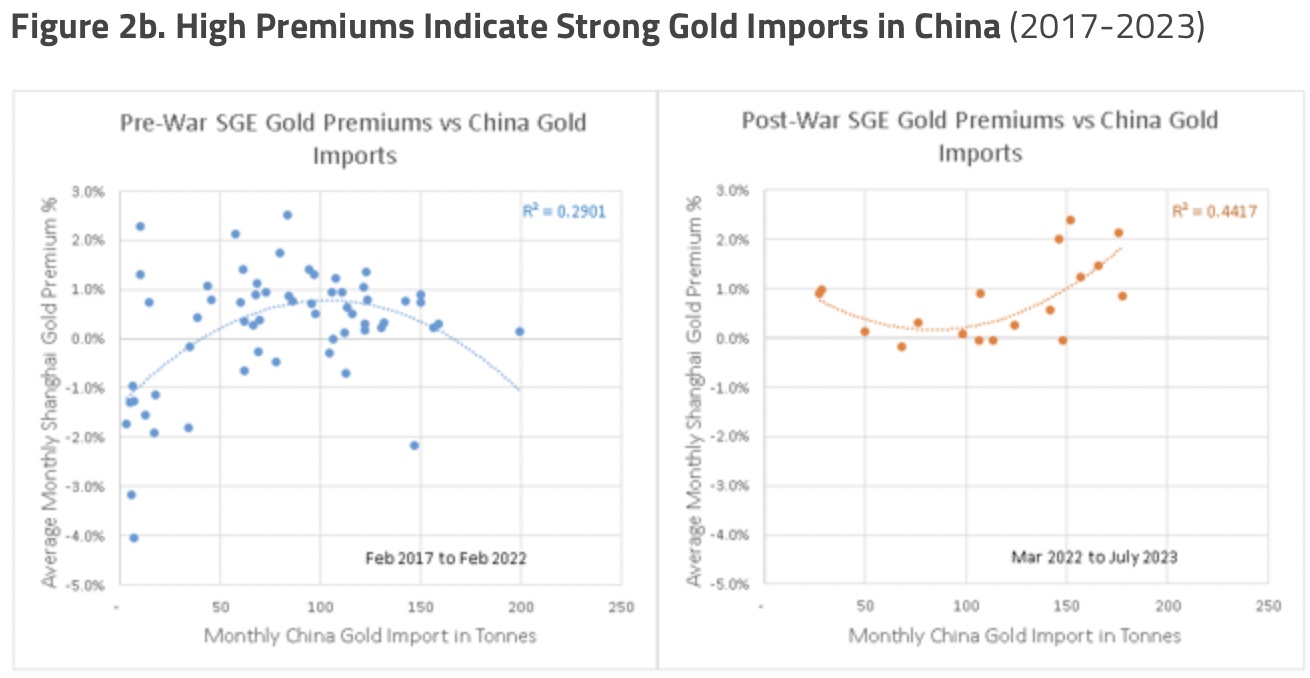
There appears to have been a significant change recently in the relationship between the Shanghai gold premium and China gold imports. In Figure 2b, we show two charts of this relationship for comparison: before and after the start of the Russia-Ukraine war. Though the recent data is still limited, the post-war plot (right chart) shows much higher Shanghai gold premiums, more significant monthly gold import numbers, and a well-defined positive correlation between premiums and imports. China’s latest gold import data is only available as of July 2023. Still, we note that the Shanghai gold premium for August averaged 2.18%, and September averaged 4.04% — the highest monthly average recorded. We would not be surprised to see a large gold import number when the new data is released. This may further support the thesis of continued strong gold flows to China if it bears out.
Fear of Negative Bond Convexity
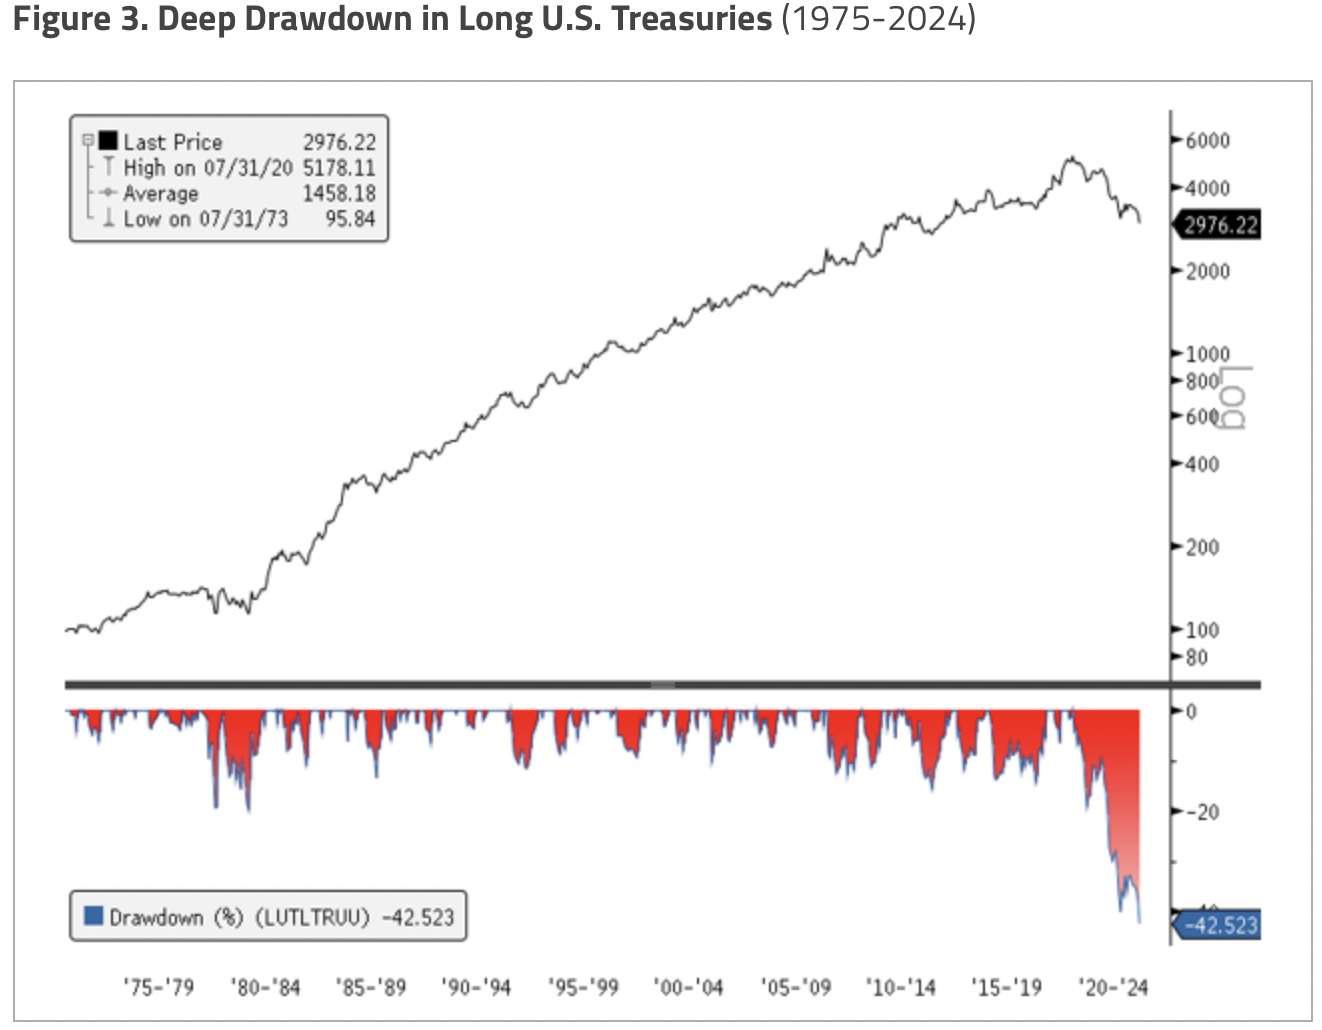
The bond market is in turmoil, marked by extreme selloffs, uncertain interest rate trajectories, rapidly expanding debt and deficits, massive projected U.S. Treasury issuances and fears of the erosion of political and policy credibility. Long-duration U.S. Treasuries are experiencing a severe selloff (see Figure 3), resulting in a -42.5% drawdown and an unprecedented third consecutive annual loss. Upticks in the ICE BofA MOVE Index, which shows implied volatility of U.S. Treasury bond options, raise concerns about the impact of these developments on the financial stability and liquidity functions of the U.S. market.
Negative convexity events, exemplified by incidents like the UK’s Liability-Driven Investment (LDI) crisis in September 2022 and the U.S. regional bank crisis this year, may loom as bondholders reduce exposure to cope with the sharp downturn in bond prices. The higher-for-longer rhetoric from the U.S. Federal Reserve (“Fed”) and its hawkish dot plot signal that interest rates will likely remain elevated for an extended period. This raises a question as to what exactly the neutral rate of interest is, or r* — the rate that is neither accommodative nor contractionary. While arguments exist for structurally higher rates, the current economic environment is unlikely to comfortably accommodate a 5% long-term U.S. Treasury yield and high policy rates, which poses potential risks to the financial system.
Recession?
Investors are watching for signs of a recession and the potential implications for bond yields and exchange rates. Perhaps the “ultimate fear” is losing U.S. political and policy credibility. Yields typically do not rise in a recession; however, if they were to move higher alongside a weaker dollar, that would indicate the “debasement trade” is taking hold. The UK’s LDI crisis exemplified this trend when UK gilt yields rose sharply, and the pound weakened amid fiscal panic. This risk would likely show up in widening credit spreads and a rapid rise in credit default swaps. At this point, gold typically decouples from liquidity-draining trading flows and increases in price as safe haven buying takes hold among traders, funds, central banks, sovereigns and the like.
Silver: Solar Technology Drives Demand
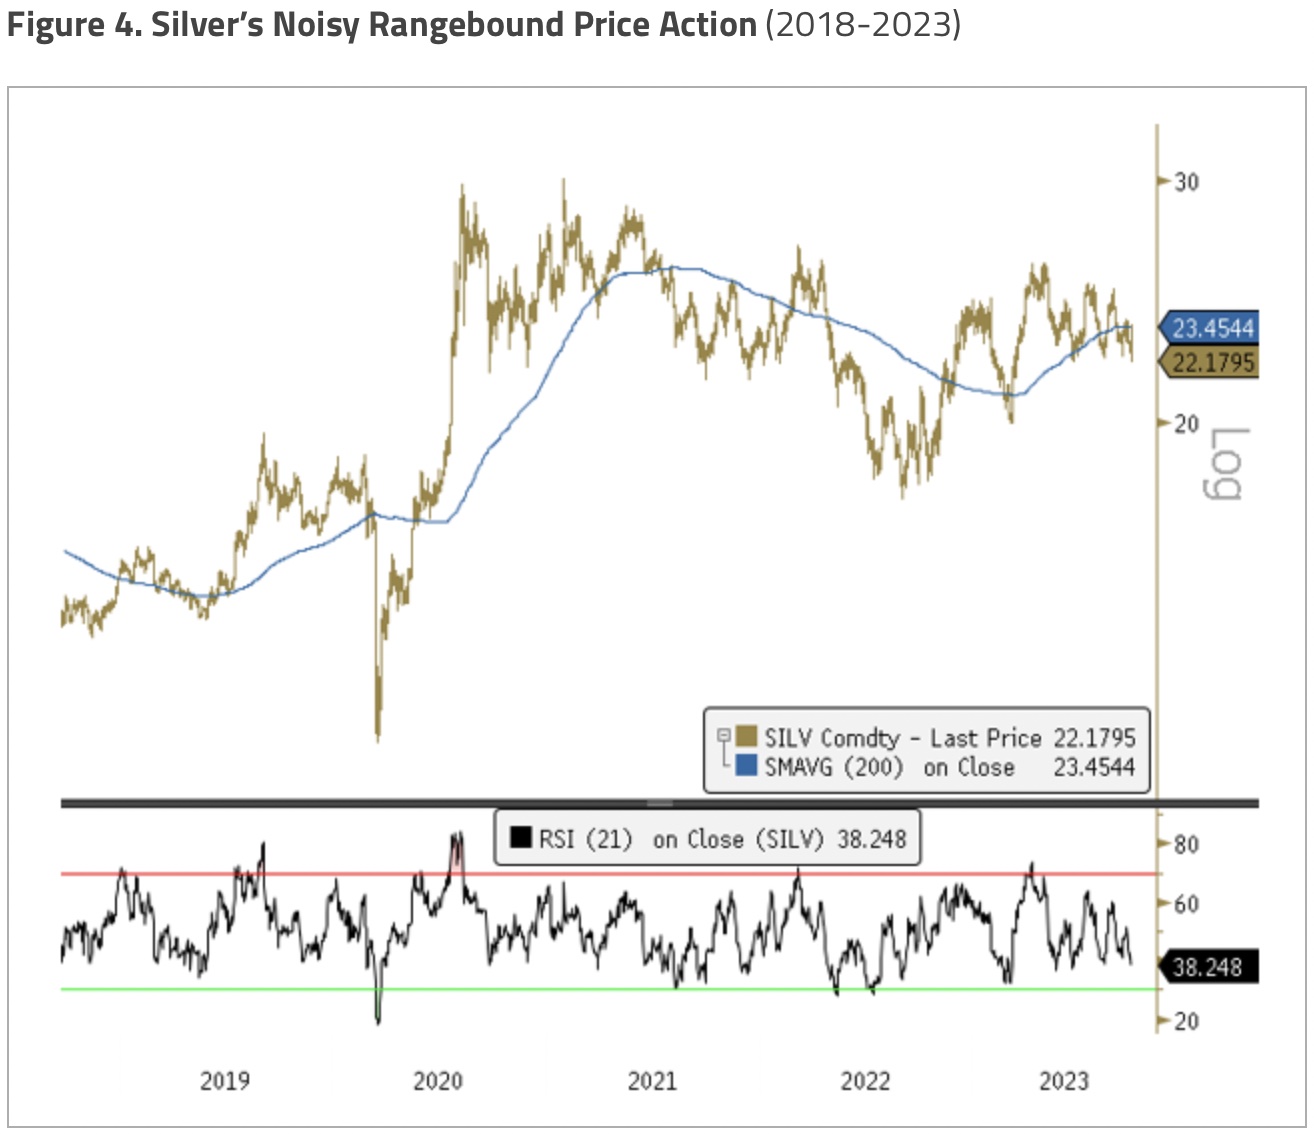
Silver bullion fell $0.60/oz (or -2.61%) in the quarter ending September 30 to close at $22.18, above its $20/22 band of support. Like gold, silver has been affected by the liquidity-draining effects of the surge in U.S. yields and the USD. Silver has been largely rangebound year to date, with sharp price swings mainly driven by CTA-type funds buying into rallies and selling into liquidations. With a lack of major silver-specific pricing catalysts this year and silver’s significantly lower liquidity relative to gold bullion (typically less than one-tenth), CTA-type buying has dominated trading activity, creating more trading noise than price information (see Figure 4).
Silver Critical to Photovoltaics
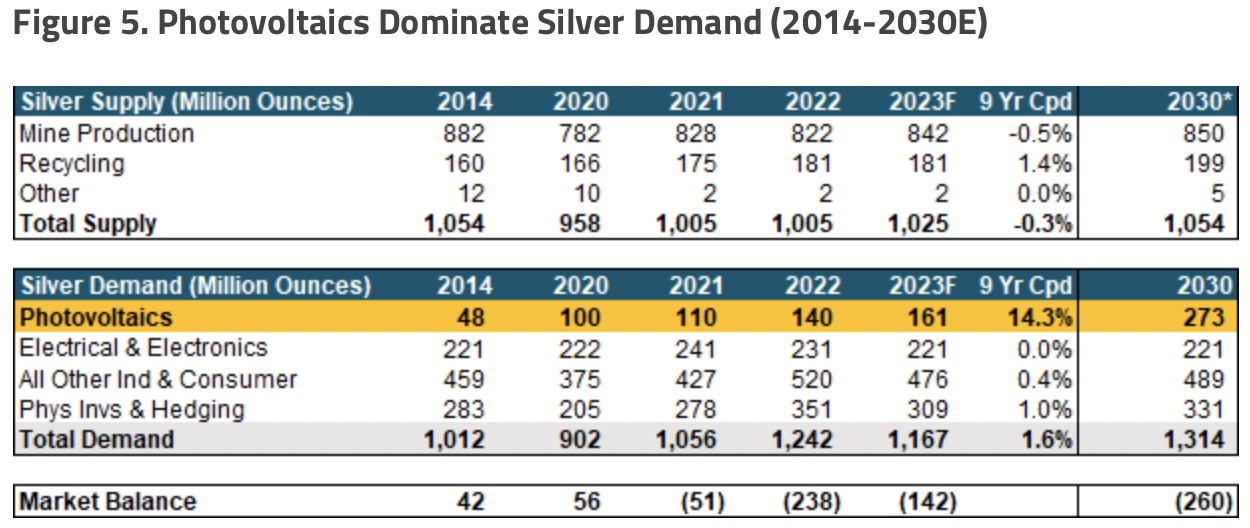
Despite pressure from interest rate hikes, overall industrial demand for silver relative to supply is expected to put the silver market in deficit again by an estimated 142 million ounces this year (see Figure 5). 2023 is forecast to be a record year for demand for silver from green energy and technology, based on factors that include the uptake of solar panel technology, investment in renewable energies, the rise of electric vehicles and ongoing 5G cellular service upgrades.
Our recent September 2023 Energy Transition Materials Report highlights the expected growth of solar panels (photovoltaics) over the next several years. With the dramatic fall in the cost of solar power (now one of the lowest costs of all electricity sources — renewable or fossil fuel), growth is expanding dramatically.
Solar Moves into Super-Growth Mode
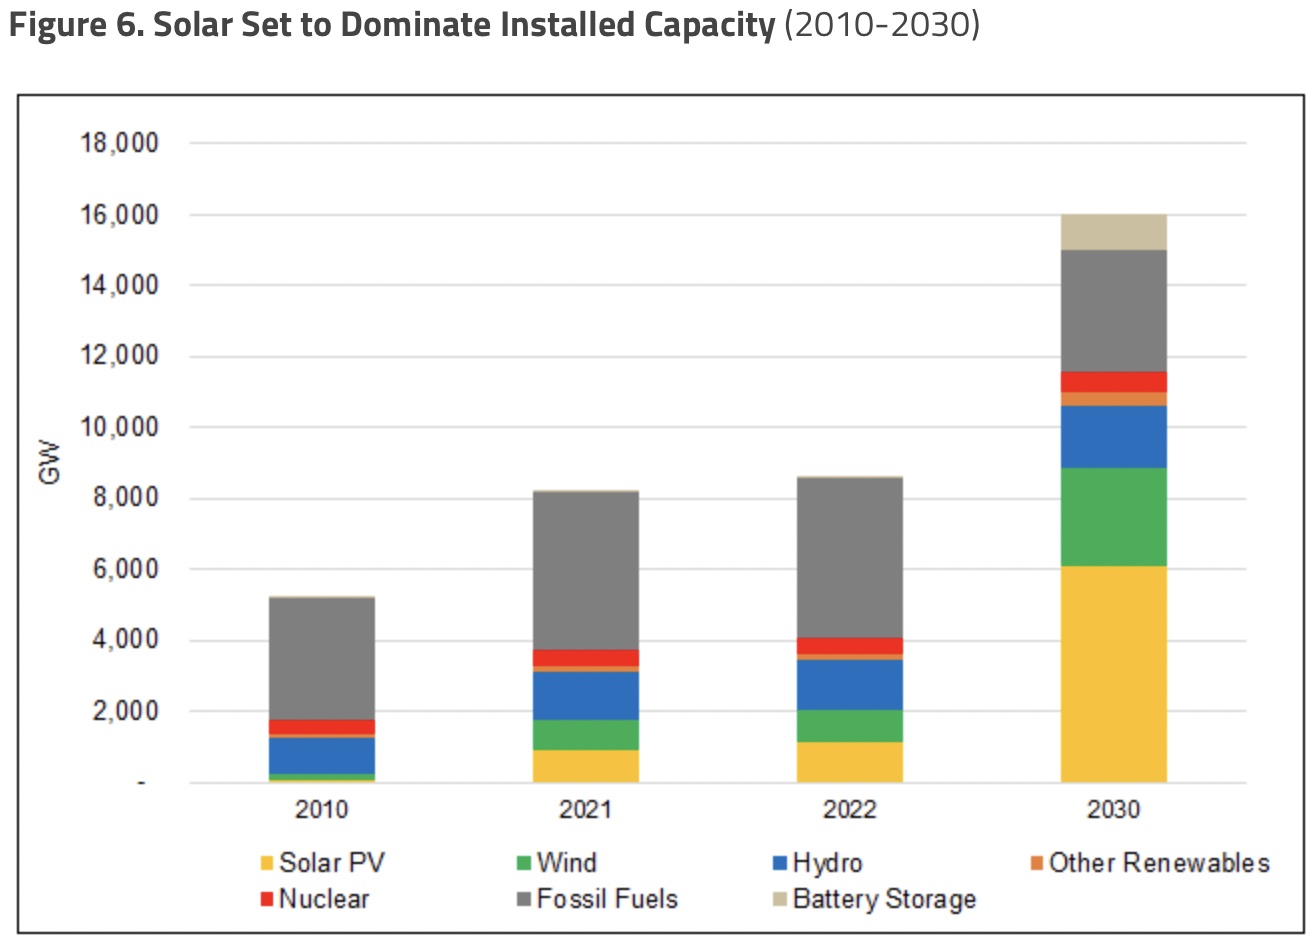
Solar photovoltaic (PV) panels are leading the transition to clean energy due to their cost-effectiveness, low environmental impact and long lifespans. Renewable electricity sources are expected to account for 98% of global capacity expansion in the years ahead, with solar energy capacity forecast to grow faster than any other source (see Figure 6). Over the past several years, the cost of solar power-generated electricity has fallen to about half of natural gas, around two-thirds of coal and about equal to wind power.
China dominates global solar PV supply chains with approximately 80% market share, driven by government policies and investments. The effect has been to make clean energy more affordable everywhere. However, significant concerns persist about environmental impacts and supply chain concentration. Solar panels offer a clean energy alternative, but re-shoring and diversifying supply chains, and reducing environmental impacts are vital to ensuring a sustainable and resilient solar future and enhanced energy security.
Solar panels require significant amounts of silver due to the metal’s unmatched electrical conductivity, thermal efficiency and optical reflectivity. Silver is used for critical components in solar panels to ensure efficient electricity flow and maximize energy conversion. While there has been a deliberate reduction in silver intensity in solar panels in recent years, this thrifting process appears to have reached its limits. Silver’s unparalleled conductive properties make it difficult to replace without reducing efficiencies. Hence, the solar industry’s demand for silver is increasing significantly and is expected to be 14% of total silver demand in 2023 compared to 5% in 2014 (according to the IEA). By 2030, silver demand from solar panels could increase by almost 170% to roughly 273 million ounces — or about one-fifth of total silver demand — based on current trend projections (using BloombergNEF’s estimate of 12 tonnes of silver demand per gigawatt of solar capacity).

New Panels Use More Silver
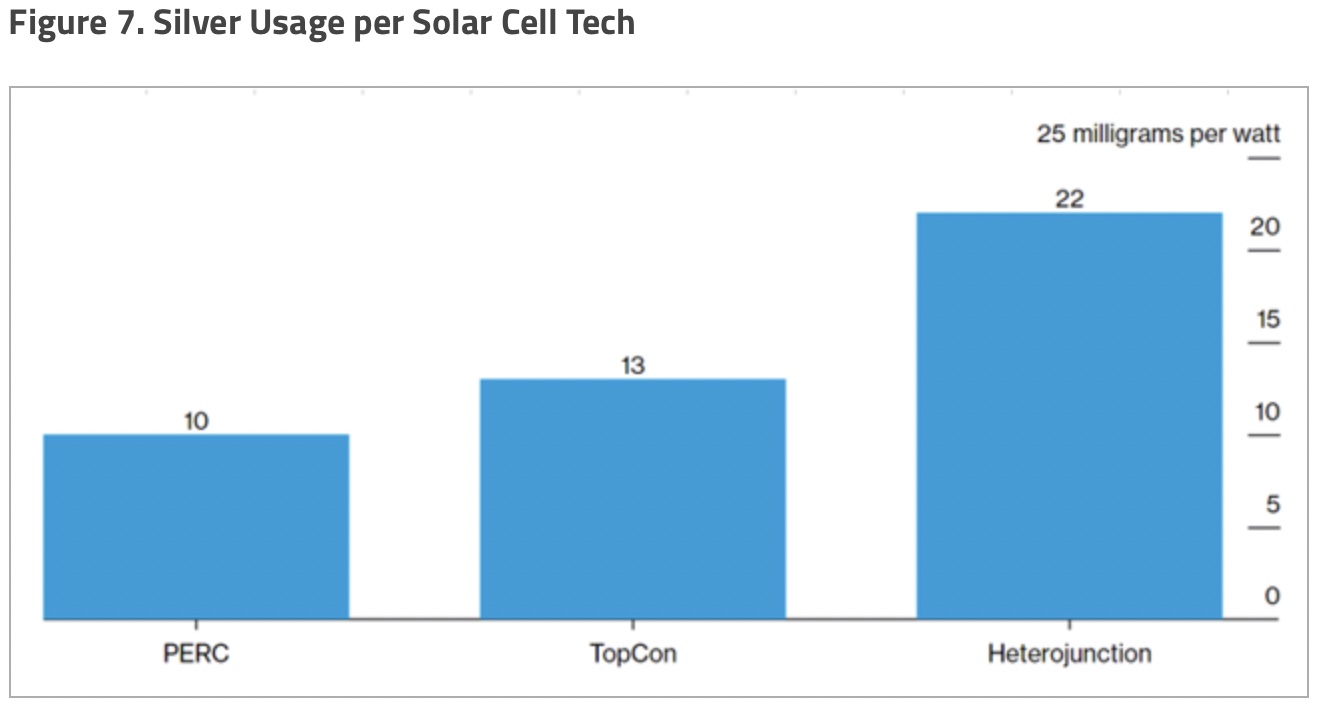
Over the past several years, silver use per watt in solar panels has dropped by about 46% (according to The Silver Institute). Standard solar cell technology, known as Passivated Emitter and Rear Contact, or PERC, solar cells, now uses just 10 milligrams of silver per watt versus 18.5 milligrams as of a few years ago, according to manufacturers (see Figure 7). According to the China Photovoltaic Industry Association (CPIA), PERC accounted for 88% of crystalline silicon solar cells in 2022 and is expected to drop to 76% in 2023.
PERC cells will be replaced by new and more efficient cell designs that use more silver. Higher efficiency means producing more power from solar cells from the same area, reducing the system cost per watt. Tunnel Oxide Passivated Contact (TOPCon) cells are expected to grow from 8% of the market to 18% this year; these contain 13 milligrams of silver per watt and are favored for expansion by most large-scale manufacturers. Heterojunction (HJT) technology uses more silver at 22 milligrams per watt. HJT was just 0.6% of the market in 2022, but could reach 3% this year. It is the highest efficiency but the most expensive mainstream cell technology.
However, the rapid growth of the solar industry and its near-inelastic demand for silver pose a supply challenge. Primary silver production has stagnated (see Figure 5), and about 80% of the silver mine supply comes as a byproduct from lead, zinc, copper and gold production. The scarcity of primary silver mines and the reluctance of miners to invest in new base metal projects mean that higher silver prices are an insufficient catalyst to boost mine output. Supply strains and negative market balances are expected in the coming years. Manufacturers are exploring alternatives to reduce silver usage in favor of other metals like copper, but widespread adoption of substitutes will likely only occur after silver prices rise significantly.
Given its critical role in solar cell production, the increasing demand for PV installations will likely pressure the silver market. While the solar industry’s current and long-term demand for silver is rising, other industrial sectors that use silver, like electronics and construction, face short-term uncertainty due to the global economic outlook. Nonetheless, overall demand for industrial silver continues to grow due to the rapid expansion of the renewable energy sector.
Silver Sustains its Hybrid Valuation
Just as gold bullion has found a renewed set of enormous buyers in central banks and sovereigns, silver has a new set of substantial buyers from the photovoltaic market. Central banks’ and sovereigns’ gold buying is somewhat opaque and uneven; however, their size can potentially surpass all combined gold investment flows.
While silver demand from photovoltaics is not the most significant subset of silver demand, it is by far the fastest growing (approximately 25% per annum, using data from Figure 6).
Solar’s hyper-growth rate is due to its long list of positive characteristics: superior economics (lowest tier cost, scalable, long-life, low-maintenance), zero carbon emissions, high (and still rising) efficiency, policy support and government funding, national security energy concerns, and reshoring of an essential high-growth industry back to the U.S. with its accompanying boost in domestic employment. Silver represents the best metal exposure and leverage for this near-inelastic growth.
Silver’s valuation has long been hybrid, combining industrial demand and store-of-value aspects. It has been over a year since central banks and sovereigns reengaged with gold bullion. Still, silver’s trading relationship with gold appears unchanged when considering price ratios, price correlations, beta-to-gold and overall trading patterns. Based on these factors, silver is holding onto its attribute as a store of value while industrial demand for silver appears ready for the next leg of growth from one of the fastest-growing sectors in the world.
Gold Price Will Explode $600 Higher In 60 Days!
To listen to Michael Oliver’s remarkable predictions for the price of gold, silver, mining stocks and other major markets CLICK HERE OR ON THE IMAGE BELOW.

ALSO JUST RELEASED: SentimenTrader: Gold Price May Finally Be Unleashed Higher According To This Indicator CLICK HERE
ALSO JUST RELEASED: Gold May Continue To Surprise, Here Is Gold’s Roadmap CLICK HERE
ALSO JUST RELEASED: Another GLOBAL Long Term Rise In Interest Rates CLICK HERE
ALSO JUST RELEASED: BUCKLE UP: Debt, Currency Debasement And War Unleashed CLICK HERE
ALSO JUST RELEASED: Michael Oliver – Gold Price To Explode $600 Higher In 60 Days CLICK HERE
© 2023 by King World News®. All Rights Reserved. This material may not be published, broadcast, rewritten, or redistributed. However, linking directly to the articles is permitted and encouraged.


