

Sprott says central banks are maintaining a torrid pace when it comes to gold buying, propelling gold prices to a new all-time high before backing off.
Gold’s Bold Move to New Closing High
Gold Bullion Breaking Out to New All-Time Highs
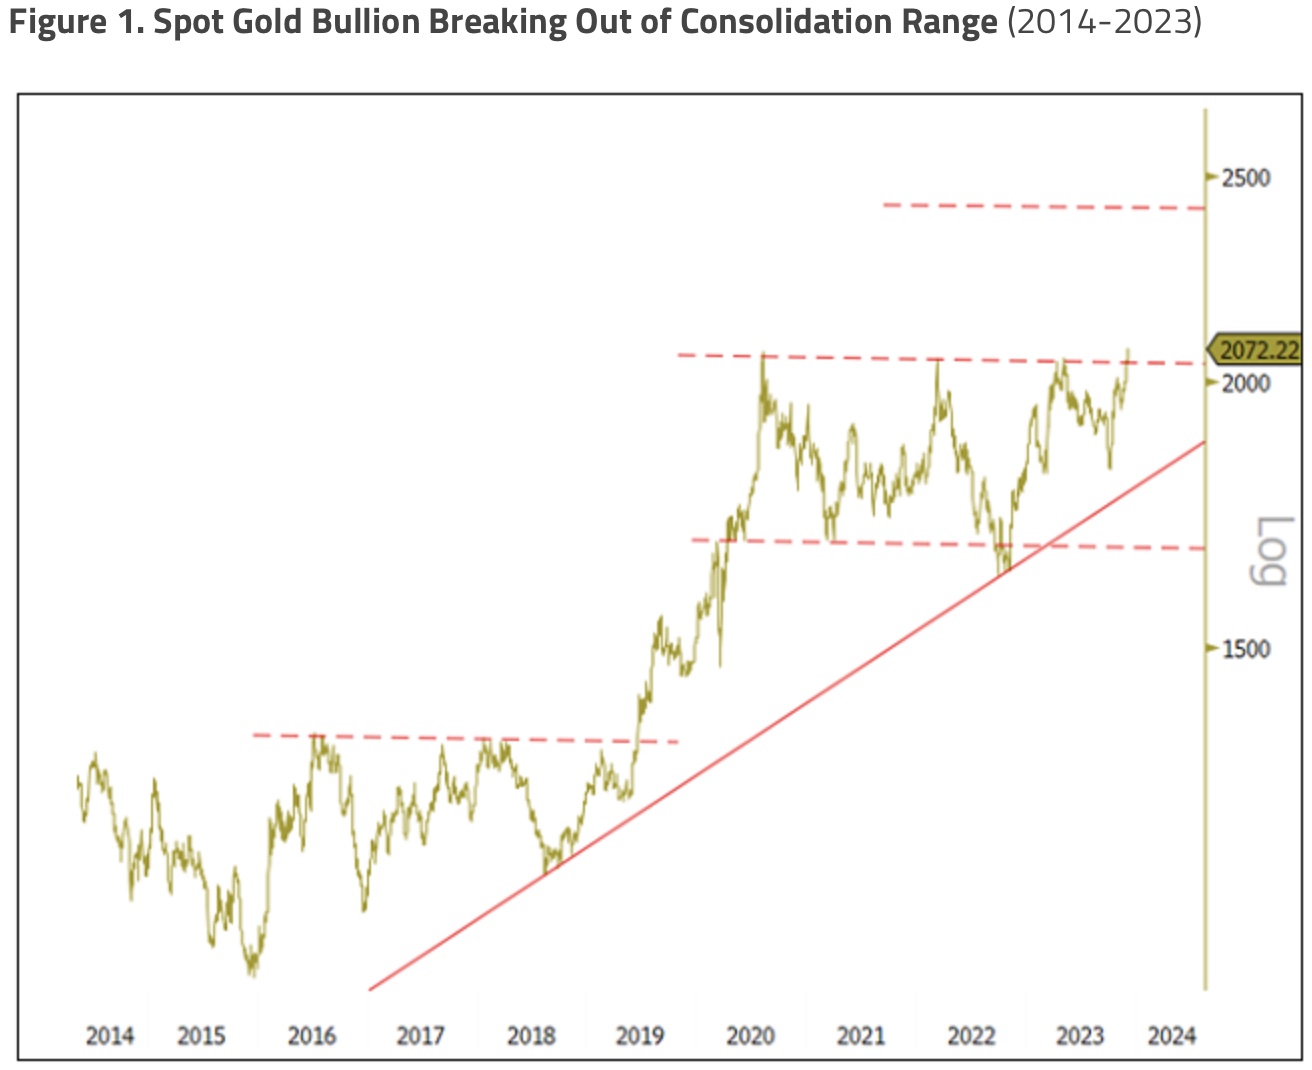
December 5 (King World News) – Paul Wong, Market Strategist at Sprott Asset Management: On Friday, December 1, 2023, spot gold bullion registered an all-time high closing price of $2,072.22, surpassing the prior closing high of $2,063.54 reached on August 6, 2023. Gold has closed above the three closing highs over the past five years (closing highs: August 6, 2020, at $2,063.54; March 8, 2022, at $2,050.76; May 4, 2023, at $2,050.28) to mark a clear break out from its plus three-year long consolidation range.
As seen in Figure 1, the gold chart has been shaping a bullish consolidation since 2020. The consolidation breakout pattern has a technical target of ~$2,400. However, Figure 1 has several recurring bullish fractals (ascending triangles, cup and handles, flags) with higher technical price projections. Typically, very bullish chart patterns will have recurring fractals echoing through time. There are even larger bullish patterns on the multi-decade-long charts. From a technical chart perspective, we are less concerned about the near-term target price(s) and would like to point out the technical strength of the chart.
Macro Backdrop Supporting Gold
November was marked by the continuation of violent macro reversals as the broad market retraced all the previous three months’ decline; the U.S. dollar (USD) and yields fell, sparking a risk-on rally and short covering on downside hedges. The Federal Reserve (Fed) and the U.S. Treasury Department sent the market bullish signals on the end of Fed rate hikes, lower QRA (Quarterly Refunding Announcement for Treasury refunding) and a higher issuance skewed to the front end. The result was yields falling (especially the term premium) and a sharp fall in the USD. Combined with the geopolitical containment of the Israel-Hamas war, risk assets soared in the month, including gold.
U.S. Treasury Liquidity Needs to Improve and a Lower U.S. Dollar is Critical
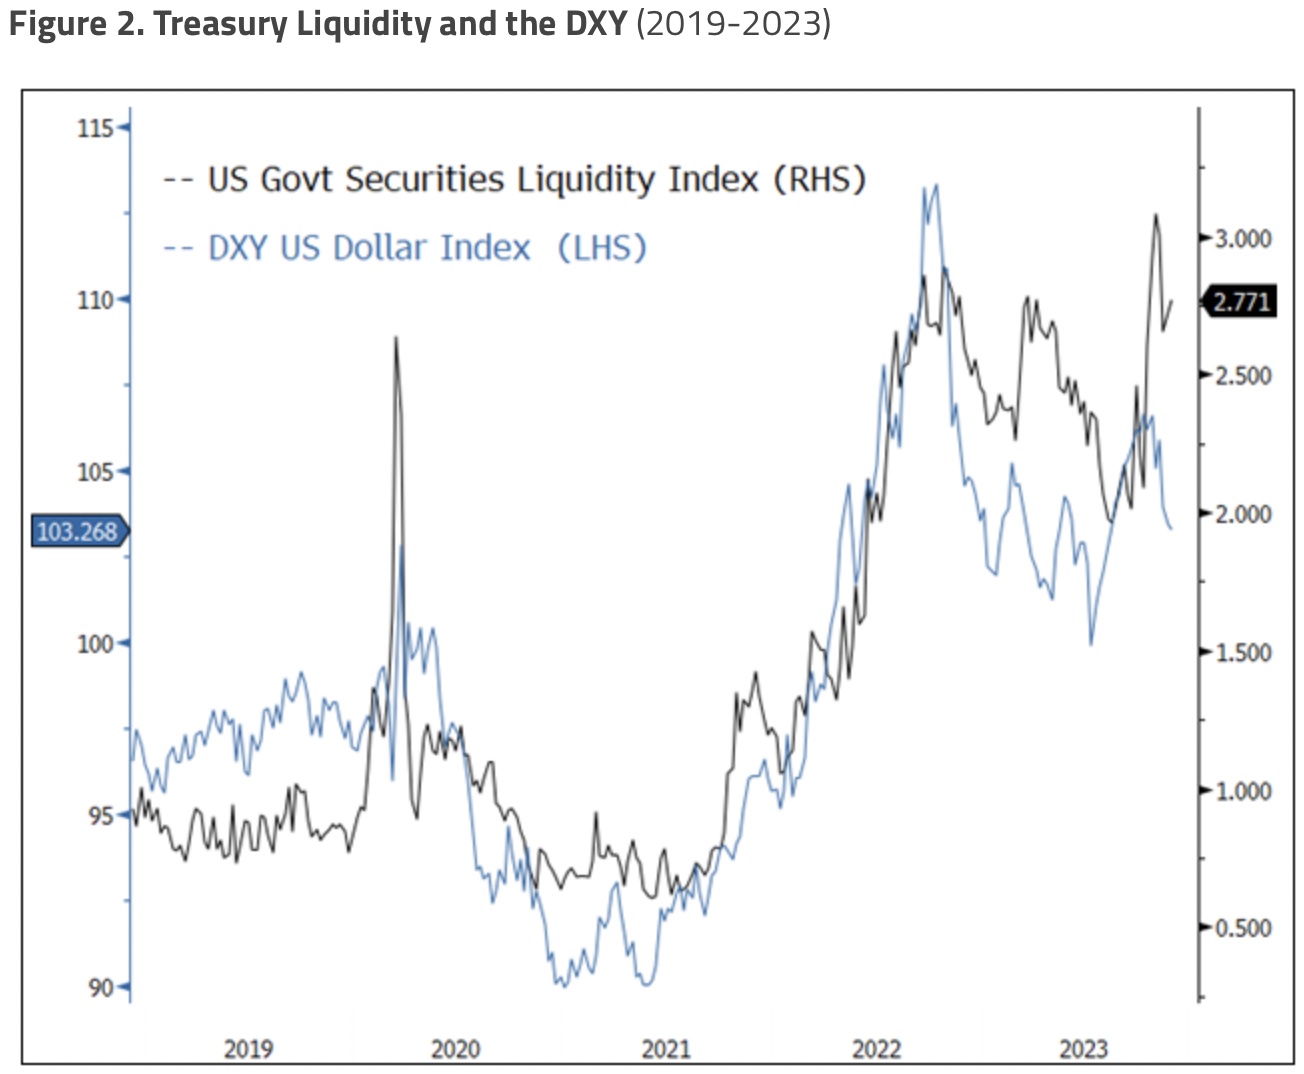
In early November, the Bloomberg US Government Securities Liquidity Index (Treasury Liquidity Index) surpassed the March 2020 COVID highs, a warning that policymakers would need to alleviate the liquidity pressure. On cue, the Fed began its dovish talk, and the Treasury Department announced a smaller-than-expected quarterly refunding and shifted its bond issuances to the front end, reducing the term premium.
Combined, all these factors have helped lower long-end yields, and the USD mainly fell sharply, boosting gold and most risk assets. Figure 2 below highlights the relationship between the DXY (U.S. Dollar Index) and U.S. Treasuries. DXY has tracked the Treasury Liquidity Index closely since 2020 (R-squared of 0.75). Since the peak several weeks ago, most asset classes have been in an everything rally (except for oil, as the Israel-Hamas war premium dissolved). Despite the recent improvement in the Treasury Liquidity Index, it still sits above the 2020 spike level indicative of ongoing liquidity impairment. Given the sheer amount of government issuance planned (click here for Congressional Budget Office projections), it would seem more work is still needed to improve Treasury liquidity, which should help lower the USD, all else being equal.
Inverse Correlation of Gold with DXY
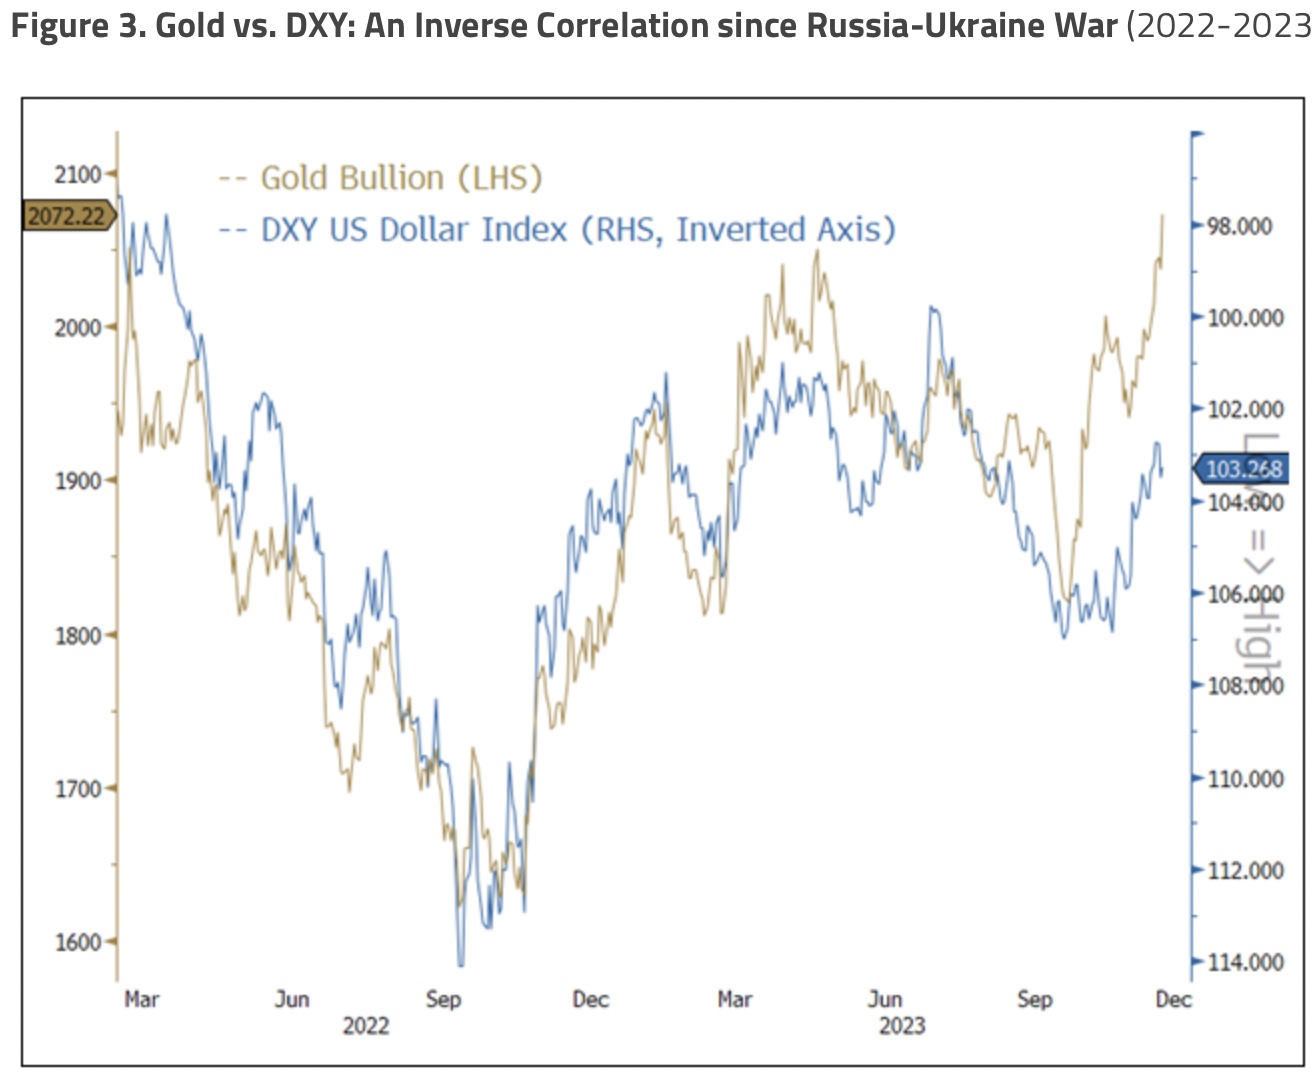
We have highlighted in prior reports the complete breakdown in correlation with gold bullion and 10-year Treasury Inflation-Protected (TIPs) yields (real yields) as gold decoupled from its long-standing inverse correlation to financial assets starting mid-2022. While there has been an inverse correlation between gold and the USD forever, the chart below highlights the intense inverse correlation of gold with DXY since the Russia-Ukraine War. The seizure/freezing of Russia’s FX reserves (up to $650 billion, depending on how it is counted) catalyzed a buying wave among central banks for gold and for some central banks (not so friendly with the West), a strong desire to diversify away from the USD and USD-based assets.
Once you remove U.S.-related/linked/allied assets, gold stands out as the most liquid by far, and more importantly, it is the largest “outside-money” asset (i.e., gold exists outside of the central bank system and is, therefore, no one’s liability) available to central banks.
Central Banks Maintain Torrid Buying of Gold
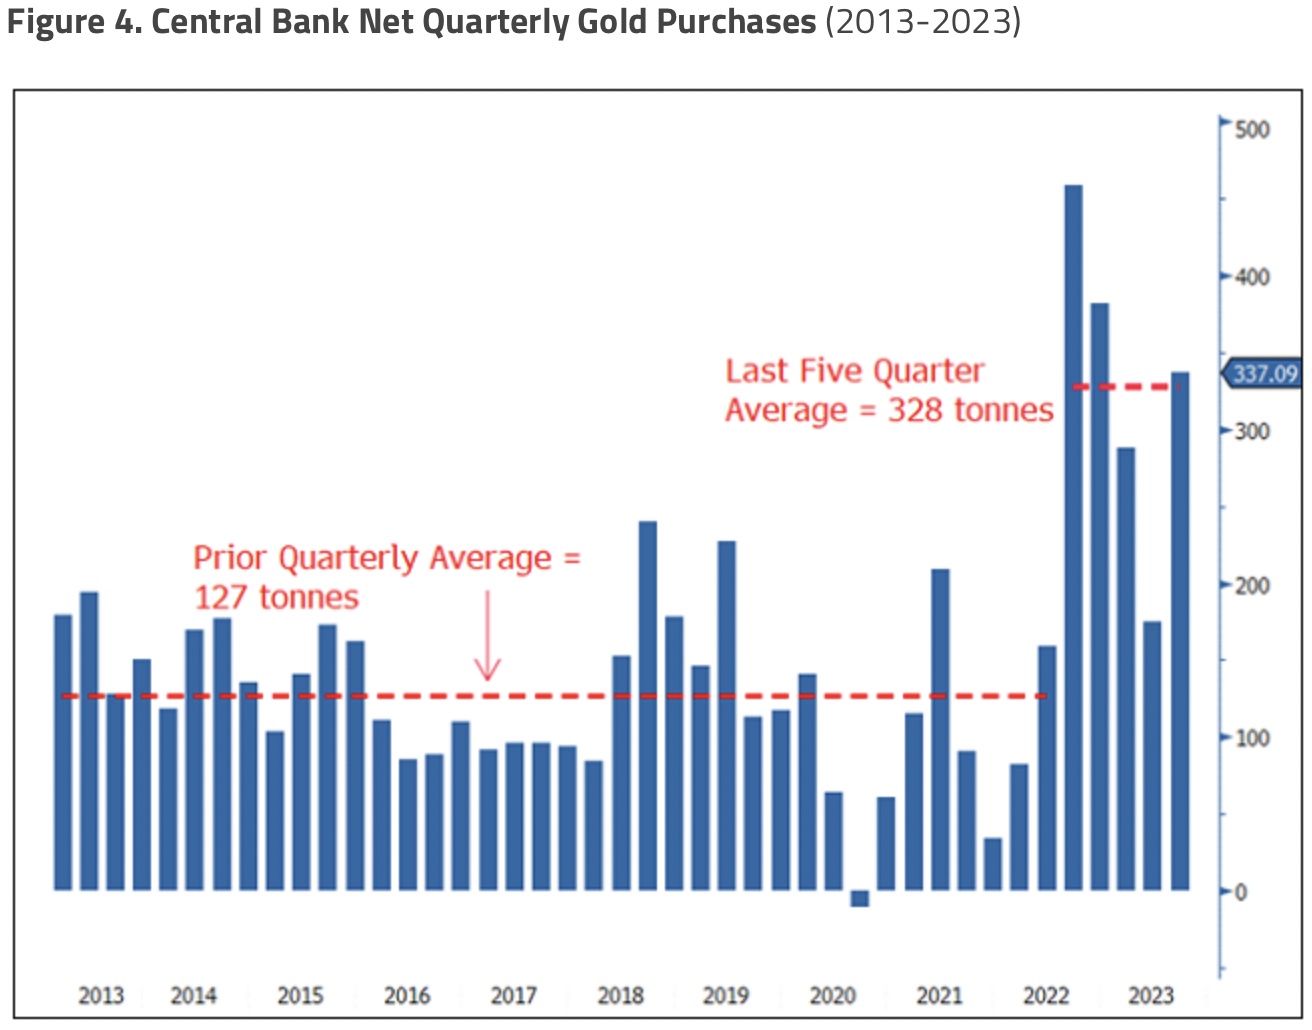
In Q3 2023, central banks resumed their torrid gold purchasing pace, buying 337 tonnes of gold to bring the average of the last five quarters to 328 tonnes per quarter. Since the Russia-Ukraine war, central banks have been buying at 2.58 times the prior quarterly average of the preceding decade. It is also becoming more apparent that the central banks (and sovereigns) are acting much like the Fed with its “Fed put” on the post-Global Financial Crisis bond and equity markets. In other words, central banks and sovereign buying have put a floor under gold prices. Unlike financially driven gold investors and traders, central banks are not overly influenced by capital market pricing considerations but are driven by their long-term strategic reserve management goals.
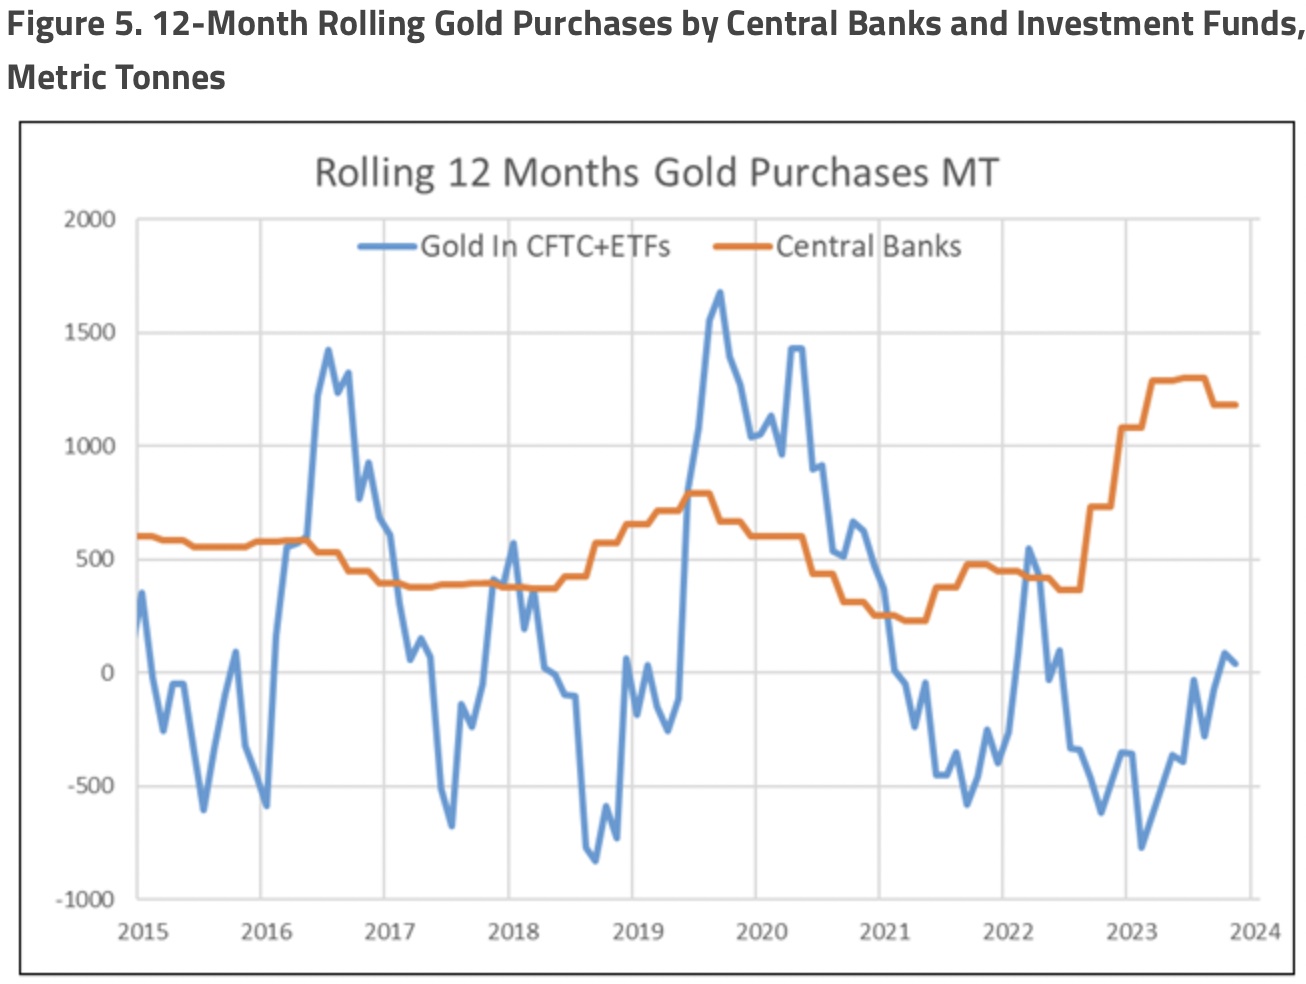
To visualize the wide buying divergence between the two primary buying cohorts, we created in Figure 5 a rolling 12-month buying for central banks and investment funds (comprised of net non-commercial CFTC gold positions plus gold held in ETFs), measured in metric tonnes. On a rolling 12-month basis, central banks have been buying gold at a 1,225 tonne rate, while CFTC and ETF combined have averaged a selling rate of -288 tonnes, the most expansive delta since available data. We also note that historically, the buying patterns of central banks and investments are very different, as evident by the data in Figure 5.
With gold breaking to new highs, will CFTC and ETF buying resume, and if so, at what rate?
In summary, there has been an emerging cross relationship between gold and U.S. Treasury liquidity, the level of the U.S. dollar, central bank and sovereign buying. Concurrently, there has been a decreasing effect from traditional financial markets and investment funds, as highlighted by the breakdown in relationship with TIPs yields, CFTC and ETF positioning, and sustainable safe-haven flows.
ALSO JUST RELEASED: Michael Oliver – Emotional 24 Hours Of Gold Trading Ushers In $100 Trading Range CLICK HERE
ALSO JUST RELEASED: GOLD SOARS HIGHER IN OVERSEAS TRADING: $3,200 Could Be A Target CLICK HERE
ALSO JUST RELEASED: GOLD HITS ALL-TIME HIGH: Hope Dies, Gold Rises! CLICK HERE
ALSO JUST RELEASED: Price Of Spot Gold Hits All-Time High As Silver Surges Along With Miners CLICK HERE
To listen to Alasdair Macleod discuss the price of gold hitting all-time highs along with silver and the mining stocks CLICK HERE OR ON THE IMAGE BELOW.

© 2023 by King World News®. All Rights Reserved. This material may not be published, broadcast, rewritten, or redistributed. However, linking directly to the articles is permitted and encouraged.


