

Gold down $50, silver $1.50, but take a look at this shocker…
Gold
June 7 (King World News) – Peter Boockvar: Gold is taking a hit by almost 2% as it was reported that China did not add to its gold holdings in May after 18 straight months of doing so. Price was likely the factor with gold hitting record highs. We know its really been mostly central bank buying that has powered gold higher and they will continue to do so, even China. China now has the benefit of conducting some trade in its own currency. They are buying oil from the Russians and Saudi’s in RMB. They are buying soybeans and corn from Brazil in RMB. Those countries in turn use RMB to buy goods from China. There is no dollars used and thus no need to recycle dollars in US Treasuries. Any excess instead has been used to buy gold.
What is continuing to be missed are western buyers in gold ETF’s. Below is a chart of the price of gold in white and the amount of gold being held in ETFs in orange. I’m expecting at some point the orange line will move higher which will be the fuel for the next leg up in gold. We’re still long and bullish.

Chinese Demand Is Driving Gold & Silver
Alasdair Macleod: Despite continuing efforts by the paper establishment in western capital markets to shake out weak gold and silver holders, they are being swamped by Chinese demand.

This week has seen underlying firmness in gold and silver markets, with gold trading at $2351 in European trade this morning, up $25, and silver at $30.82, up 45 cents. Silver was especially volatile, falling sharply mid-week before rallying over 4% yesterday. Being Friday and China off for the weekend, the shorts are taking the opportunity to unwind some of yesterday’s rise.
Having had such strong rises since mid-February, technical analysts have been calling for more consolidation before a resumption of this bull phase. The position for gold is shown next:

So far, gold has reacted to find support at the 55-day moving average, but the longer-term 12-month average is still below $2100, suggesting that a deeper correction is possible. The technical chart for silver is next.
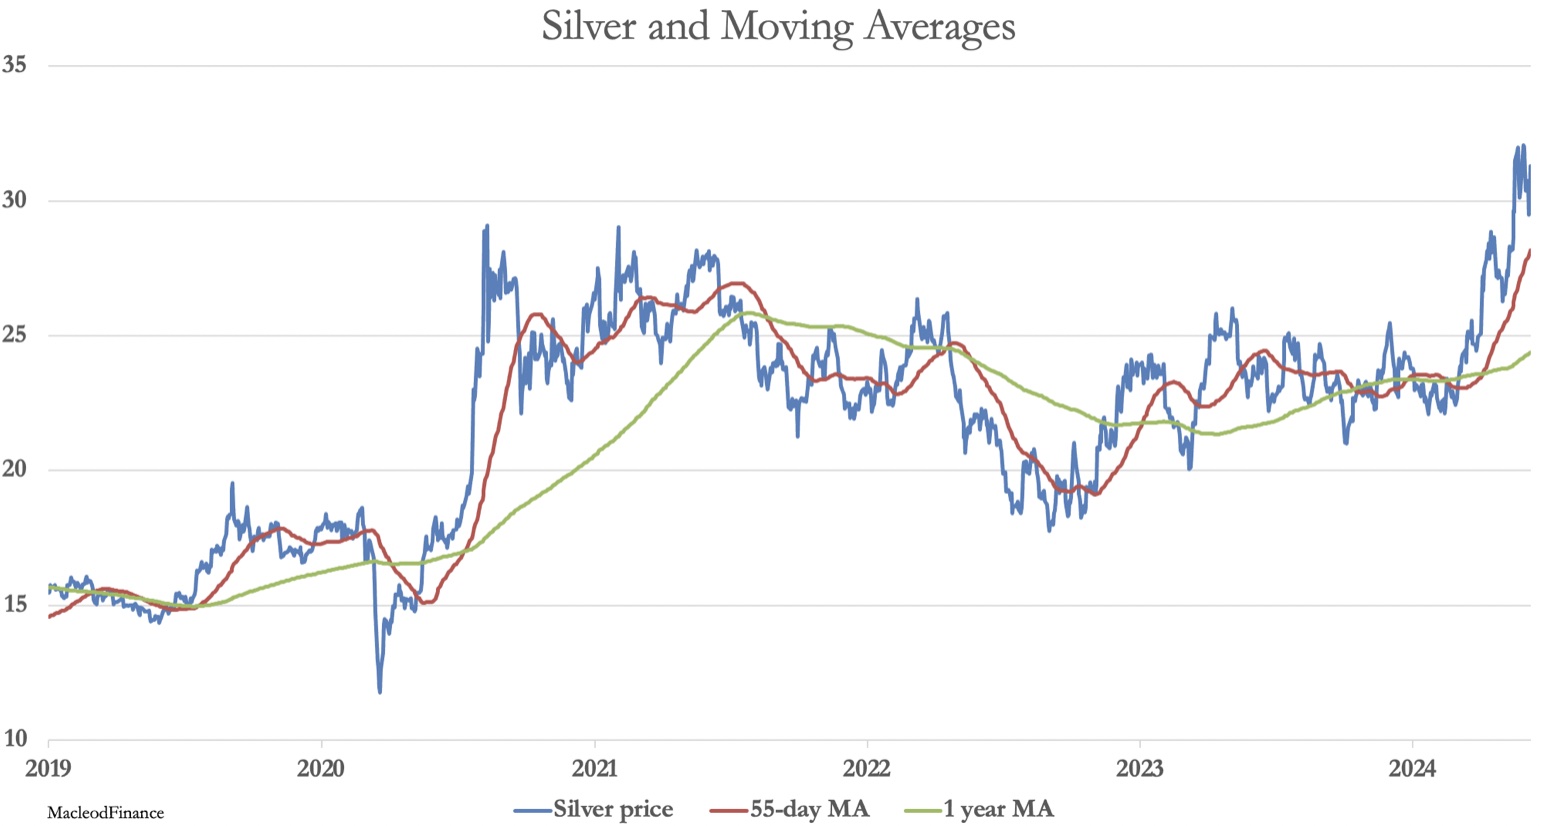
Technicians would argue that the silver price is still too far above its moving averages for comfort. It would be wrong to dismiss these concerns out of hand, but there are more important forces at play.
The next chart shows that gold is closer to being oversold than most analysts think:
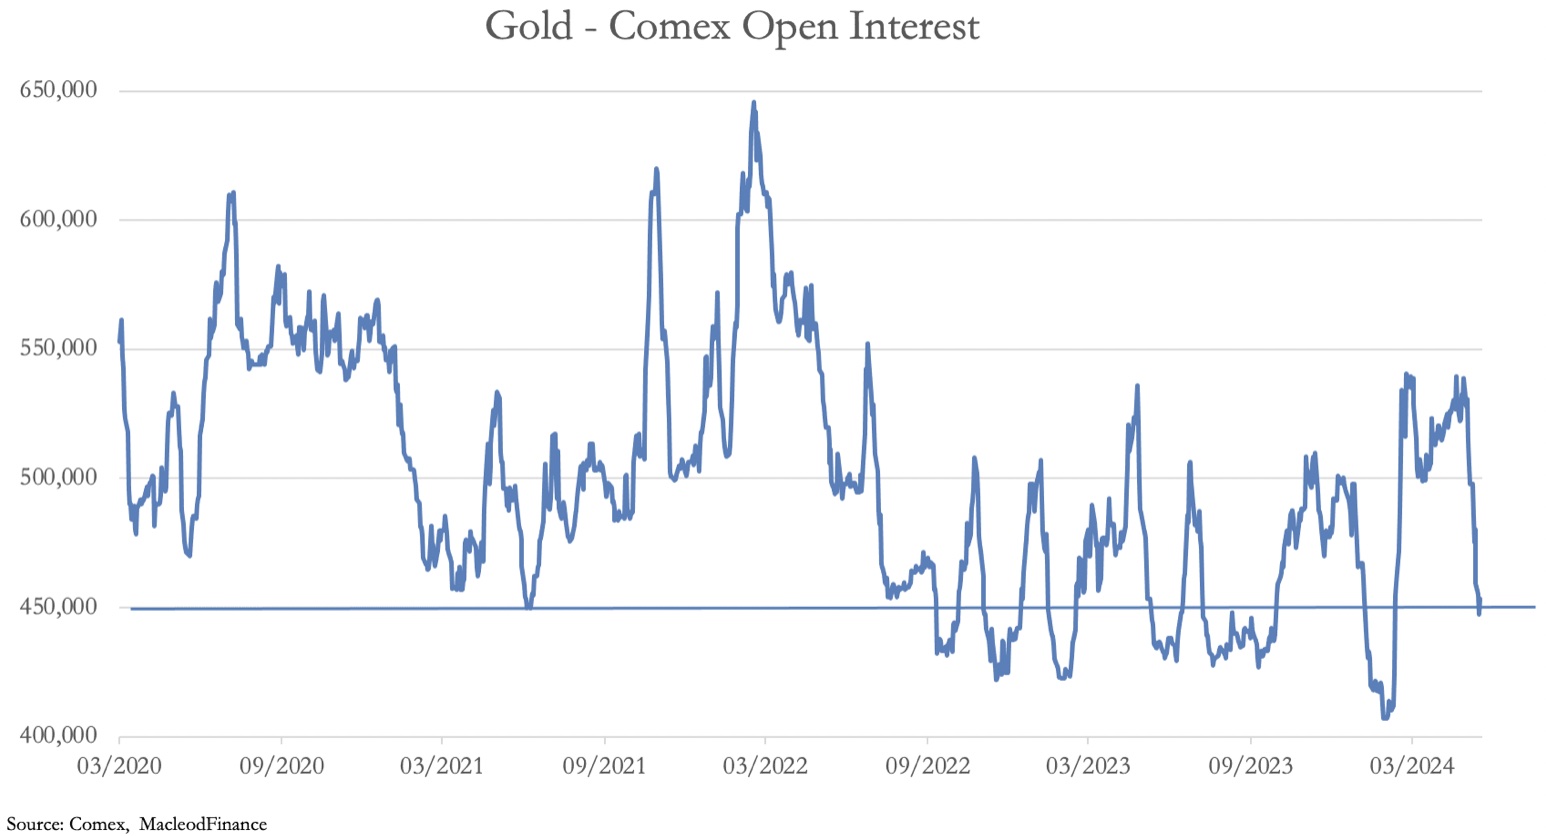
Why have I taken Comex’s open interest as the indicator? Because it encapsulates the combined positions of all categories on Comex. The solid line at 450,000 contracts clearly indicates an oversold market, strongly suggesting that we are near to a price bottom.
But the clincher is the rate at which physical metal is draining from western vaults. According to Doug Casey’s Substack latest post, huge premiums in Shanghai are draining western vaults, with LBMA’s vaulted silver stocks falling 60% this year so far, and Comex’s falling by 46%. Gold’s drain has been less dramatic perhaps, but recent days have seen record stand-for-deliveries. In the last eight trading sessions, nearly 90 tonnes of gold have been stood for delivery taking the total so far to 253 tonnes, a rate which easily exceeds this year’s US gold mine annual output estimated by Metal Focus at 166 tonnes…
This silver explorer recently did a huge transaction with a $4.5 billion market cap producer CLICK HERE OR ON THE IMAGE BELOW TO LEARN MORE.

In previous postings, I have pointed out that it is massive Chinese household savings with unattractive alternatives driving demand, and this was evidenced yesterday (Thursday). Changing the pattern of recent trading sessions, gold and silver prices opened higher indicating overnight demand had returned. It was less in evidence this morning, but then on a Friday Chinese futures speculators (yes, there are some!) were probably closing positions before the weekend.
In other news, the ECB lowered its benchmark deposit rate by ¼% from 4%, the first of the majors to do so. Markets are buzzing with hope that the Fed and others will follow suite. But with budget deficits continuing to run high, inflation is far from over, and in the next few months we will see how funding them progresses, bearing in mind that immediate liquidity is drying up reflected in the US’s Reverse Repo position:

Most of this has gone into T-bills, funding the deficit and being spent on non-production. Liquidity is clearly running dry and higher borrowing costs beckon…to continue listening to Alasdair Macleod discuss Friday’s orchestrated gold and silver takedown as well as what the Chinese are up to and more CLICK HERE OR ON THE IMAGE BELOW.

© 2024 by King World News®. All Rights Reserved. This material may not be published, broadcast, rewritten, or redistributed. However, linking directly to the articles is permitted and encouraged.


