As the world lurches closer to financial panic, nothing can prepare you for what is coming.

“There is no training, classroom or otherwise, that can prepare for trading the last third of a move, whether it’s the end of a bull market or the end of a bear market.” — Multi-Billionaire Hedge Fund Manager, Paul Tudor Jones
The reason KWN featured that quote is because it applies to what lies ahead in the gold market.
About that gold market…
Today King World News is featuring a piece by a man whose recently released masterpiece has been praised around the world, and also recognized as some of the most unique work in the gold market. Below is the latest exclusive KWN piece by Ronald-Peter Stoeferle of Incrementum AG out of Liechtenstein.
By Ronald-Peter Stoeferle, Incrementum AG Liechtenstein
July 6 (King World News)
Gold Is Back!
Gold is back! With the strongest quarterly performance in 30 years, the precious metal in Q1 2016 emerged from the bear market that had been in force since 2013. A decisive factor in this comeback is growing uncertainty over the recovery of the post-Lehman economy. After years of administering high doses of monetary painkillers, will the Fed succeed in discontinuing the practice? Or is the entire therapy about to be fundamentally challenged?
The following chart illustrates that there has been a divergence between money supply growth and the gold price trend since 2011. It shows the combined balance sheet totals of the Fed, ECB, SNB, PBoC and the Bank of Japan. When the supply of fiat currencies grows faster than the stock of bullion, the gold price should rise and vice versa. The chart indicates that either the gold price has corrected too much, or central bank balance sheets are set to stagnate or decline in the future. Anyone who studies economic history knows that barely any precedents for a sustained reduction of central bank balance sheets exist so far. This is therefore a strong indication that the gold price still has quite a bit of room to catch up (see chart below).
Combined balance sheet totals Fed+ECB+SNB+PBoC+BoJ in USD billion

The Tide Is Turning!
If one compares the performance of the gold price to that of the stock market, one can see that the relative weakness in gold which has persisted since the autumn of 2011 appears to be ending. We already pointed out last year that the momentum of this trend was weakening noticeably. Now it appears as though the downtrend has ended and a turnaround has begun. After the past several years of gold underperforming against stocks, the tide may be turning in favor of gold with respect to the coming years (see chart below).

Global Financial Stress Approaching Panic Levels
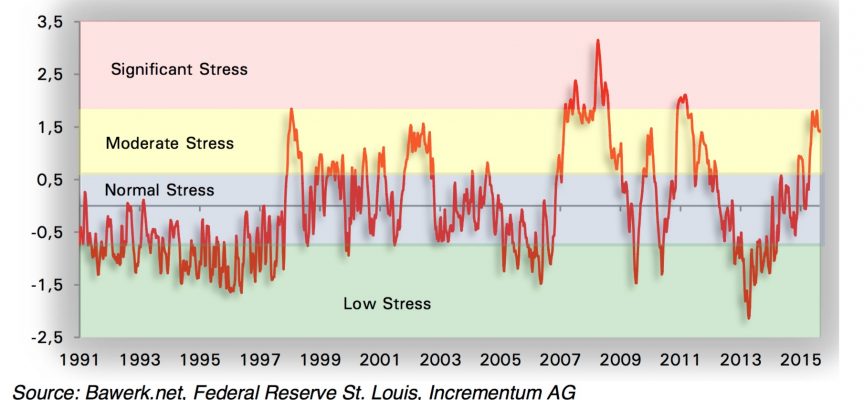
The degree of uncertainty among financial market participants also represents an important factor affecting the gold price. The Cleveland Financial Stress Index (CFSI) also points to rising financial market risks. The risk index which is calculated by the Federal Reserve in Cleveland measures the “state of health” of the US financial system and is supposed to predict systemic risks. Altogether 11 sub-indicators from the areas of credit, equities, currencies and interbank markets are combined into a single indicator, which in turn is divided into four levels. The levels indicate low, normal, moderate and significant periods of stress. Since early 2014 the index has re-entered an upward trend and has recently reached the highest level since 2011 (see chart below).
Federal Reserve Financial Stress Index Nearing “Significant Stress”

According to our statistical analysis, a sustainable rally in the gold price is improbable if the gold/silver ratio rises concurrently. A declining gold/silver ratio significantly increases the probability that gold has entered a bull market. We are paying particular attention to the ratio’s current position, as a change in trend has possibly occurred in recent weeks. A renewed downtrend in the ratio would signal a positive outlook for gold, and an increase in the momentum of price inflation as well (see chart below).

A comparison with past bull markets is interesting as well. In our previous studies we have compared the recent correction with the mid-cycle correction between 1974 and 1976. The similarities between the two periods are in particular pronounced disinflation, rising real interest rates and extremely high pessimism with respect to the future trend of the gold price. If one compares the price trends of the two time periods, it can be seen that the bear market since 2011 had roughly the same structure and depth as the 1974-1976 mid-cycle correction (they differ in terms of duration though).
Comparison of gold bull markets of the 1970s (black line) and 2000s (golden line)

Conclusion:
Numerous technical and sentiment indicators are suggesting that the gold price has gone through a traditional cycle which culminated in a selling panic and a peak in pessimism last year. It appears as though a new bull market cycle has now begun. King World News will feature more pieces from Stoferle in the coming weeks, but for now it is extremely important that KWN readers around the world understand that we are in the very early stages of the bull markets in gold and silver and you must not lose your positions.
***The extraordinary KWN Stephen Leeb audio interview has now been released and you can listen to it by CLICKING HERE OR ON THE IMAGE BELOW.
***One of Bill Fleckenstein’s greatest audio interviews ever has now been released and you can listen to it by CLICKING HERE OR ON THE IMAGE BELOW.
***Also Just Released: Gerald Celente – A Devastating Crisis Is About To Be Unleashed On The World Click Here.
© 2016 by King World News®. All Rights Reserved. This material may not be published, broadcast, rewritten, or redistributed. However, linking directly to the articles is permitted and encouraged.


