

Despite the fact that gold futures are closing in on $2,800 and silver futures are trading over $35, Sprott says the bull market in gold and silver is just getting started.
But first…
This Stock Is Starting A Massive Upside Breakout!
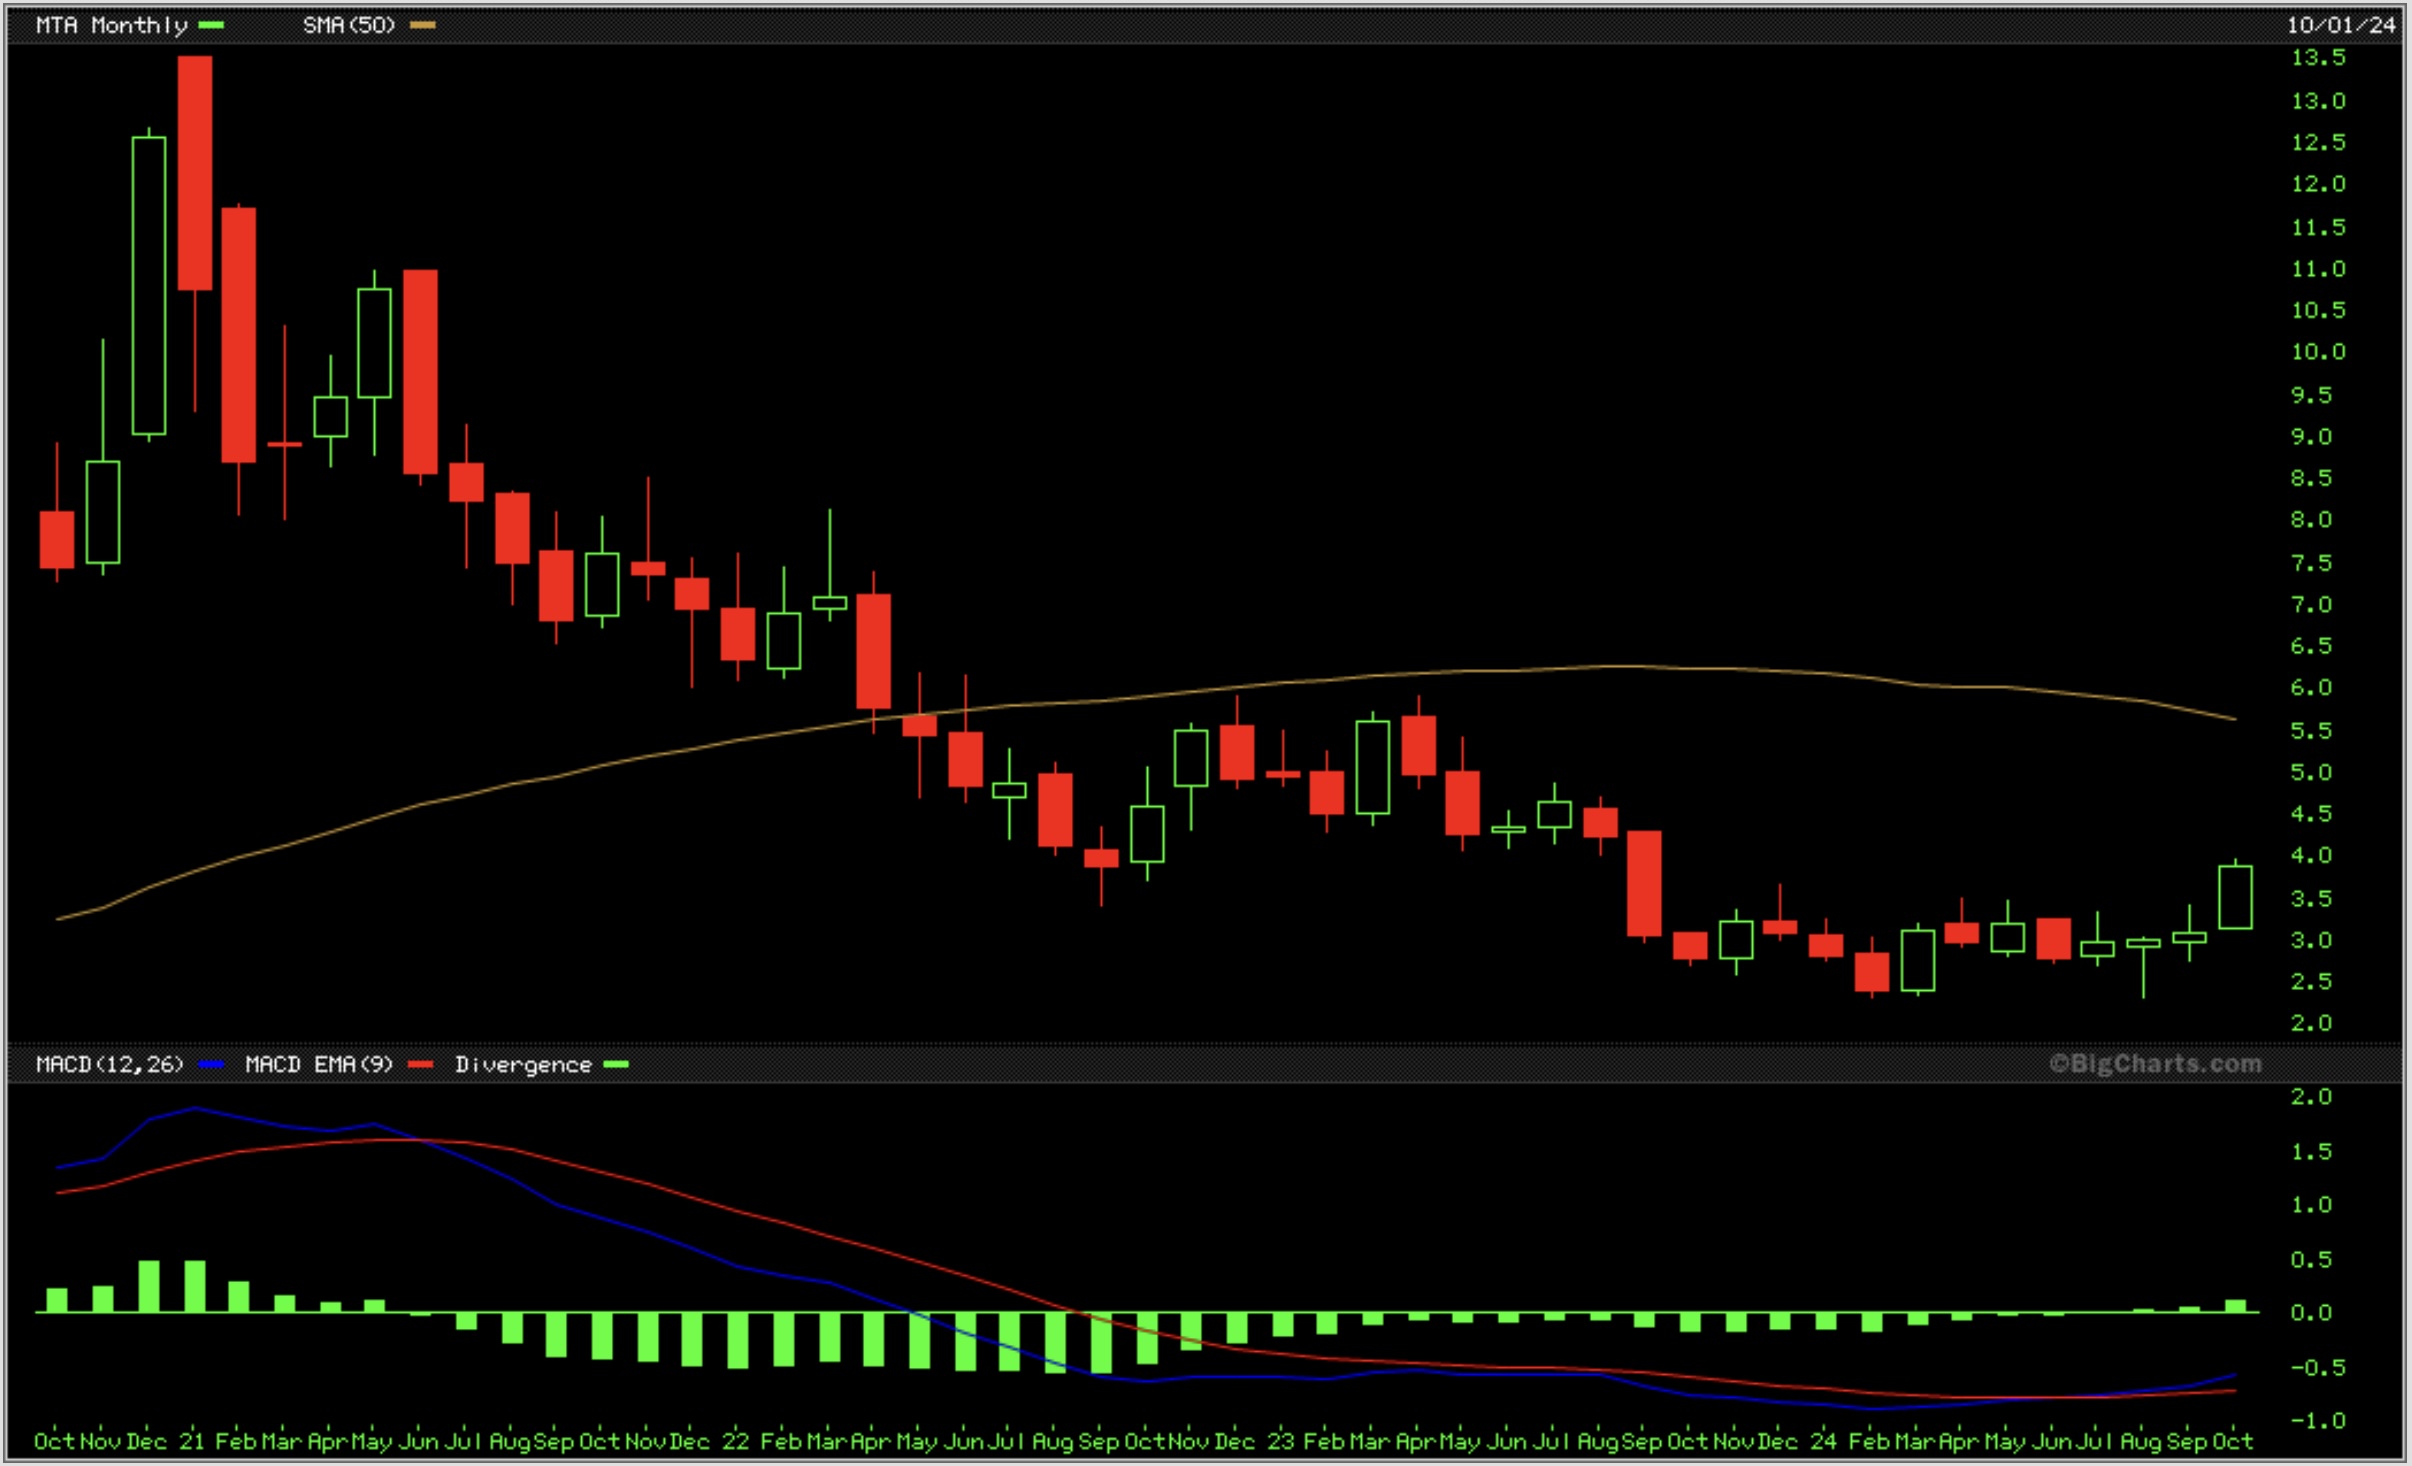
King World News is featuring the gold & copper stock below because the cash flow for this company is set to explode in 2025, 2026, 2027 and 2028! That also means there will be no stock offerings. This stock fell from $13.50 to under $3 during the bear market, but the entire time the company continued making acquisitions that dramatically increased the Net Asset Value, so the upside gains for this stock are sure to be jaw-dropping! I personally own $1,400,000 of this stock and expect this gold/copper royalty company to hit new all-time highs (above $13.50) as the gold bull market continues to surge. Here is a look at the chart, which just entered a long-term buy signal for the first time in nearly 6 years and yet the stock is still trading under $4!
First Time Monthly MACD Buy Signal In Almost 6 Years!
Royalty Stock Just Starting Major Upside Breakout After Falling From $13.50 To Under $3!
Take Action Immediately!
For more information regarding this stock email the CEO of this royalty company at brett@metallaroyalty.com or you can also call Kristina Pillon at investor relations at (604)908-1695. Email or call immediately since this upside breakout has just taken place!
Sprott Weighs In On Gold And Silver Bull..
Gold and Silver Enjoy Continued Rally
October 22 (King World News) – Paul Wong, Market Strategist at Sprott: Gold and silver enjoy continued rally.
Key Takeaways
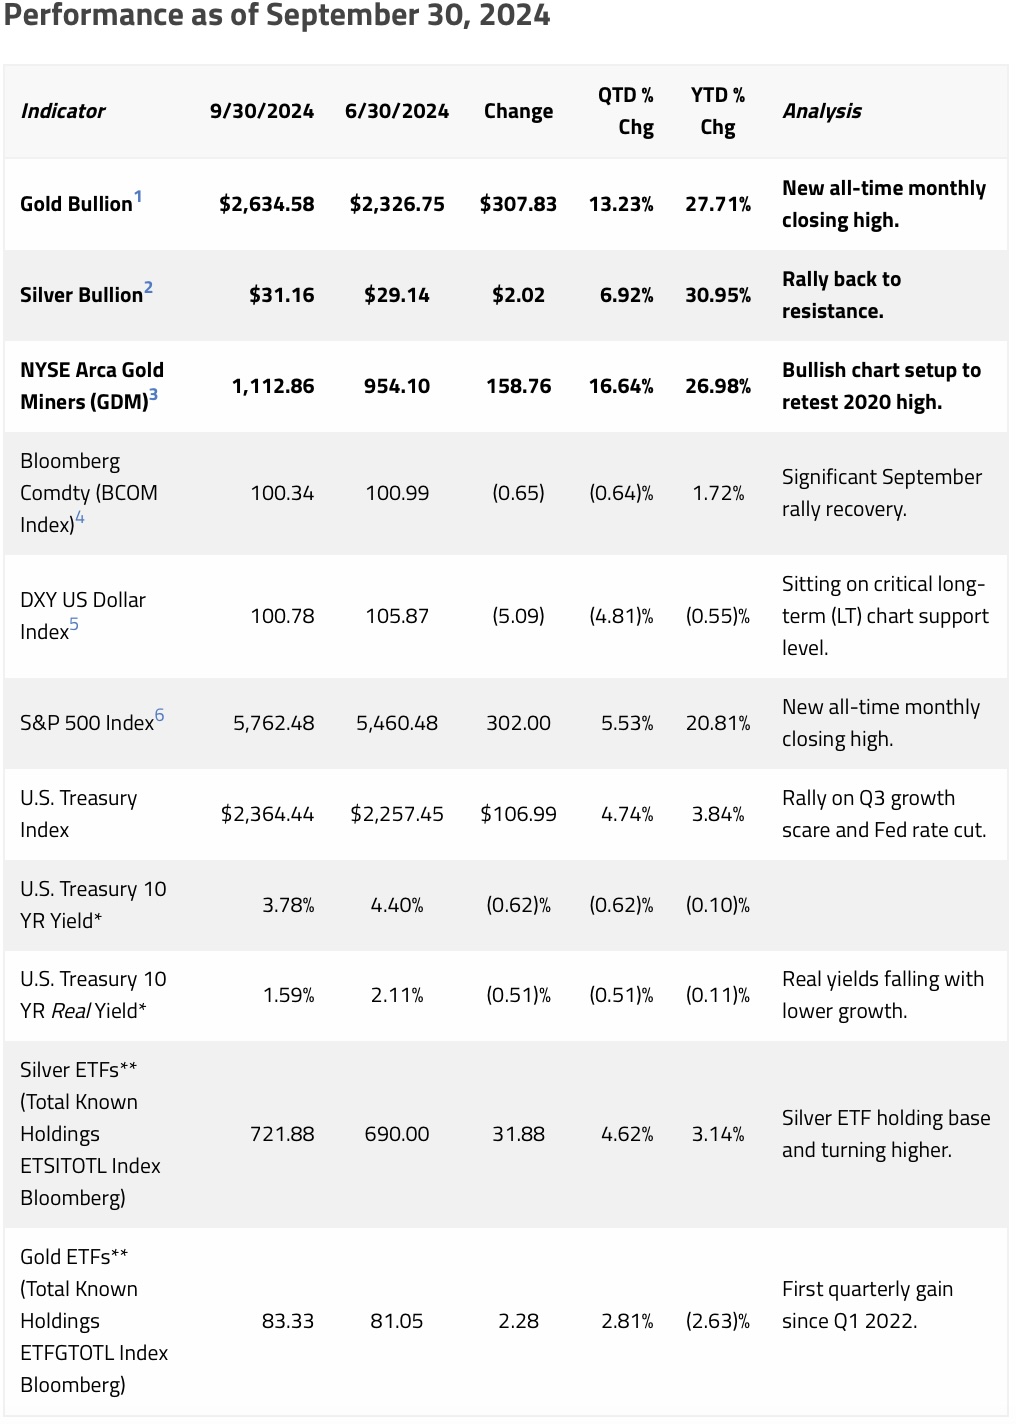
- Price Action Since the End of Q3: As of this publishing date and since September 30, both gold and silver have pushed above important thresholds to reach $2,700 per ounce and $34 per ounce, respectively.
- Gold and Silver Prices Soared in Q3: Both metals saw significant price increases in Q3 2024, with gold posting its largest quarterly percentage change since Q1 2016 and the largest U.S. dollar increase in history. Silver prices also rose, but with more volatility than gold. YTD through September 30, gold is up 27.71% and silver has gained 30.95%.
- Central Bank Buying Likely Behind Gold Surge: We believe central banks, particularly emerging markets, were the major driver behind the gold price increase.
- Gold Enters New Bull Market Regime: In our view, gold has entered a new bullish phase driven by factors like central bank buying, rising U.S. debt and a potential peak in the U.S. dollar.
- Macroeconomic Drivers and Geopolitical Risks Influence Prices: Inflation, falling interest rates, and geopolitical instability are all seen as factors influencing gold and silver prices.
- Silver’s Dual Role: Silver’s price is driven by both its value as a precious metal and its increasing demand in industrial applications like renewable energy.
Market Quarter Review
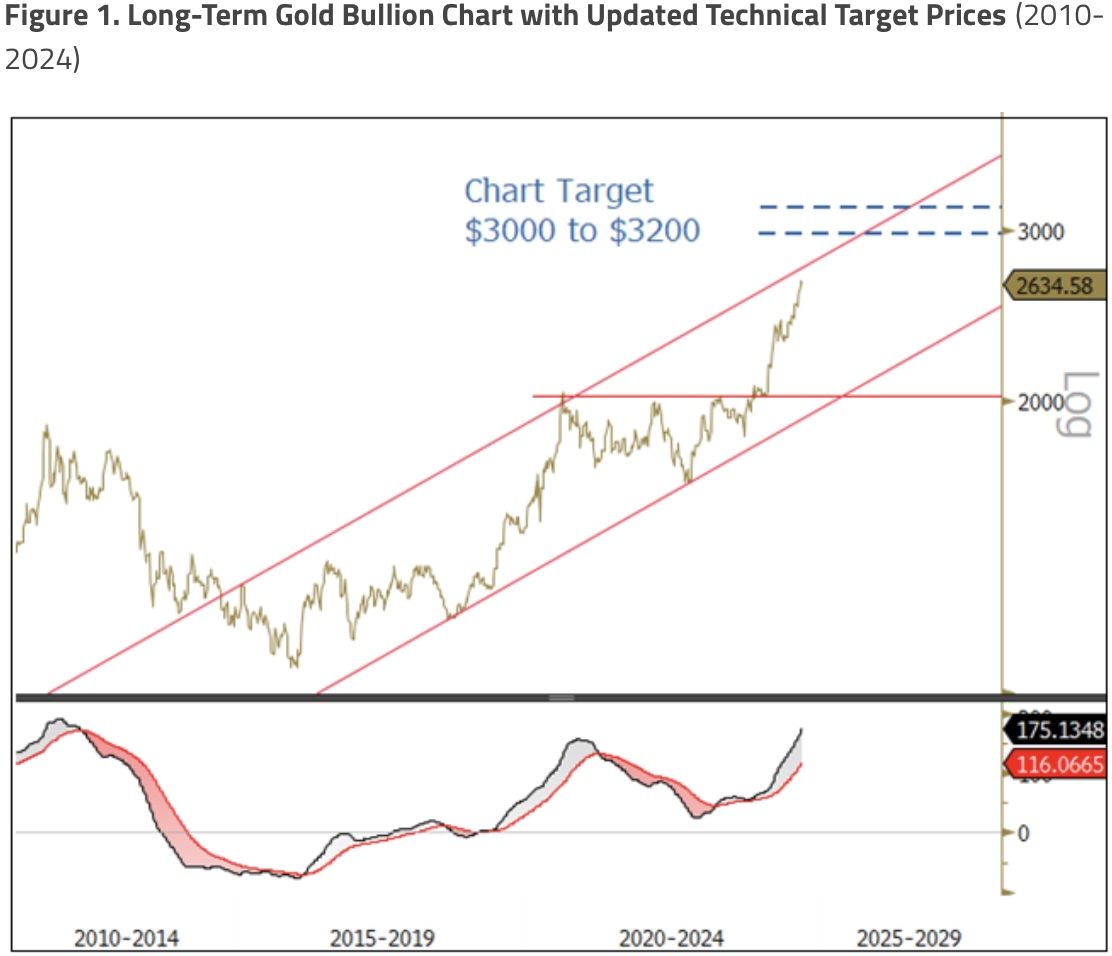
Spot gold bullion increased $307.83 (or 13.23%) to close at an all-time monthly high of $2,634.58 for the third quarter ending September 30. The third quarter’s 13.23% return is the highest since Q1 2016, which saw a 16.18% return and is in the top five quarterly returns since 1990. Year to date, gold has returned 27.71%, its best YTD start since 1986 (29.50%). The Q3 price rally had multiple positive drivers, producing a steady, low-volatility price rise, indicative of a persistent underlying bid for gold. The most significant price correction was only a short-lived 4.1% pullback, with time corrections as the main corrective feature. The longer-term gold chart continues to break higher past resistance targets with ease. In Figure 1, we update the next significant long-term technical chart target levels for gold ($3,000 to $3,200).
For the quarter, gold had many positive macro drivers working in its favor. The DXY (U.S. Dollar Index) fell 4.81%; the fall in the U.S. dollar (USD) was aided by the U.S. Federal Reserve (Fed) starting its interest rate-cutting cycle with an oversized 50 basis point (bps) rate cut for the September 9 Federal Open Market Committee (FOMC). The Fed’s SEP (Summary of Economic Projections) dot-plot showed a further 50 basis-point rate cut for the remainder of 2024 and a 100 basis-point rate cut expected for 2025. U.S. debt and deficits are expected to increase significantly under either a Trump or Harris administration. Geopolitical tensions continue to escalate and broaden out in the Middle East, with mounting military tension between Israel and Iran and its regional proxies.
Silver on the Move
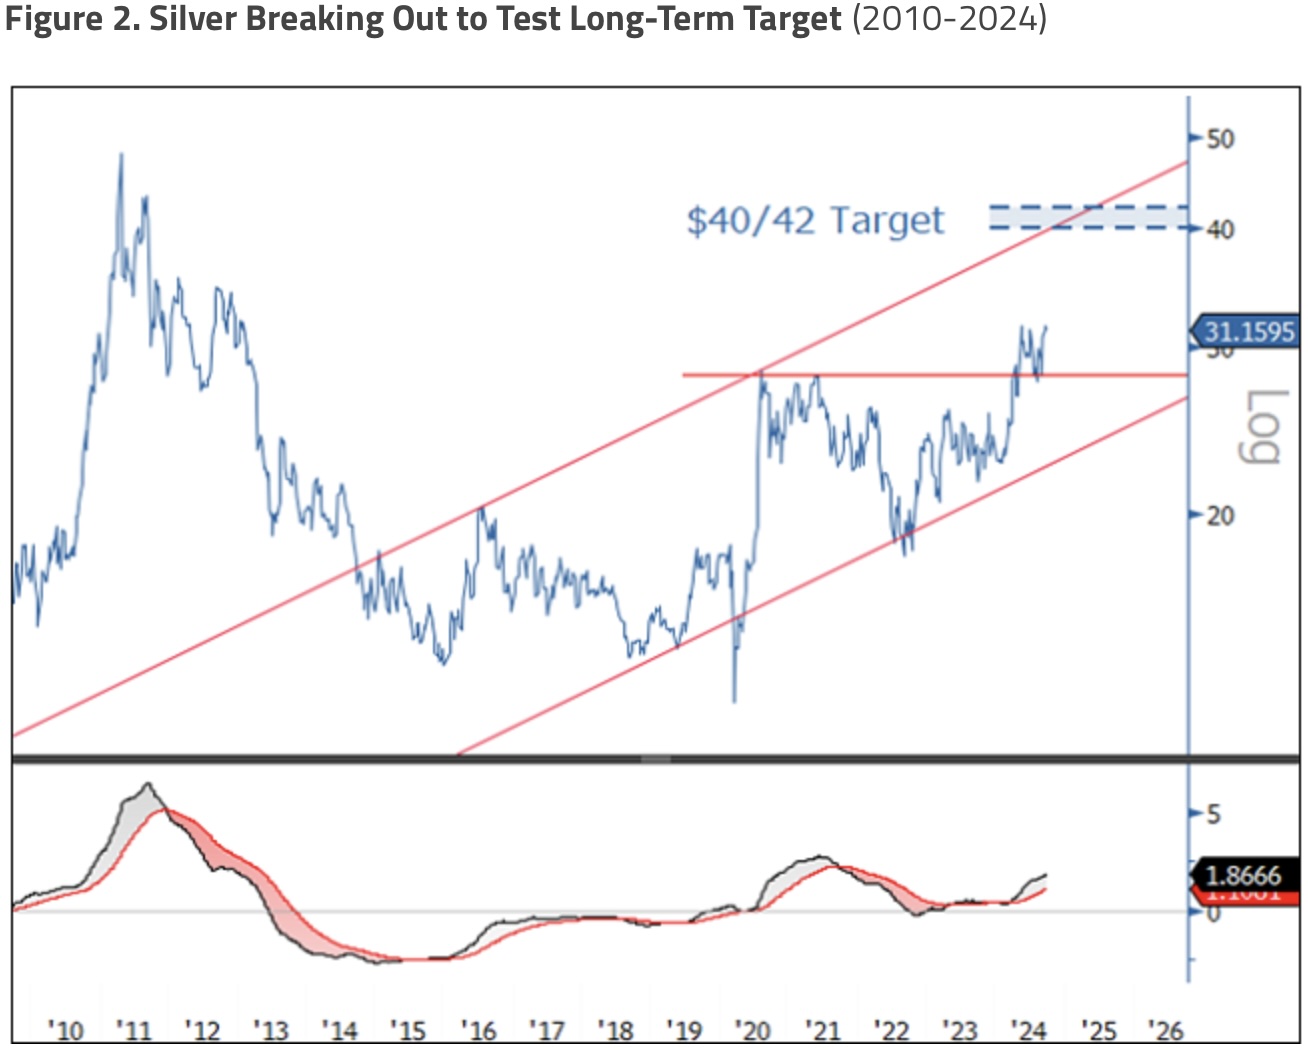
Spot silver rose $2.02 (or 6.92%) to close at $31.16 for the third quarter ending September 30. Year to date, silver has returned 30.95%, its best YTD start since 2016 (38.46%). The Q3 price rally was choppy and volatile, unlike the gold price action. The third quarter began with selling, tracking the fall in copper prices, indicative of silver being caught in the same general degrossing and deleveraging event that entangled most industrial metals-related assets. After the quick pullback to support, silver then rallied to a closing high of $32.02, only 8 cents away from its 11-year highs. We expect silver to make new cycle highs and ultimately climb to our $40/42 technical price target (see Figure 2). Since the September lows, there has been cyclical outperformance in the broader market, as recent strong economic data implies that the recession scare in the summer was short-lived.
As silver and copper fundamentals become increasingly driven by the demand for electrification and the energy transition, we are seeing increased correlation patterns between silver and copper. As the nascent cyclical recovery takes hold, we would expect silver to have an extra tailwind from a broadening out of cyclical outperformance. Driving this cyclical tailwind are several factors: 1) positive and accelerating year-over-year change in global M2 (a measure of global money supply); 2) positive global credit impulse; 3) a synchronized global rate-cutting cycle; and 4) recent announcement from China of a large monetary stimulus package amounting to approximately 3% of GDP (gross domestic product) and signals of future fiscal stimulus measures. We would expect this tailwind to push copper and silver prices higher.
Record Price Movements Imply Record Gold Buying
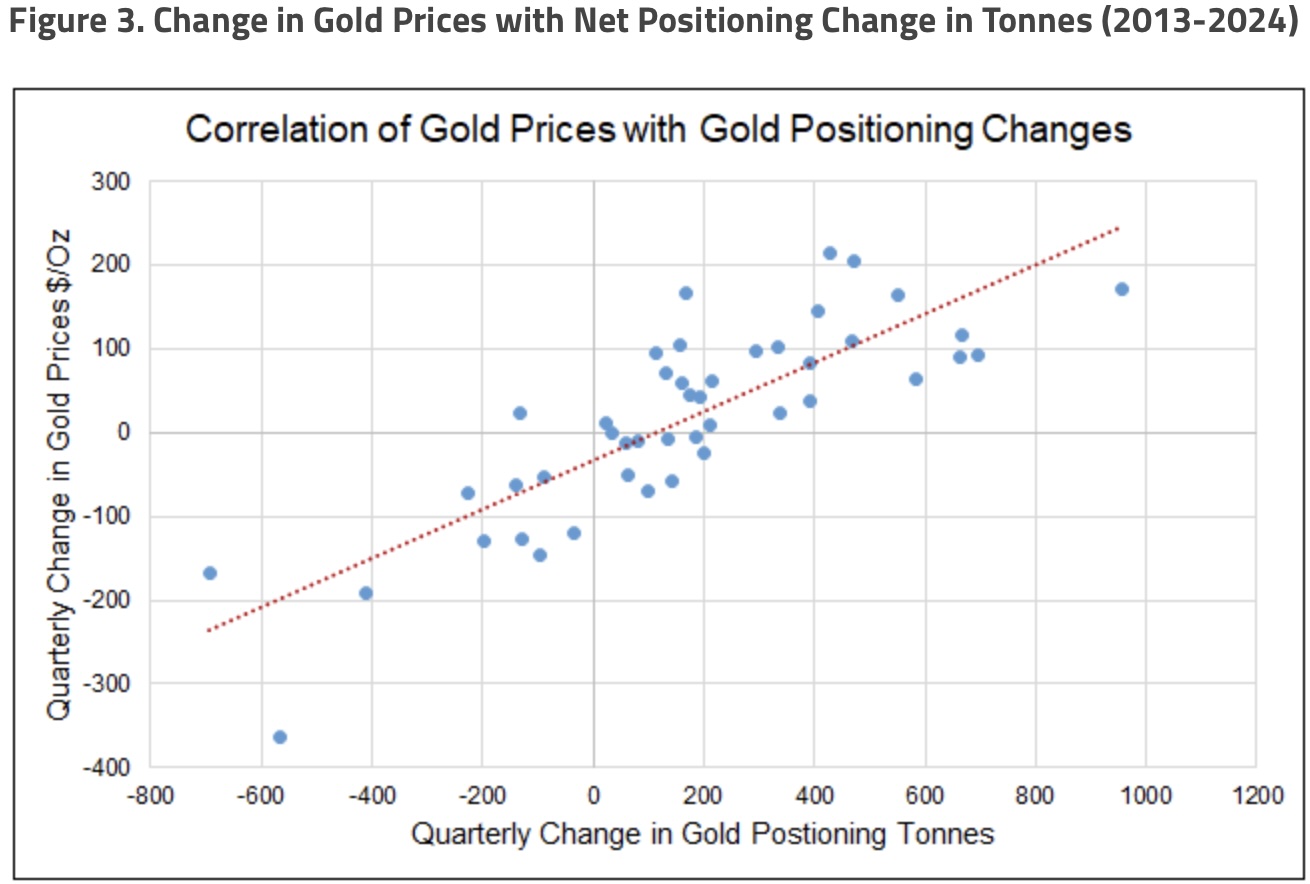
The significant gold price surge in Q3 was tricky to explain due to the variety of potential buying sources. CFTC (Commodity Futures Trading Commission) net non-commercial gold positioning rose by 215 tonnes (6.92 million ounces) during the quarter (~1 standard deviation). Gold holdings in ETFs increased by a modest 68 tonnes (2.28 million ounces, or 0.4 standard deviation); however, it was the first quarterly rise since Q1 of 2022. Buying from China seemed unlikely, as the Shanghai Gold Premium averaged a negative 0.17% for the quarter, and Shanghai gold futures’ net positioning showed a modest decline of three tonnes (-1%). Our models point to central banks or sovereigns as the most likely buyers behind the price surge, though central bank data is typically delayed by a few months. The Q3 13.23% rise in the gold price was substantial and represented the second-largest quarterly percentage change in the past decade. In dollar terms, the Q3 increase of $307.82 per ounce was the largest on record.
In Figure 3, we plot the quarterly price changes in U.S. dollars per ounce of gold alongside net tonnes purchased by central banks, CFTC net non-commercial futures and reported ETF holdings combined. Going back to Q2 2013, this data shows a strong correlation with an R-square of 0.70. For every $100 per ounce change in the price of gold, approximately 450 tonnes of net purchases by these three cohorts are implied. The massive price change for gold in Q3 suggests there may have been a record level of gold purchases during the quarter. However, we will have confirmation only once central bank data becomes available.
Gold Entering a New Price Regime
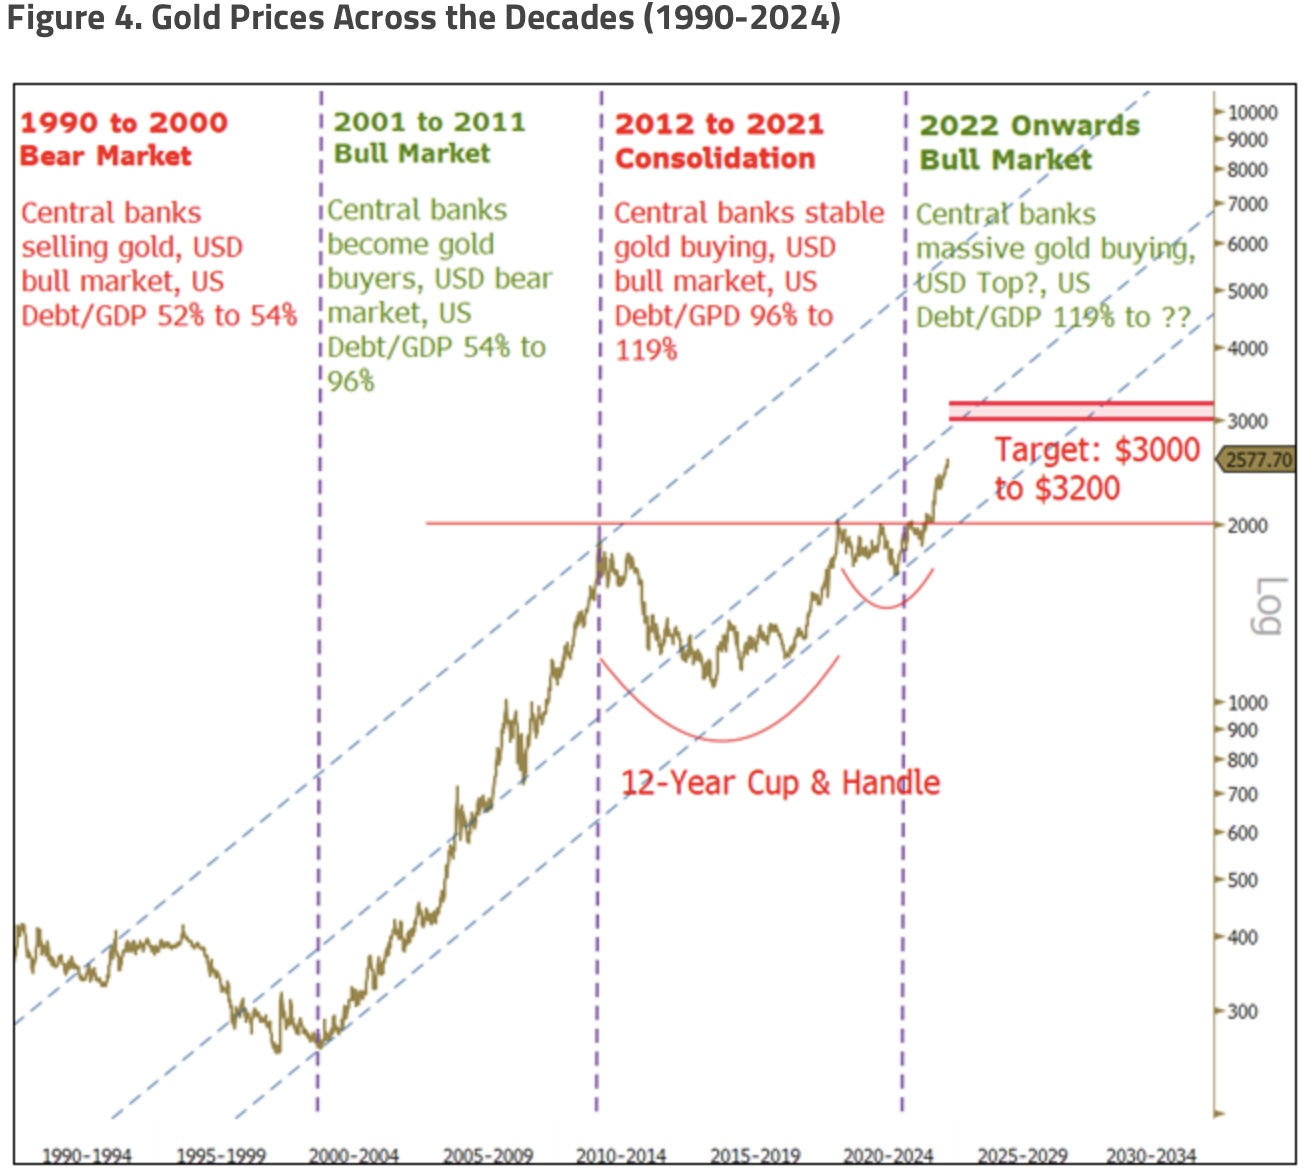
In a recent precious metals webcast, we highlighted a very long technical chart review on gold bullion. This report will expand on why we believe gold prices have entered a new bullish pricing regime. Figure 4 highlights gold prices by regime beginning in the 1990s. The overriding commonality across regime periods is central bank gold buying activity, the U.S. dollar and changes in debt. There were other factors, but we believe these three, in their totality and interconnectedness, explain the bulk of the price action of gold.
Here is a quick review of regime periods:
The 1990 to 2000 Bear Market
During this decade, central banks were selling up to 400 to 500 tonnes of gold by the late 1990s, as they favored diversifying away from gold, a non-yielding asset. During this decade, the “Great Moderation” (a period of low volatility in GDP, inflation, interest rates, etc.) was in full swing. The DXY (U.S. Dollar Index) increased by ~50%, and debt-to-GDP was flat as the U.S. ran balanced budgets. Gold fell roughly 35% during this regime.
The 2001 to 2011 Bull Market
The large selling of gold by central banks stopped and buying resumed, especially after 2008’s Global Financial Crisis (GFC). The GFC catalyzed a rapid expansion of debt, resulting in U.S. debt-to-GDP ratios almost doubling from 54% to 96%. The DXY fell 40%, real yields dropped from 4% to 0.2%, and gold increased sevenfold, peaking at a close of $1,900.
The 2012 to 2021 Consolidation
Central bank gold buying was stable during this period. U.S. debt-to-GDP still increased from 96% to 119% after the COVID-19 pandemic, but with Fed QE (quantitative easing) and ZIRP (zero interest rate policies),9 interest expense was well contained at about $460 billion on average. The DXY increased by 50% but in a gradual manner. After a rough start, gold ended flat during this regime but, in the process, set up a massive 12-year-long cup and handle chart pattern (a bullish continuation pattern; see Figure 4).
2022 and Onward Bull Market
Starting in Q3 2022, central banks have been buying gold at an average annual rate of 1,176 tonnes, about 2.4x the prior decade. This sudden rapid buying of gold was triggered by the freezing/seizure of Russia’s FX (foreign exchange) reserves by the West in response to the invasion of Ukraine. U.S. debt is now at $35.5 trillion, bringing the U.S. debt-to-GDP to 121%, but with the long-term (LT) trend in rates rising as the Fed battled inflation, the U.S. deficit is now $1.9 trillion, and interest expense on debt is over $1 trillion. Under any scenario, U.S. debt is forecasted to rise over the next several years under any administration. Lastly, the chart on the DXY (U.S. Dollar Index), appears to be on the verge of a significant top. We provide more information below on these three main drivers.
A Quick Review of the Three Main Catalysts for a Bullish Gold Regime
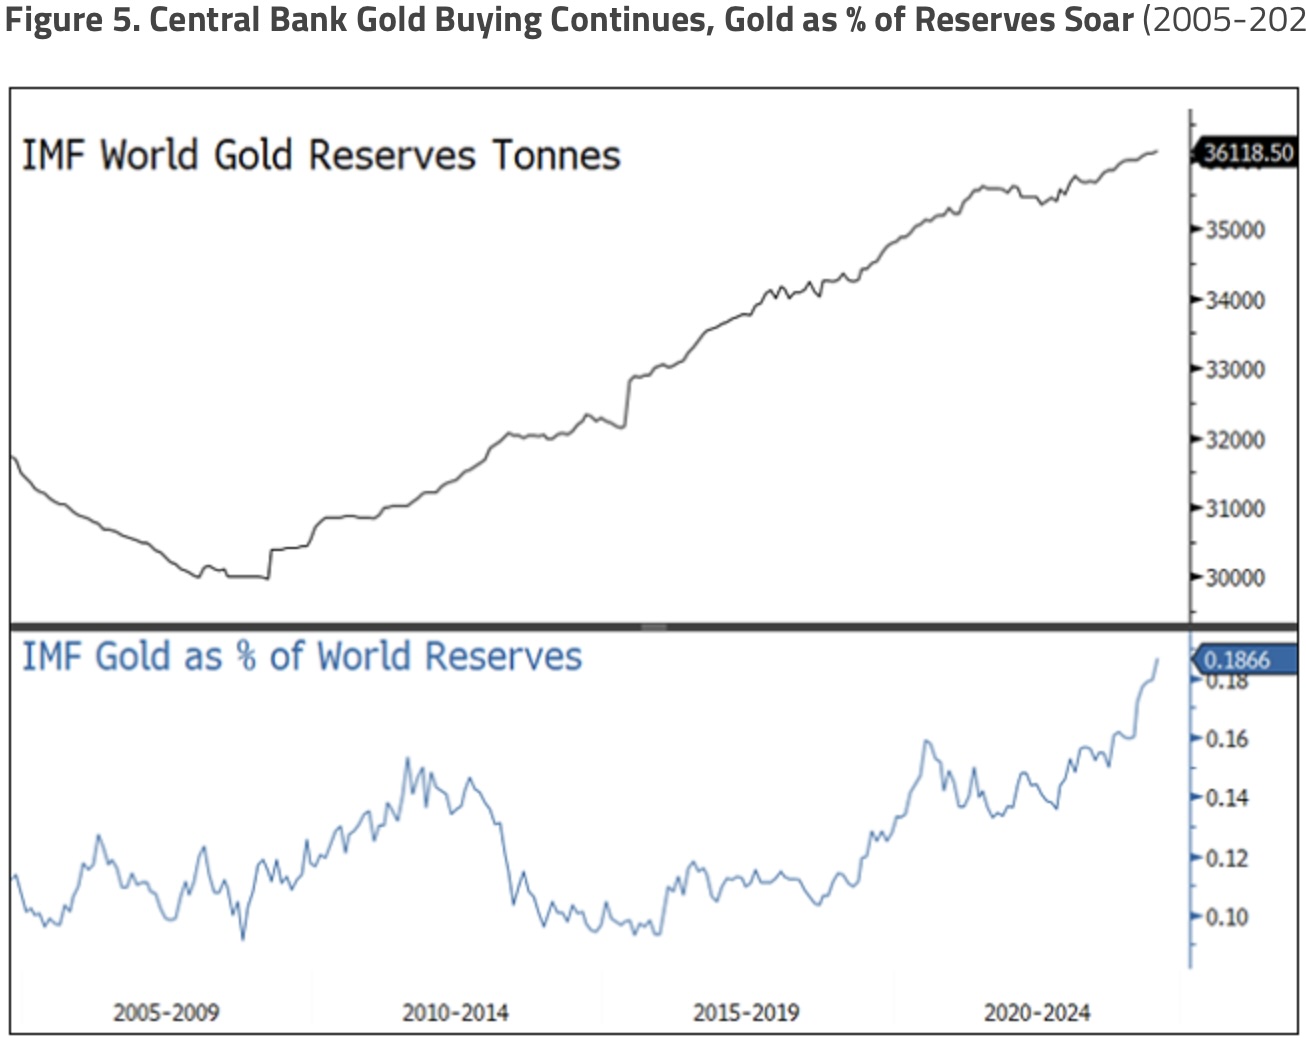
1. Central Bank Buying: Gold as a Percentage of World Reserves Reaches 27-Year High
The IMF (International Monetary Fund) reported world reserve gold holdings were 36,118 tonnes, representing 18.66% of total world reserves (as of July 31, 2024), the highest percentage since 1997. Since the 2016 lows, gold as a percentage of total reserves has now doubled from about 9%. China, which has been the dominant gold buyer over the past several years, reported holding 2,264 tonnes of gold in its reserves, representing 5.32% of total reserves. Relative to world reserve levels, China has room and incentives to increase its gold reserves further as geopolitical risks and trade tensions climb.
Our last report provided a more detailed summary of ongoing planned central bank gold buying intentions.
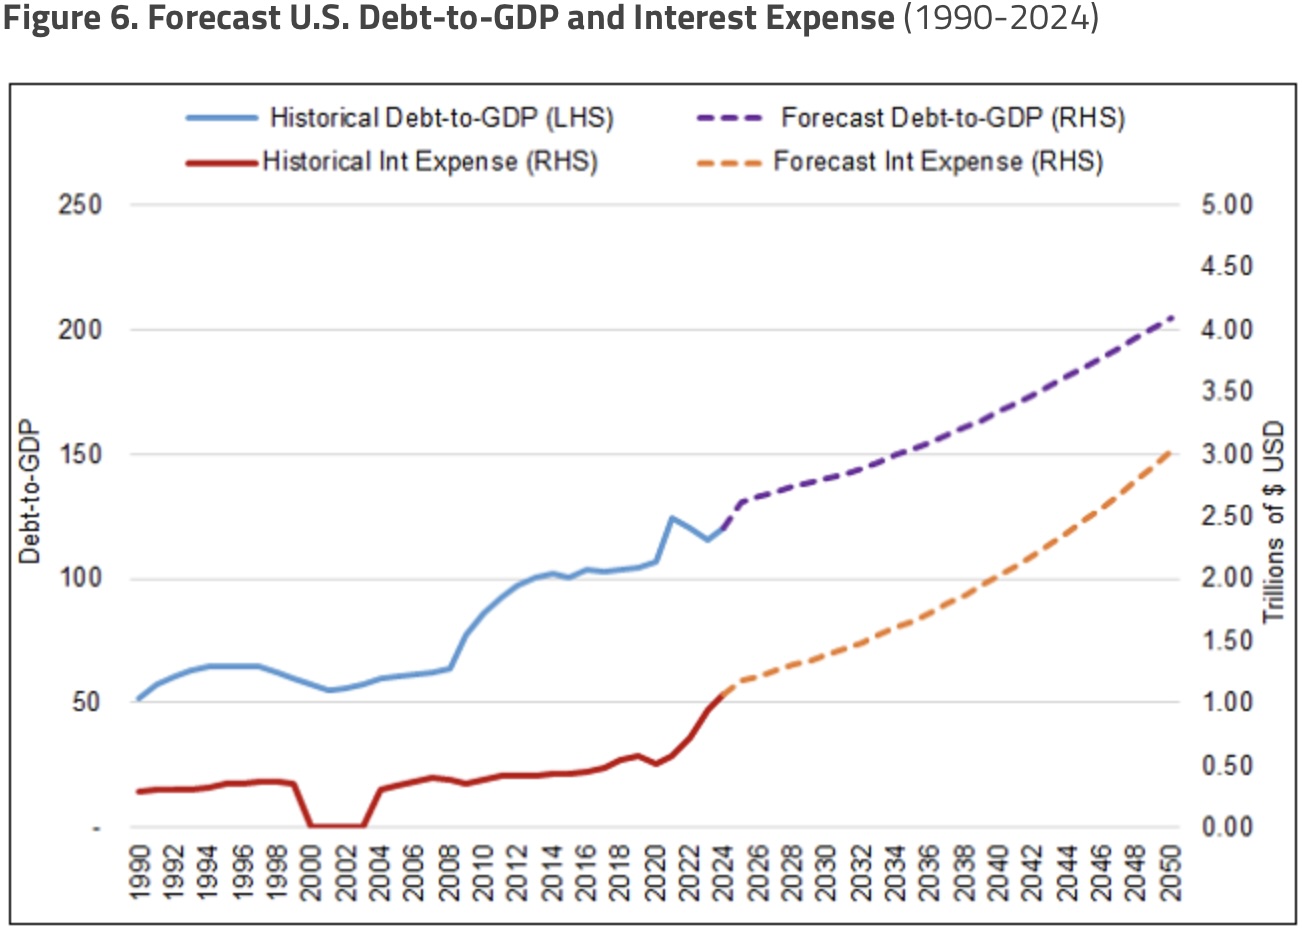
2. U.S. Debt-to-GDP Will Likely Continue to Soar, As Will Interest Expense
Since the COVID-19 pandemic, U.S. debt outstanding has now increased by 50% to $35.5 trillion, bringing U.S. debt-to-GDP to 121%, with no signs of slowing. Under any scenario and any administration, U.S. debt is expected to rise. Using FRED (Federal Reserve Economic Data) and CBO (Congressional Budget Office) projected data estimates, U.S. debt-to-GDP is expected to increase steadily out to 2050. For reference, U.S. debt-to-GDP is expected to rise to 140%, 167% and 205% in the years 2030, 2040, and 2050, respectively.
U.S. interest expense since the rate increases that began during Q1 2022 has soared to $1.1 trillion. With the days of QE/ZIRP well past and debt set to soar, interest expense is set to climb. In the prior “2012 to 2021 Consolidation Regime,” for gold, U.S. debt-to-GDP averaged a very high ~105%. However, the average interest expense on debt was subdued relative to debt due to the Fed’s QE/ZIRP policies during the majority of this regime. In the next 10 years, interest expense is estimated to be about $1.7 trillion, just below Social Security and Medicare as the largest budget item. In the “2022 Onward” gold regime, U.S. debt-to-GDP is forecasted to surge again, but this time with interest expense rising as well.
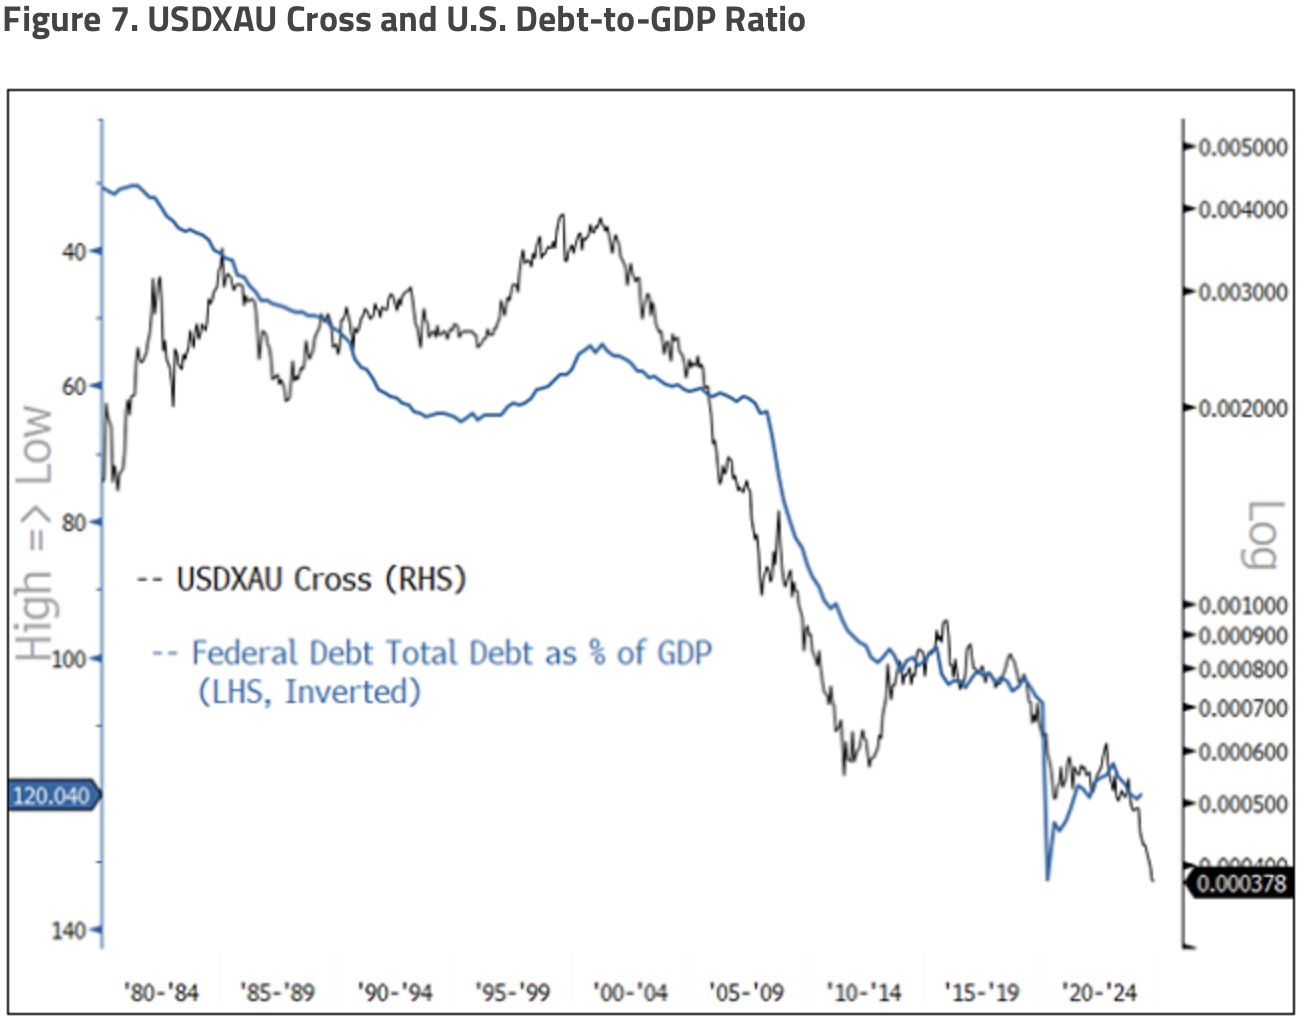
Rising U.S. debt-to-GDP ratios have historically led to higher gold prices due to concerns over the sustainability of debt, currency devaluation and debt monetization. As debt grows, governments may print money to manage deficits and weaken the currency, causing a loss of confidence in fiat currencies and boosting gold’s appeal as a store of value. Additionally, high debt can lead to negative real yields and raise concerns about geopolitical and systemic risk, increasing gold’s attractiveness as a safe haven asset. Investors turn to gold to hedge against these risks, including inflation and potential sovereign debt crises .
Figure 7 highlights the relationship between gold and U.S. debt-to-GDP. For gold, we used the USDXAU cross (i.e., U.S. Dollar/Gold Cross; translated as “one USD buys X ounces of gold”). By this measure, the USD (a representative fiat currency), relative to gold (a representative store of value), has lost significant value over time. Since January 29, 1971, the USD has lost 98.56% of its value relative to gold. From 20 and 10 years ago, the USDXAU cross fell by 84.1% and 54.1%, respectively. Given the near certainty of increasing debt, we believe the USDXAU cross is poised to fall further.
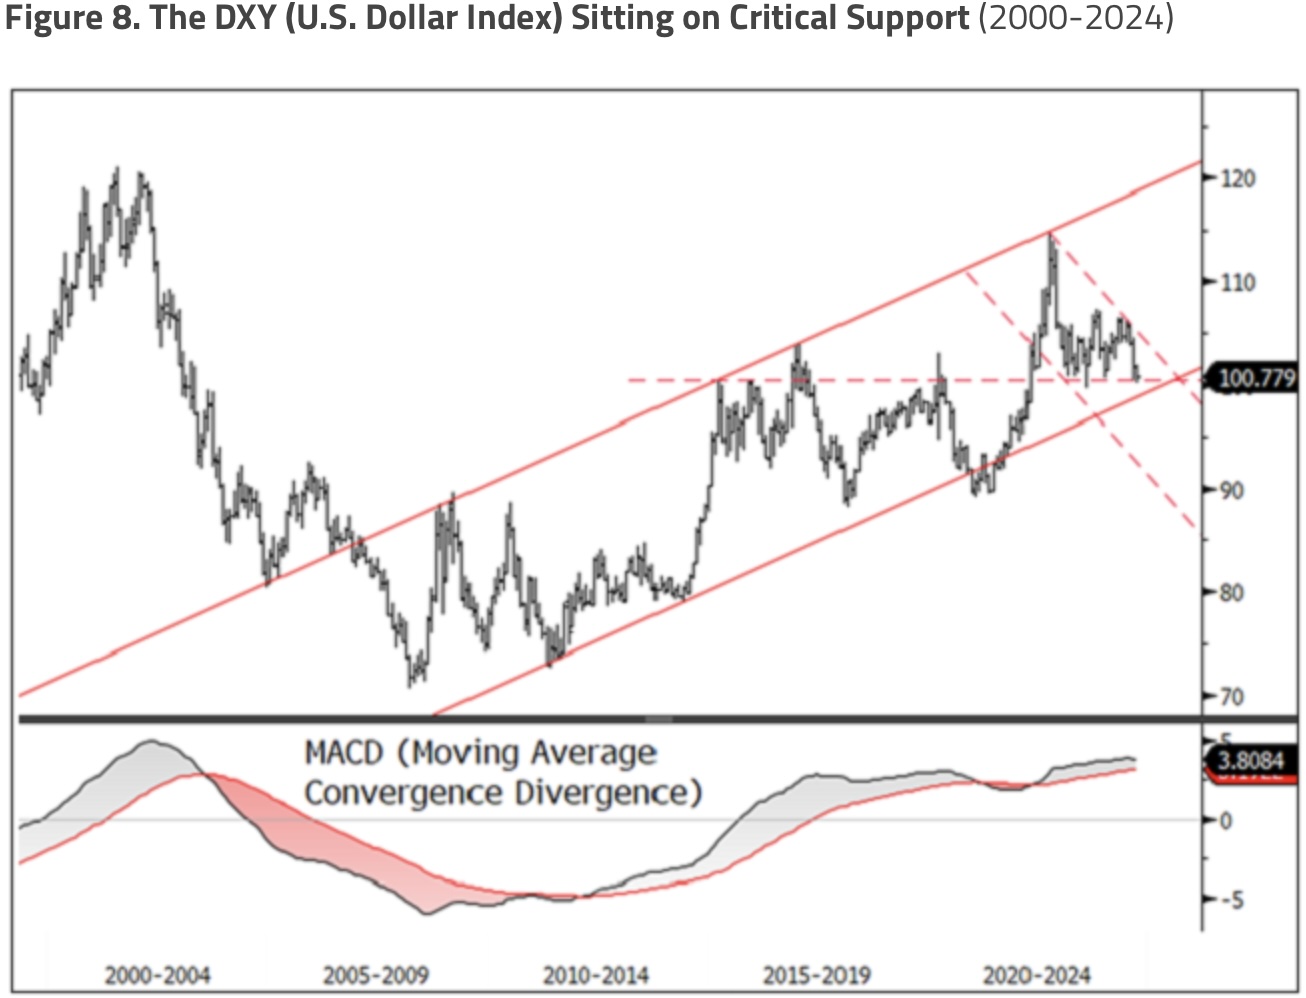
3. U.S. Dollar Potential Secular Top
Figure 8 illustrates that the DXY, the US Dollar Index, has been in a rising channel for over 15 years but is now sitting on critical long-term support as momentum wanes (MACD; moving average convergence divergence). Breaking below support would be a warning that this long secular uptrend in DXY is over and a new secular downtrend may be possible. The cause of the past decade’s rise in the DXY varied, but diverging monetary policies and U.S. economic outperformance resulted in higher relative yield spreads favoring the USD (relative yield spread models with DXY provide an R-square of 0.67). However, there are signs this may reverse.
Looking out to this regime, we expect monetary policy shifts will play a significant role. U.S. yields have a greater potential to fall in this global interest rate-cutting cycle as the U.S. 2-year Treasury yields reached a high range of 5.2%, while GDBR (German Bund) 2-year yields reached only 3.2% (a 200 basis points gap). After over a decade of outperformance, many view the USD as overvalued and vulnerable to mean reversion. There are many other possible factors, such as relative productivity gains, real interest rates, inflation, etc., that will influence the path of the DXY, but the path of least resistance appears to be lower.
Prevalent Questions on the Outlook on Gold and Silver Markets
Gold and silver have long been held by central banks and in the financial markets and are well regarded for their historical roles as stores of value and as hedges against uncertainties. Recent price movements in both metals reflect complex interactions between macroeconomic drivers, geopolitical risks and evolving industrial applications. Both metals continue to serve as critical hedges against inflation, economic uncertainty and geopolitical risks, while silver benefits additionally from its role in industrial applications, especially in photovoltaics (PVs).
As inflationary pressures persist and global economies face difficult macroeconomic conditions, central banks and investors are more likely to allocate to precious metals. In our view, the long-term outlook for both gold and silver appears robust, driven by central bank buying, ever-expanding debt, and a possible peak in the USD in response to government policies and deepening deglobalization trends.
1. Primary Drivers of Recent Gold and Silver Price Movements
- Central Bank Gold Buying: Since Q3 2022, central banks have increased gold purchases by ~2.4x as they seek to lower their overall USD exposure while diversifying and hedging their reserves.
- Inflation: High persistent inflation expectations (as implied by 5Y5Y inflation swaps and a higher neutral rate) boost demand for gold and silver as hedges against the eroding purchasing power of fiat currencies.
- Falling Interest Rates: Lower interest rates reduce the opportunity cost of holding non-yielding assets such as gold and silver.
- Geopolitical Risks: Global conflicts and geopolitical instability drive demand for gold as a safe haven asset. Central banks have ramped up gold purchases to diversify reserves and reduce reliance on foreign currencies as protection from political risks, sanctions and seizure.
- Supply-Demand Dynamics: Industrial demand, especially in PVs, supports silver prices, while central bank purchases have been a significant demand driver for gold.
2. Gold and Silver as Safe Haven Assets
- Economic Downturns: Gold typically sees increased demand during economic weakness and market volatility.
- Currency Devaluation: Gold has traditionally been a robust store of value during fiat currency weakness driven by inflation, rapid debt expansion or aggressive monetary easing. Silver shares this trait but is more volatile due to its dual role as a precious and industrial metal.
- Geopolitical Instability: Gold, as a safe haven, has thrived in times of geopolitical risk, while silver has benefited from growth in renewables and electronics.
3. Central Bank Policies and Their Impact
- Interest Rates: Rising rates increase the appeal of interest-bearing assets at the expense of gold and silver, while rate cuts could boost gold and silver prices.
- Aggressive Monetary Easing: Excessive easy monetary policy, generally associated with high debt, will eventually devalue the USD and other currencies, likely benefiting gold and silver as investors move to hard assets.
- Inflation Control: If central banks struggle to rein in inflation, demand for gold and silver as hedges will likely remain robust, further driving prices higher.
- Central Bank Purchases: Many central banks, especially emerging market central banks, continue to accumulate gold, providing a foundational base for long-term gold demand.
4. Key Factors Driving Silver Prices: Dual Role as a Precious and Industrial Metal
- Monetary and Inflationary Hedge: Silver, like gold, acts as a store of value. It is more volatile but is an accessible alternative to gold.
- Energy Transition Demand: Silver’s increasing use in renewables, electric vehicles (EVs), and electronics, which are growing much faster than GDP, supports its long-term high growth outlook.
- Supply Constraints: Mine production has been flat for over a decade; the trend is poised to continue and potential disruptions may create a supply-demand imbalance.
- Economic Cycles: An economic recovery and a resource commodity bull market will likely boost silver prices.
Man Who Correctly Predicted Gold Would Soar In 2024, Just Issued A Dire Warning For The World
*To listen to Gerald Celente’s dire warning for the world as well as predictions for gold, silver, inflation, war and much more CLICK HERE OR ON THE IMAGE BELOW.

GOLD & SILVER UPDATE: Just Released!
To listen to Alasdair Macleod discuss gold hitting a new all-time high, silver on the cusp of a truly historic upside breakout as well as what to expect from the high-quality mining and exploration stocks CLICK HERE OR ON THE IMAGE BELOW.

© 2024 by King World News®. All Rights Reserved. This material may not be published, broadcast, rewritten, or redistributed. However, linking directly to the articles is permitted and encouraged.


