

We are on the verge of a historic collapse, but here is the silver lining.
A Day Of Reckoning Is Fast Approaching
July 28 (King World News) – Mark Lundeen: Since March 2009, the NYSE Financial Index has advanced, seeing proper corrections as it has. But this advance was made possible by four QEs implemented by a bunch of idiots at the FOMC. Where it, and the entire stock market would be today without this tsunami of “liquidity” flowing from the FOMC, no one can really say.
In the years to come, I believe Mr Bear has some unfinished business with the NYSE Financial Index, and the stock market as a whole.
Here is a chart I haven’t published since last winter; the Dow Jones with its 52Wk High and Low lines. The last time the Dow Jones pushed down on its 52Wk Low line was in October 2022. But since last November, it has pushed its 52Wk High line to well over 40,000.
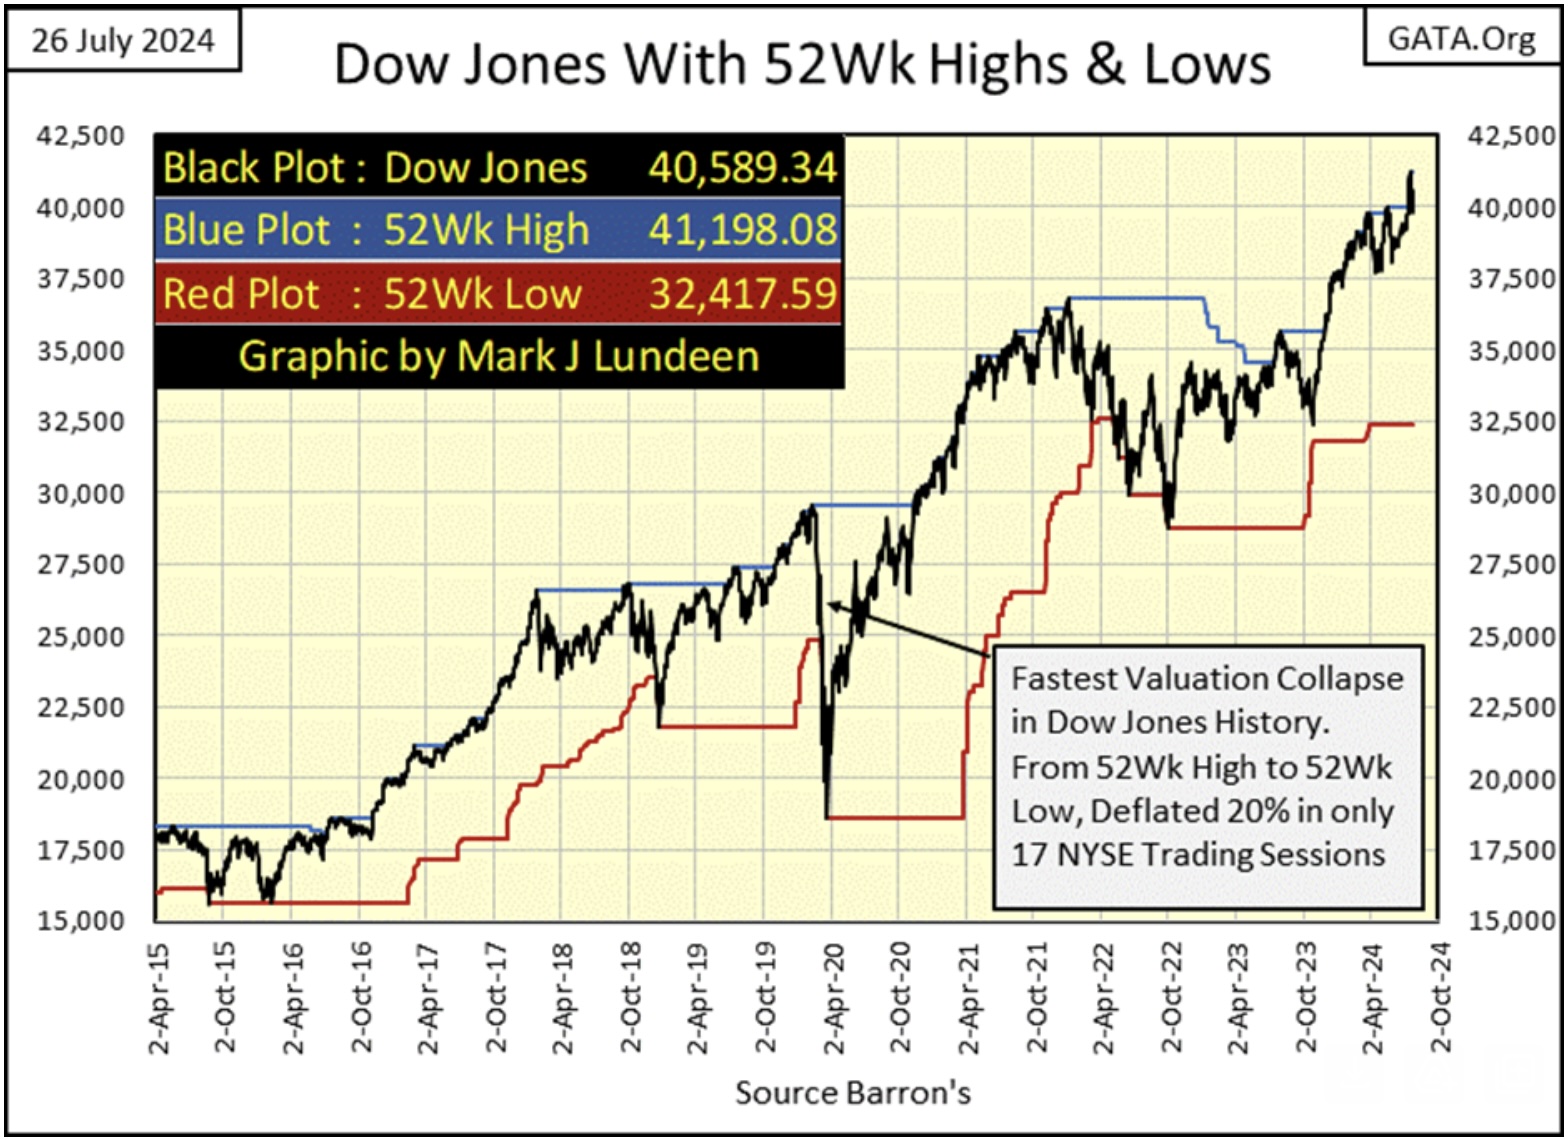
To once again push down on its 52Wk Low line, at this week’s close, the Dow Jones would have to close below 32,417.59, a decline of 21.31% from its last all-time high.
Such a decline could be a correction in a bull market. But this bull market began in August 1982, when the Dow Jones last closed below 800. In the following forty-two years, the Dow Jones has advanced over 40,000 points, thanks to the tsunami of “liquidity” flowing from the Federal Reserve System, making this market advance, one I really don’t like…
Listen to the greatest Egon von Greyerz audio interview ever
by CLICKING HERE OR ON THE IMAGE BELOW.


The Tsunami Of Liquidity
Since March 2009, the NYSE Financial Index has advanced, seeing proper corrections as it has. But this advance was made possible by four QEs implemented by a bunch of idiots at the FOMC. Where it, and the entire stock market would be today without this tsunami of “liquidity” flowing from the FOMC, no one can really say.
In the years to come, I believe Mr Bear has some unfinished business with the NYSE Financial Index, and the stock market as a whole.
Currently, I’m content just watching the market from my vantage point high above, in the market’s peanut gallery. I feel no need to make any prediction for this or that, or when said this or that is to happen.
However, there is no shortage of potential domestic and global events that could have a massive impact on the stock and bond markets. In the years to come, could the Dow Jones advance to something above 50,000? Sure, why not? It’s not as if one day, the FOMC will run out of “liquidity” to “inject” into the market.
I’m just keeping it in mind, these massive gains are only the result of a massive bubble being inflated into the market, and with every inflationary boom, comes its deflationary bust.

Time
The big problem with gold, silver and their miners, is one of time. The bull market in precious metal assets isn’t advancing as fast as investors would like them to be. Let it be known that I’m sick of waiting too, but it is what it is – damn it.
Looking at gold’s step sum table below, gold’s 15-count increased to a +7 on July 10th, just days before its last all-time high on July 16th. A 15-count of +7 says the gold market is overbought, and markets don’t like being overbought.
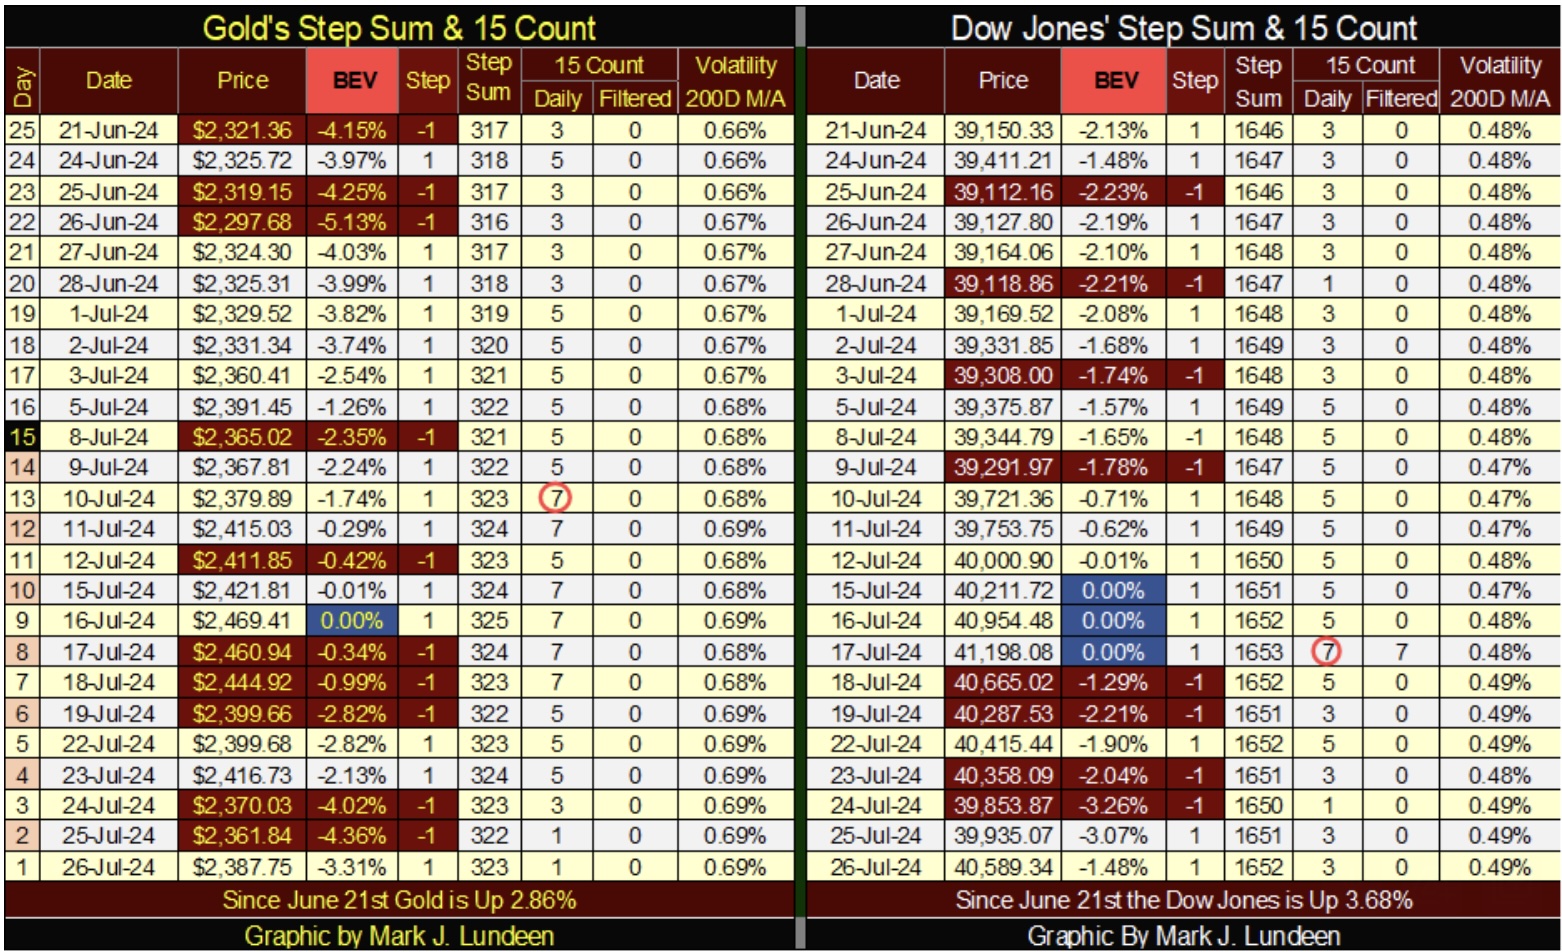
Note the number of down days in the gold market soon increased, bringing the gold’s market’s 15-count down to a +1 at the close of this week. The price of gold since its last all-time high is down about $100, and on Thursday, saw its BEV decline to -4.36%, not far from closing outside of scoring position.
We may see additional selling in the weeks to come, possibly taking gold’s 15-count into negative territory, and its BEV below scoring position. But in the give and take of the market, soon the overwhelming down days that followed gold’s +7 count seen below, will be followed by a period where advancing days will overwhelm declining days. Will the bulls then take gold to a new all-time high? I’m thinking that, and we’ll soon see if I’m right.
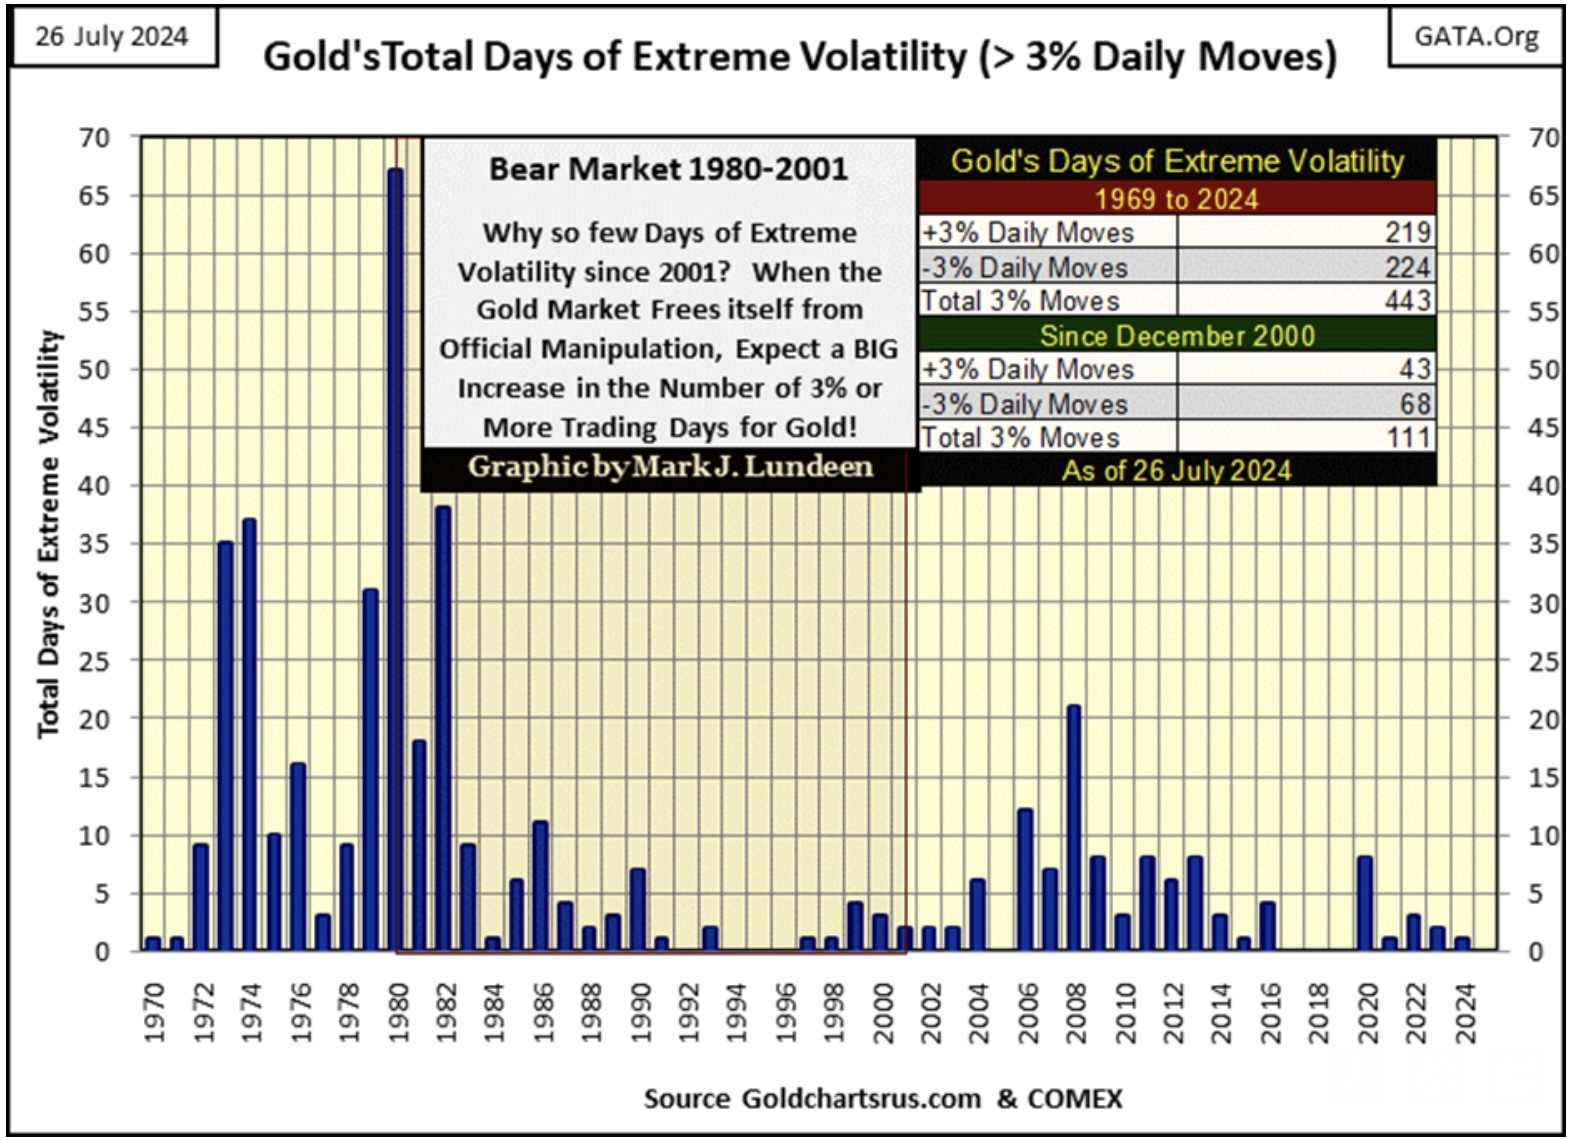
One factor that would really help that happen; seeing gold close at new all-time highs, would be seeing golds’ daily volatility’s 200D M/A begin advancing towards 1.00%. But so far in 2024, gold’s days of extreme volatility, days where gold moves up (or down) by 3%, or more from a previous day’s closing price, is only 1, as seen in the chart below.
This chart of annual extreme days in the gold market makes clear the difference between the 1969 – 1980 bull market, and our current bull market that began in 2002. The bull market from five decades ago was an exciting bull market, with huge daily swings in the price of gold, both up and down, daily moves in excess of 3% from a previous day’s closing price.
Since this bull market began in 2002, volatility, and excitement in the gold market has been greatly muted. Why would that be? I take it that Edmund Burke had it exactly right when he said;
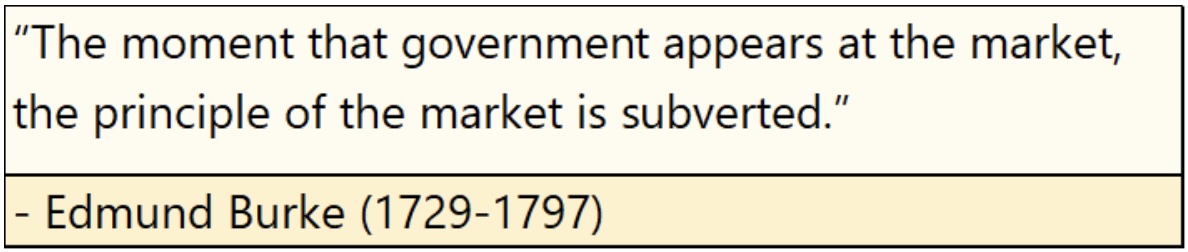
To see gold and silver soar higher in a huge bull market, is not in the favor of the government that demonetized them. The government that replaced the old monetary metals with paper, and digital money that very predictably, is rapidly becoming worthless.
This dearth in gold’s 3% days since 2002, seen below, indicates the government and its “regulators,” have been very successful in keeping a lid on any excitement in the precious metals market, intent on keeping money now circulating on Wall Street, far from the gold and silver market.
When gold and silver finally break free from their “market regulators” grasps, I predict we’ll see a spike in 3% days in gold, similar to what can be seen above during the 1970s.
Just Released!
To listen to Alasdair Macleod discuss the volatile trading in the gold and silver markets click here or on the image below.

© 2024 by King World News®. All Rights Reserved. This material may not be published, broadcast, rewritten, or redistributed. However, linking directly to the articles is permitted and encouraged.


