

With the price of gold continuing to flirt with a new all-time high, Sprott just warned a massive short squeeze may be in the cards for the gold market.
Gold Bulls Run Faster As Fed Tackles Banking Crisis
April 6 (King World News) – Paul Wong, Market Strategist at Sprott Asset Management: Gold bulls run faster as Fed tackles banking crisis.
Key Takeaways
- Gold prices surged in March when banking stress emerged in the wake of aggressive rate hikes by the U.S. Federal Reserve (the Fed).
- The U.S. dollar index declined as the Fed reopened USD central bank swap lines.
- Higher volatility and reduced liquidity in the U.S. Treasury market flashed warning signs reminiscent of the Global Financial Crisis (GFC), although these have abated somewhat.
- The Fed faces a difficult choice — prioritize its inflation flight or prevent financial stress?
March Review
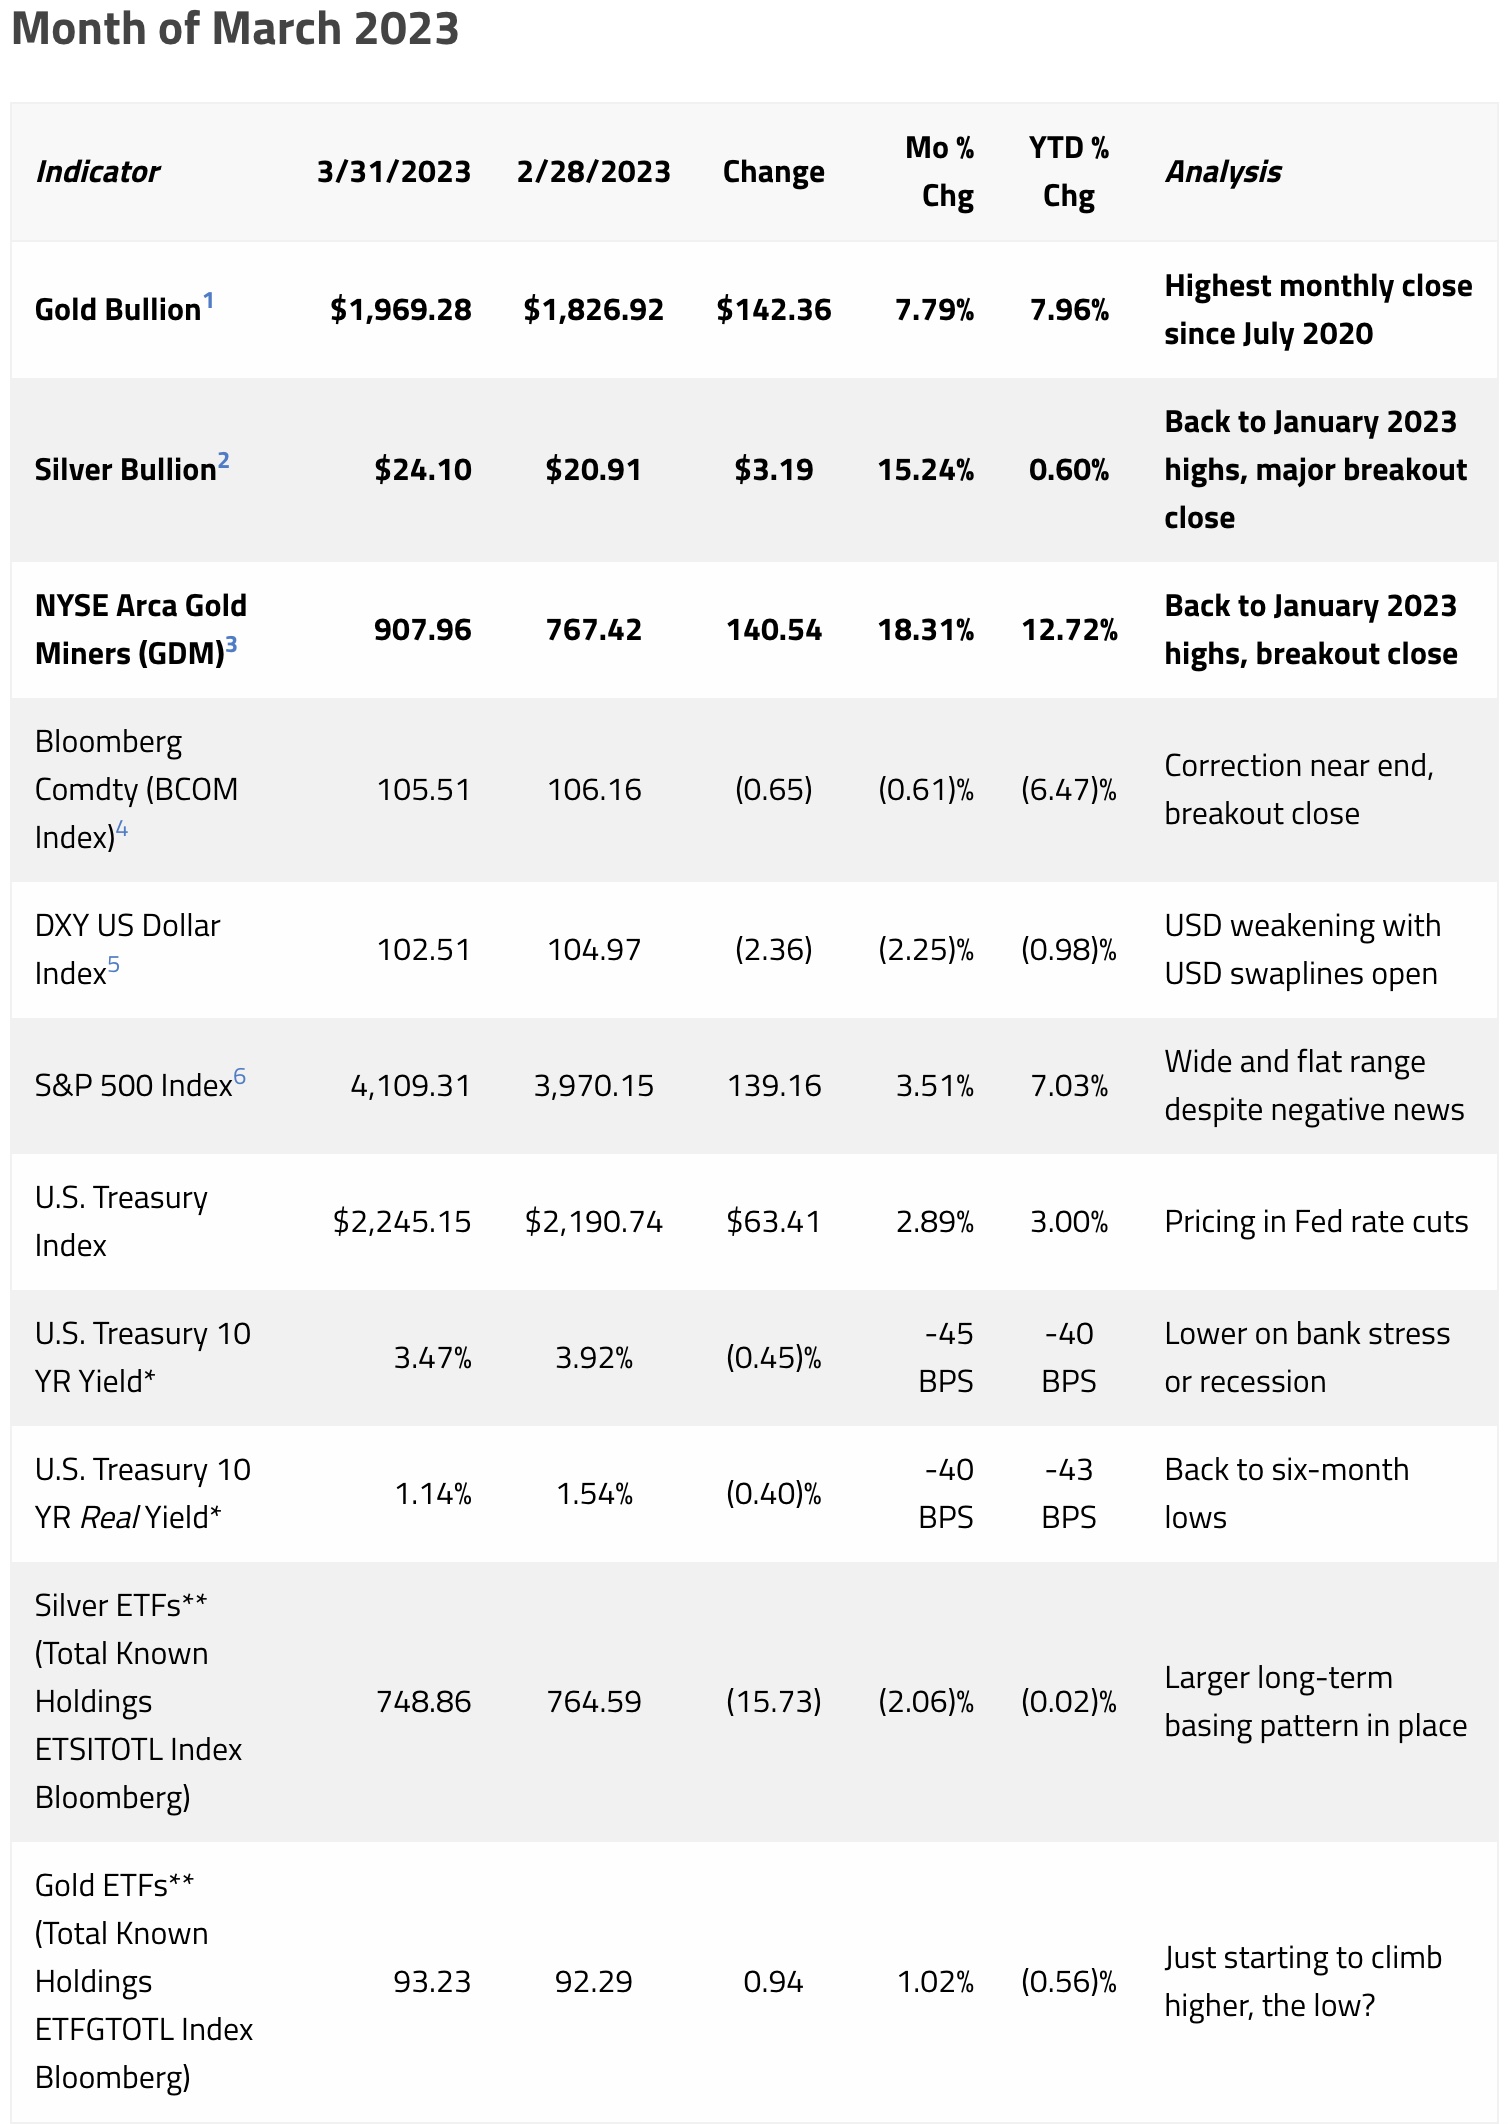
The gold spot price soared by $142.35/oz (or +7.79%) to close March at $1,969.28 as the U.S. banking crisis unfolded amid the Fed’s fight against inflation. There had been concerns about whether the financial system could absorb rate hikes to the level required to tame inflation. However, the sudden collapse of Silicon Valley Bank and the emergency buyout of Credit Suisse came as a huge surprise. After pulling back in February on a higher rate outlook due to resurgent inflation data, gold posted its largest monthly gain since July 2020. Bond yields fell as markets began to price in potential Fed rate cuts due to the possibility of a financial crisis or related economic recession.
Equity markets broadly shrugged off the banking stress and posted gains in March, but they remained range-bound from mechanical flows in and out of systematic funds and options-linked hedging. There were wide divergences in performance in March, however. Long-duration sectors, such as mega-cap technology stocks, moved higher while financials, especially regional banks, fell sharply. Surprisingly, while the CBOE Volatility Index (the VIX), which tracks expected equity volatility, remains near its post-COVID trading lows, the Merrill Lynch Option Volatility (MOVE) Index, which tracks expected Treasury rate volatility, is pricing in stress akin to the 2008‒09 GFC. This is a remarkable divergence between the two volatility measures.
Only a month ago, the concern was that the U.S. economy was too hot and the Fed would be forced to be hawkish with rate hikes of 0.50%, leading the Fed Funds rate to reach a terminal level of 5.7%. In less than a week, the banking crisis forced the bond market to reprice the end of the rate hike cycle, and significant rate cuts are now expected by yearend on a combination of a credit crunch-induced economic slowdown and further financial system stress.
Gold has responded very well in this environment, as the market has acknowledged two possible left-tail outcomes: either higher inflation if interest rates are lowered to stabilize the financial system or further financial system stress if rates are kept higher for longer to combat inflation.
Gold Bullion Technicals
In March, gold had its highest monthly close since July 2020 and rounded out a solid Q1 2023 gain of 7.96%. Gold is now up 21.38% from last autumn’s lows (9/26/22 to 3/31/23) following the most aggressive central bank purchases in decades and gold investment flows catalyzed by the U.S. banking crisis.
Since the 2020 peak, gold has been consolidating within a wide trading range, and the technical chart suggests it is building toward an eventual breakout. Figure 1 plots gold bullion’s breakout pattern and potential projected targets above the prior high in 2020‒22.
Should Gold Move Higher?
Gold looks increasingly vulnerable to a price squeeze higher for the following reasons:
Reason A. Long Investment Positioning Remains Muted
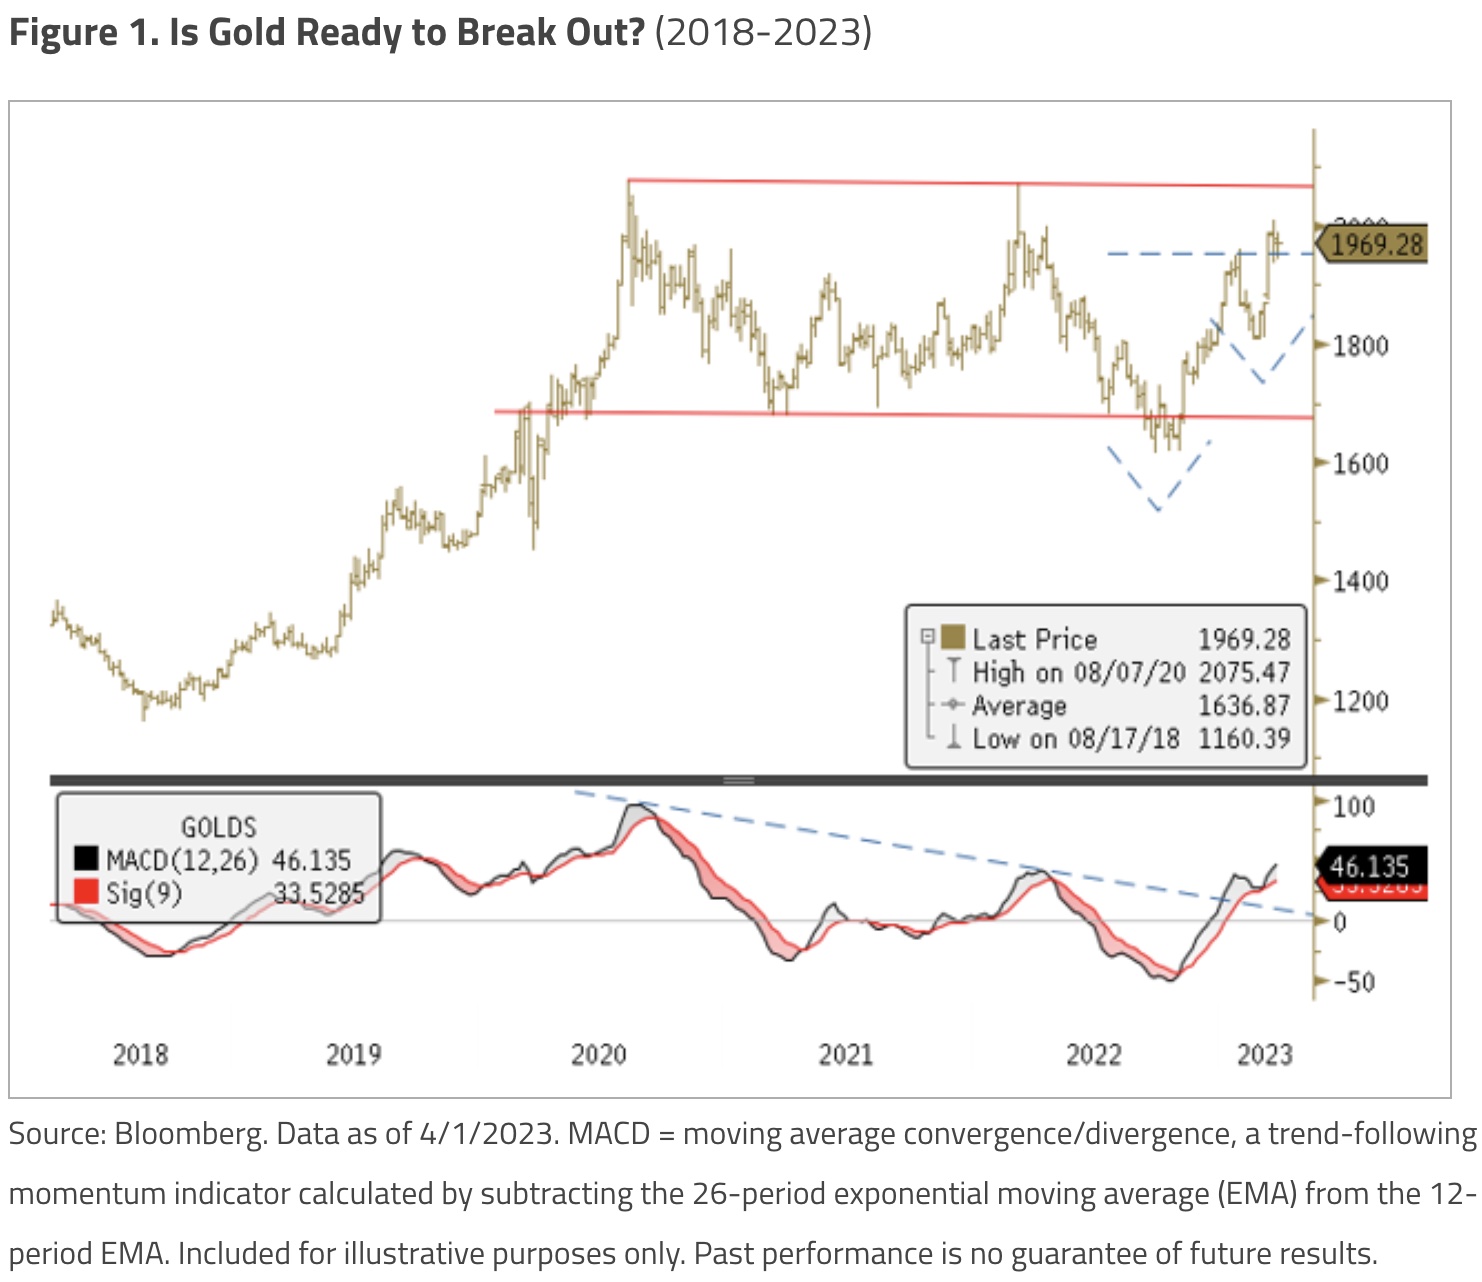
In our February 2023 commentary, “First Gold Dip Since Central Bank Buying Spree”, we highlighted that central bank buying has been the dominant source of demand in the physical gold market since at least mid-2022. With physical buyers leading the way, gold’s correlation with real yields (gold as a financial asset) has ended, as shown in the top panel of Figure 2. The inverse correlation between gold and yields on 10-year U.S. Treasury inflation-protected securities (TIPS), which had held since the GFC, ended during the inflation breakout in early 2022.
The lower panel of Figure 2 shows the two largest subsets of gold held for investment purposes: gold in ETFs and gold held by speculative traders on U.S. futures exchanges as measured by the CFTC gold non-commercial net positions report. While gold bullion prices are near all-time highs today, gold held in ETFs is close to a three-year low, and CFTC-reported gold holdings are around their long-term average after a recent uptick. However, breaking down the CFTC data indicates that most of the increase in investment flows into gold over the past year was from short-covering, not robust long buying. In other words, there is still considerable dry powder from potential long-term gold investors.
Reason B. Options Activity is Also Subdued
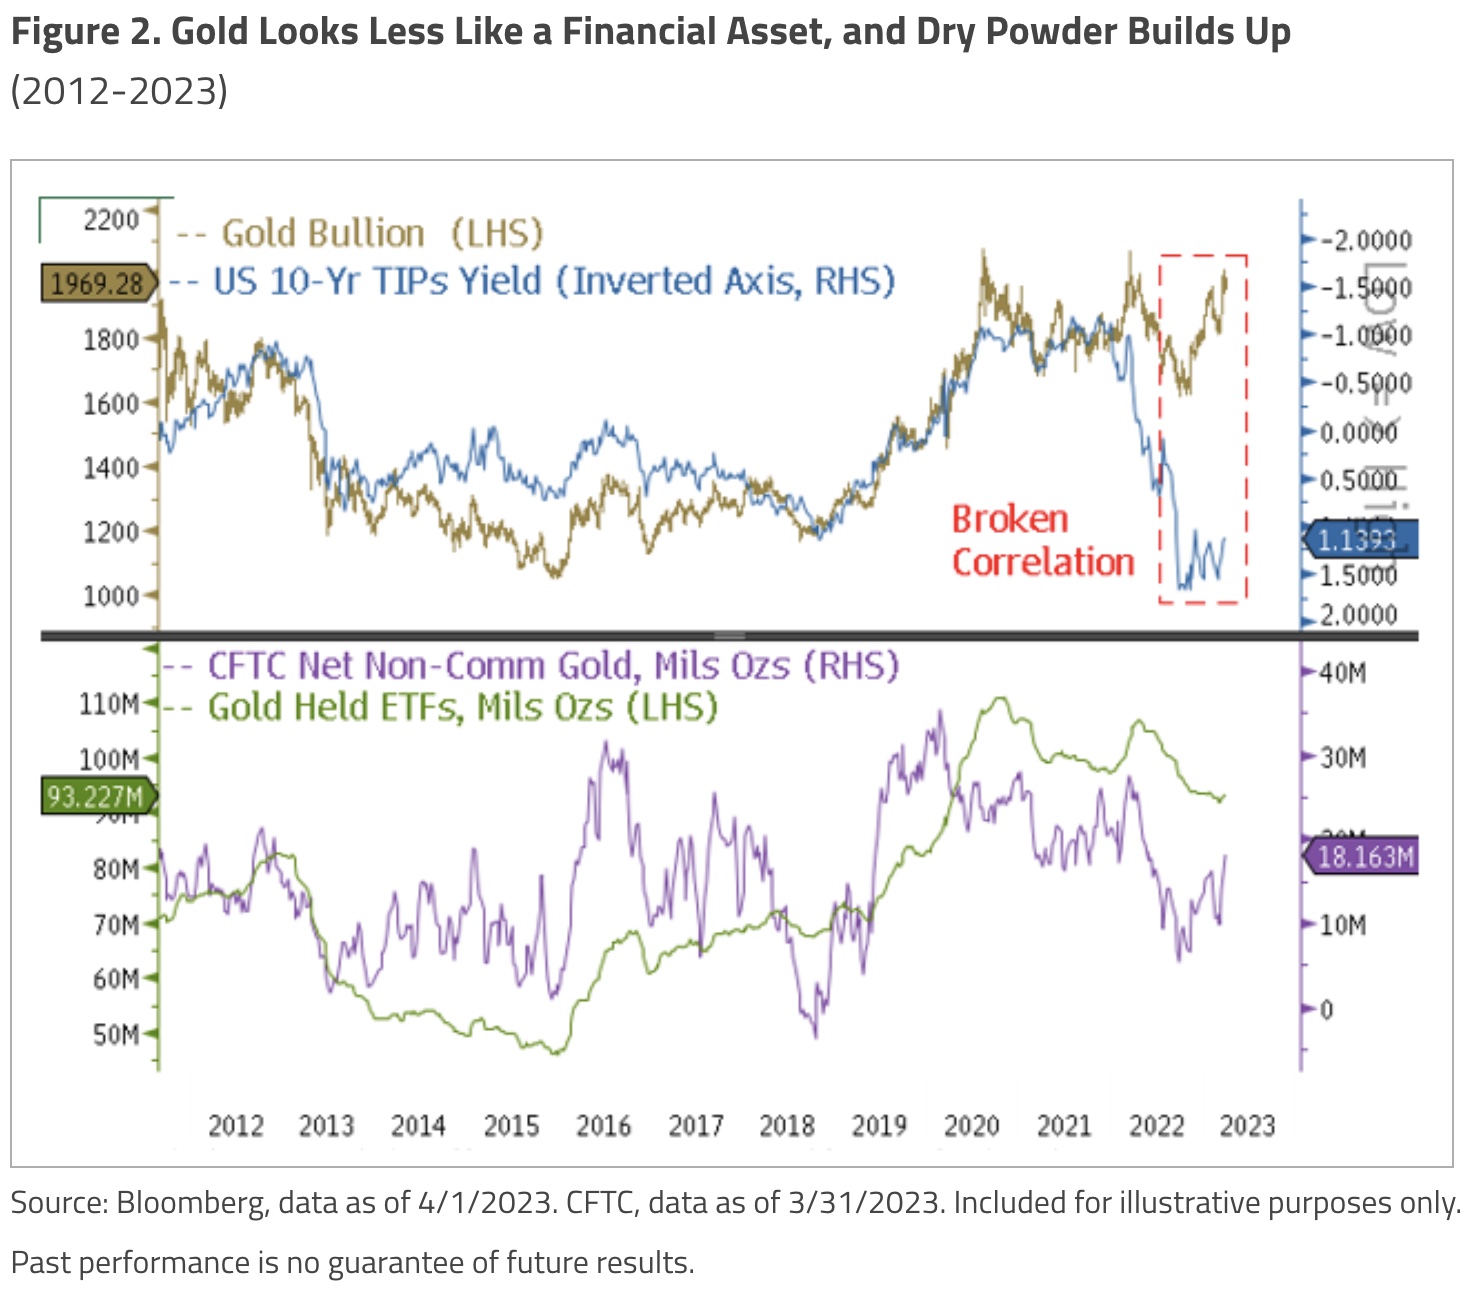
Speculative options activity by investors is also down. Figure 3 shows open interest puts and calls on the SPDR Gold Trust ETF (GLD) converted into notional ounces to compare it to ETF gold holdings. In January, GLD option open interest reached a 10-year low even though central banks were buying aggressively. This is another investment market segment that does not appear to have factored in physical buying by central banks and sovereigns, which skews the risk toward a price squeeze higher. As Figure 3 shows, notional ounces of gold have reached the 500 million ounce range more than once in the past decade.
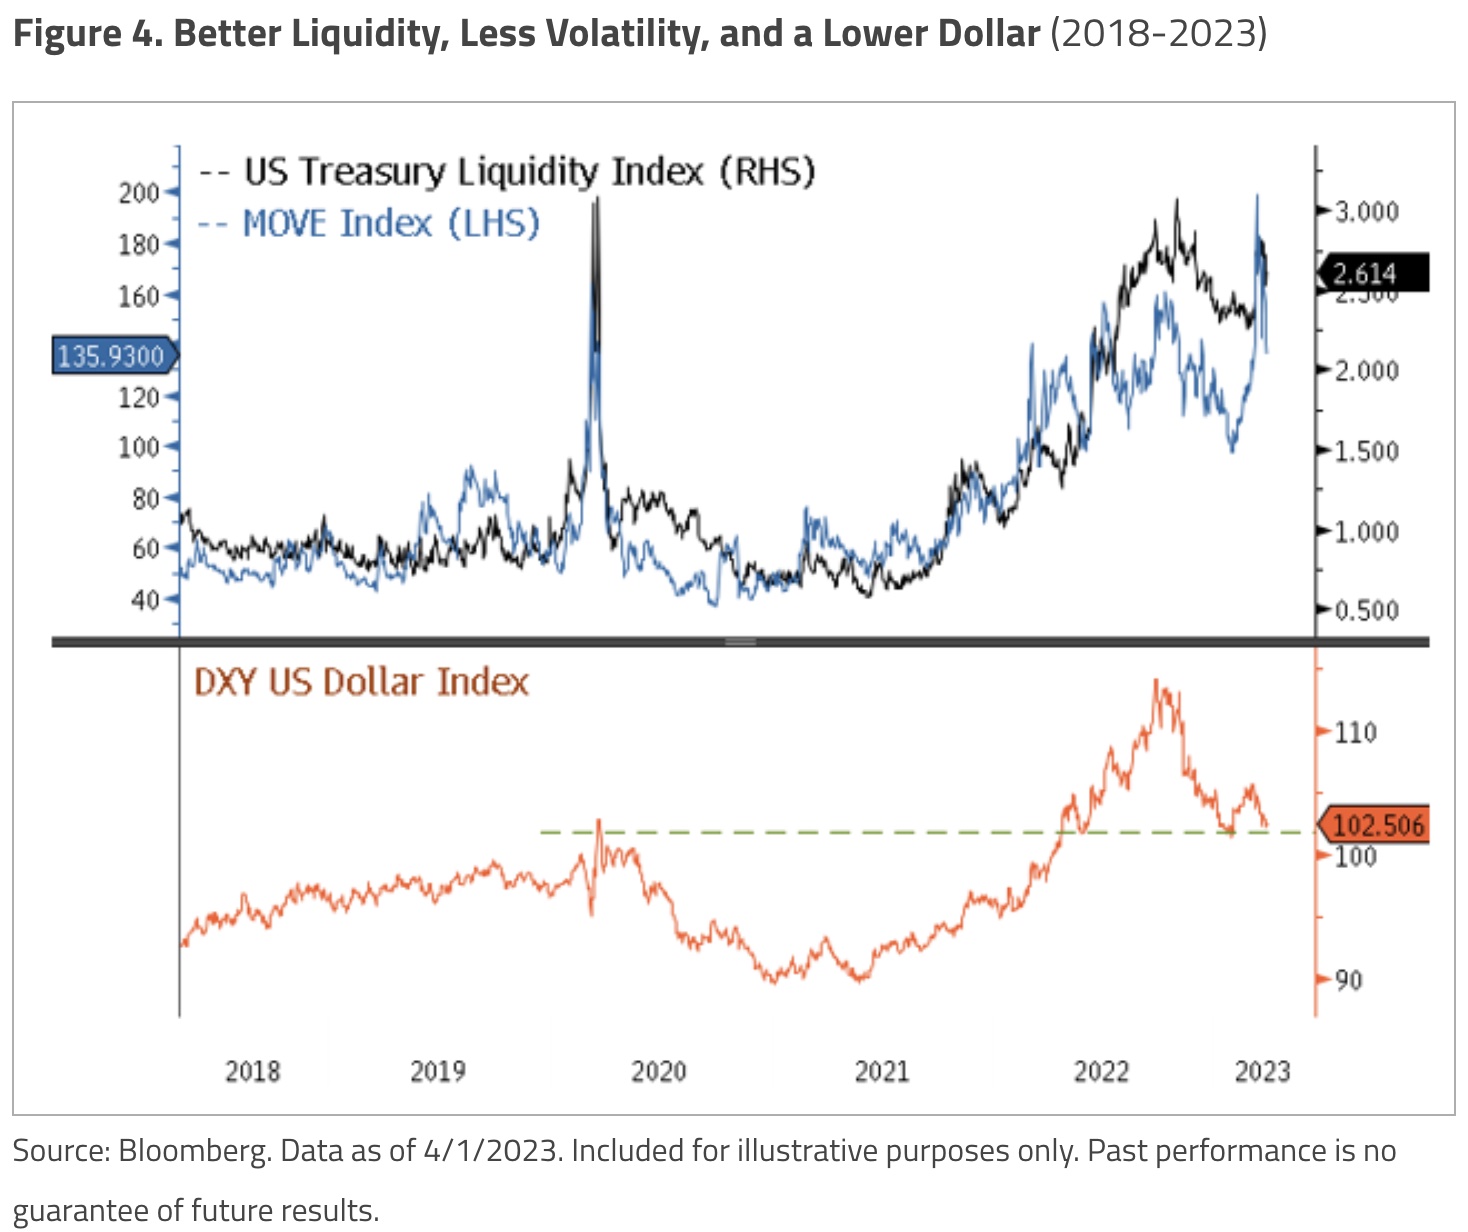
Reason C. Treasury Liquidity and Volatility Improve, U.S. Dollar Declines
As bond yields rose in Q1 2023 toward the highs of Q4 2022, the U.S. Treasury Liquidity Index and the MOVE Index worsened to Q4 2022 levels when the Treasury market malfunctioned. However, the U.S. Dollar Index (DXY) broke lower due to the Fed’s intervention (see Figure 4). To stabilize the banking crisis, the Fed opened a new facility — the bank term funding program (BTFP) — and reopened USD swap lines, effectively preventing the USD from climbing higher despite liquidity stresses. These actions may be a precursor to the Fed abandoning its 2% inflation target in the future. Since the BTFP and USD swap lines already provide a roundabout way of capping yields and lowering the U.S. dollar, the net effect would be higher inflation.
The last days of March saw an improvement in Treasury liquidity functioning and the MOVE Index. The DXY, however, appears close to making a significant top (lower panel of Figure 4). A combination of a decline in the U.S. dollar, real yields retracting across the curve and higher inflation would provide a powerful tailwind for gold. The strength of this tailwind is likely to be determined by policymakers and geopolitics.
Reason D. Secular Bond-Equity Correlation Turns Positive
From the early 2000s until 2022, equities and bonds were negatively correlated — an unusually long period for this to occur. For the past 20 years, investors have been able to build a diversified portfolio with only two asset classes, bonds and equities. The 60/40 portfolio has been the bedrock of asset allocation for an entire generation.
We believe we are in the early stages of the equity-bond correlation reverting to its historical norm (see Figure 5). The breakout in inflation has flipped this correlation from negative to positive (see our “2023 Top 10 Watch List” for a discussion of the key primary macro reasons for this). Without a negative correlation between bonds and equities, a pure 60/40 equity-bond portfolio is no longer well-diversified. Other low-correlation asset classes, such as gold and commodities, must be added to achieve the benefits of diversification, including potentially reduced risk and more stable returns over time.

The Banking Crisis: Canary in the Coal Mine?
The Long Road to Crisis
In the past year, the Fed has hiked rates by 4.50% and shrunk its balance sheet by $600 billion to bring down inflation. Despite these efforts, the economy remains stubbornly robust, with unemployment at a 50-year low and inflation still too hot. This situation is nearly a mirror image of the 2010s when the Fed’s aggressively dovish monetary policy could not lift economic growth and inflation.
The U.S. banking crisis (and the UK’s crisis last autumn with liability-driven investment [LDI] pension funds) are byproducts of risks accumulated over the past several years from extremely easy monetary policy. These risks have now been exposed by tight money. Buying long-term, higher-yielding instruments funded with short-term money (i.e., a carry trade) does not work in a steep yield curve inversion (when short rates go higher than long rates). These carry trades were developed during the period of cheap money when the Fed—via quantitative easing — pushed many investors to seek yield in a low-yield environment through various forms of the carry trade.
The long and varied lag of monetary policy has finally arrived. The Fed’s tightening cycle is now endangering financial stability but is insufficient to slow inflation unless the situation morphs into a severe financial meltdown. While banking stress and tighter lending standards may do some inflation-fighting work for the Fed, contracting credit and banking stress will likely act as a disinflationary impulse or a de facto rate cut. However, this is a risky path…
ALERT:
Legendary investors are buying share of a company very few people know about. To find out which company CLICK HERE OR ON THE IMAGE BELOW.
 Sponsored
Bank runs (i.e., pulling deposits from smaller banks and putting them into larger banks or Treasury bills) signify a crisis of confidence. Backstops from the Fed and U.S. Treasury and promises of future backstops are effectively a guarantee for all uninsured deposits. Along with stricter banking rules, future enhanced deposit insurance or universal deposit guarantees look likely, but it is impossible to bail out every carry trade.
To help backstop the regional banks, the Fed created its new BTFP facility to reduce the risk caused by unrealized losses on Treasuries and mortgage-backed securities (MBS) on bank balance sheets. Using the BTFP, banks can pledge their holdings of Treasuries, MBS and other “qualifying assets” as collateral for cash at par (which has the indirect effect of capping yields). Along with the BTFP, the Fed opened its discount window and set up USD swap lines with five other central banks, which in effect caps the U.S. dollar.
Fight Inflation or Fight the Banking Crisis?
The Fed is in a bind. Easing banking stress will likely accelerate inflation, while further tightening monetary policy to stop inflation will increase banking stress and the risk of recession. In the short term, the banking crisis takes precedence over fighting inflation. Credit collapses are extremely difficult to control once they get started because credit is a byproduct of confidence in the future. USD swap lines and heavy use of the discount window are wildly inconsistent with ongoing rate hikes and quantitative tightening, so the market is pricing in the end of these measures…
ALERT:
Powerhouse merger caught Rio Tinto’s attention and created a huge opportunity in the junior gold & silver space CLICK HERE OR ON THE IMAGE BELOW TO LEARN MORE.

The data indicate that aggressive rate hikes have not done much to curb inflation, at least not yet. Most of the year-over-year slowing is due to reduced pressure on the supply chain, normalization of inflation on the goods side and base factors, all of which are non-monetary effects. However, inflation has entrenched itself in the services side of the economy, especially in wages. The 2‒10-year Treasury yield curve had its largest re-steepening since 2008, indicating the increased probability of a recession one to one-and-a-half years out based on historical patterns.
The prior decades of disinflation driven mainly by globalization, demographics and technology-led productivity have created a false sense of security in monetary policy’s ability to control inflation. Perhaps Dallas Fed president Lorie Logan said it best: “The U.S. financial system is becoming increasingly vulnerable to core market dysfunction because the supply of intermediation has not kept pace with demand as Treasury market size and complexity have grown.”
Gold Bull Factors Take the Lead
Gold is approaching the upper end of its recent trading range. Physical buying by central banks and sovereigns is at a decades-high pace, while investment funds appear to have been caught flat-footed. The banking crisis arrived with such speed that policymakers had to react quickly with new facilities and swap lines to contain the possibility of further financial contagion. In doing so, however, they sacrificed the inflation fight by forcing down bond yields and the U.S. dollar. As a result, many significant long-term bullish macro factors for gold have become stronger, while some shorter-term cyclical gold bearish factors have faded.
ALSO JUST RELEASED: This Will Be The Next Major Upside Catalyst For Gold CLICK HERE.
ALSO JUST RELEASED: Gold Has Been On A Tear But Look At What Is Massively Undervalued vs The Metal Of Kings CLICK HERE.
ALSO JUST RELEASED: Celente – China’s Rising Power Threatens Dollar But Also The IMF And World Bank CLICK HERE.
ALSO JUST RELEASED: GOLD & SILVER BEING UNLEASHED: Gold Price $30 From Hitting 5,000 Year High CLICK HERE.
ALSO RELEASED: Gold Approaching Massive Cup & Handle Breakout, Plus Look At This Inflation Catalyst CLICK HERE.
ALSO RELEASED: Gold Surges Above $2,000 Ahead Of The Collapse Of The Super Bubble CLICK HERE.
ALSO RELEASED: Greyerz Just Warned The Everything Collapse Is Going To Devastate The World CLICK HERE.
© 2023 by King World News®. All Rights Reserved. This material may not be published, broadcast, rewritten, or redistributed. However, linking directly to the articles is permitted and encouraged.


