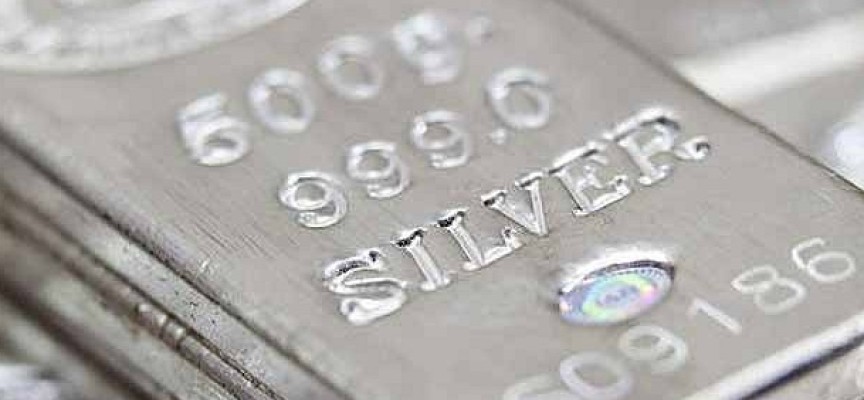
2022 will be the year silver hits new all-time highs. Meaning things are about to radically change in the silver market.
March 14 (King World News) – James Turk: Silver continues to underperform gold, Eric, but I think that is about to change. It may happen as soon as this week after the Federal Reserve announces its a half-hearted effort to control inflation by raising interest rates only .25% or .50%.
Based on Friday’s closing prices, it took 76 ounces of silver to equal the dollar value of one ounce of gold. That ratio is high based on historical results.
When the dollar was defined as a weight of gold under the gold standard, the Mint Act of 1837 valued silver to gold in dollar terms at 16-to-1. But when silver was removed from US coins in the 1960s, the ratio began to climb, as we can see on the following chart that shows the path of the ratio beginning with the collapse of the London Gold Pool in March 1968.
As the demand for silver in coinage declined, the ratio began to rise in the 1970s. But with inflation beginning to soar, the ratio soon stabilized in the 30-to-40 range. People at that time were responding to the problems of dollar currency and in response moved their purchasing power out of dollars and into the precious metals. With inflation raging by the late 1970s, note how the ratio dropped and by 1980 again reached the 16-to-1 level, which leads to two important observations about the 1970s that carry a message for today.
First, as inflation worsened, people began recognizing that 35 ounces of silver did the same good things for you as one ounce of gold, which itself was getting strong demand. Rising gold and silver prices protect your purchasing power from the ravages of inflation arising from dollar debasement.
What’s more, physical precious metals held that purchasing power for you outside a banking system that was riddled with problems. In this way you avoided the counterparty risk that exists when your purchasing power is deposited in a financially weak bank. In the late 1970s, many banks were impaired, like today. Banks become weak and vulnerable to a bank-run when they put customers’ deposits at risk by making too many loans that turn out to be unrepayable.
Second, at the 30-to-1 ratio prevailing in the 1970s, a growing number of people began to realize that silver was undervalued relative to gold, which itself was undervalued even though both metals were rising in price. It is a circumstance very similar to today, with silver’s relative undervaluation to gold apparent from their annual mine production.
I understand that geologists estimate that there is about 10-12 times more silver in the earth’s crust than gold. According to the U.S. Geological Survey, global output of gold and silver in 2021 was about 3,000 and 24,000 metric tonnes respectively. So by weight, 8 times more silver was mined than gold, which is less than one would expect given their relative availability of unmined ore. In other words, why wasn’t 10 or 12 times more silver mined than gold? The reason for this underproduction of silver is clear from the above chart of the ratio.
Things Are About To Radically Change In The Silver Market
The current ratio is 76. Silver is not being mined to the extent possible because its price is too low. Silver is so undervalued at current prices, production is curtailed because it is hard for silver mining companies to make a profit. That is about to change to the benefit of silver mining companies. It’s time to dust off this old silver chart, Eric.
We’ve spoken about this multi-decade cup-and handle pattern several times over the years as we watched it develop. When I was writing my newsletter, I began following the pattern in this chart back in the early 1990s when silver was under $5, which you will recall is when Warren Buffett reportedly started accumulating a silver hoard that eventually reached 130 million ounces.
As we can see on the ratio chart, the early 1990s was also a time when it took about 100 ounces of silver to equal the dollar value of one ounce of gold. With the onset of the pandemic that roiled many markets, silver again touched and briefly exceeded 100-to-1 and fell to $11.75 in March 2020, highlighting its extreme undervaluation.
That moment is now behind us, but the important point is that silver is still good value. The ratio is now at a level similar to the early 1990s when an unrivaled value investor, Warren Buffett, was buying it.
Silver’s Bull Market Begins When It Breaks $50
I have mentioned several times over the years that silver’s bull market does not begin until its price exceeds $50, the 1980 high. I remember that peak well. It was a time of wild speculation about the future of the dollar because inflation was running rampant.
It then took 31 years of distribution and subsequent accumulation for silver to again reach $50. That’s the cup pattern in the above chart. Over the last 11 years, we’ve seen a repeat of distribution from weak hands and what is now ongoing accumulation of physical metal by strong hands that are forming a “handle” on the silver “cup”…
To find out which silver company just made a major acquisition that will
quadruple their production click here or on the image below

The chart pattern completes when silver again touches $50, which has far less purchasing power now than it did 42 years ago and is another indication of how undervalued silver is today. What’s more, while silver remains popular for use in coinage, over the last four decades new applications for silver have been developed in areas ranging from medical to ‘green’ energy. So these new demands for silver are competing with silver’s traditional role in coinage, the demand for which is rising because of inflation.
Today silver is in strong hands. Even the 2020 pandemic shakeout could not dislodge much if any physical silver from these strong hands, as evidenced by the “V” bottom formed during that brief shakeout. That price drop was a temporary event, with little if anything to do with silver’s underlying fundamental factors that were then and still remain bullish. The rise in silver’s price since then brings us to the present, which to me looks very much like the late 1970s but even better. The early 1990s when silver was even more undervalued and Warren Buffett was buying.
2022 Will Be The Year Silver Breaks Above $50
Given silver’s exceptional undervaluation, Eric, it appears to me that 2022 will be the year that silver completes the handle on this chart pattern by doubling in price from here. More importantly, 2022 is setting up to be the year that silver finally breaks above $50 per ounce to join the soaring prices we are seeing in so many other commodities because the dollar is being so badly debased.
Inflation is poised to worsen in the weeks and months ahead for two reasons. First, the Federal Reserve created this growing inflation problem by creating ‘out of thin air’ too much dollar currency. Second, any rate increase they announce will do little to put inflation-adjusted interest rates back where they belong — in positive territory. We need to prepare for any onslaught and history shows us that one of the best ways to do that is owning physical gold and physical silver to protect your purchasing power.
Therefore, my assessment is that both silver and gold are poised to make new record highs this year. And for this week, any pullbacks in price as the Federal Reserve announces its interest rate increase should be viewed as an opportunity to buy physical gold and physical silver.
ALSO RELEASED: War In Ukraine Or Not, Gold Will Dramatically Outperform Financial Assets CLICK HERE.
To listen to Egon von Greyerz discuss what investors should expect in a world gone mad CLICK HERE OR ON THE IMAGE BELOW.
To listen to Alasdair Macleod discuss what investors should expect in a world gone mad CLICK HERE OR ON THE IMAGE BELOW.
© 2022 by King World News®. All Rights Reserved. This material may not be published, broadcast, rewritten, or redistributed. However, linking directly to the articles is permitted and encouraged.


