

There seem to be more gold and silver bull catalysts emerging on a daily basis. Take a look…
ANOTHER INFLATION CATALYST: Copper Waking Up
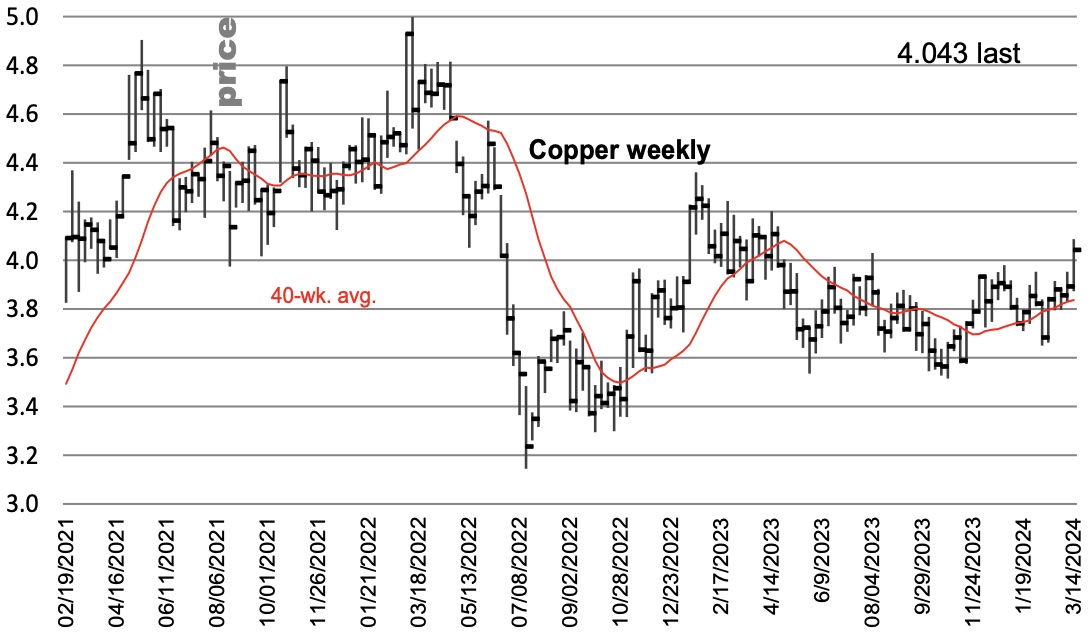
March 15 (King World News) – Michael Oliver, Founder Of MSA Research: A breakout is underway. As is the case with most markets, there are also other breakout levels to be noted that will add to the upward dynamics.
The upper horizontal line goes back to late 2021. Close any week in the next few weeks at $4.27 and that level will in turn be broken out above.
Copper’s Textbook Upside Breakout
Annual momentum is ripe for upturn as well.
Note the momentum action before the prior sharp upturns in copper: multi- point downtrends.
Copper Exploded Higher Once Eclipsing (RED) Dotted Momentum Lines
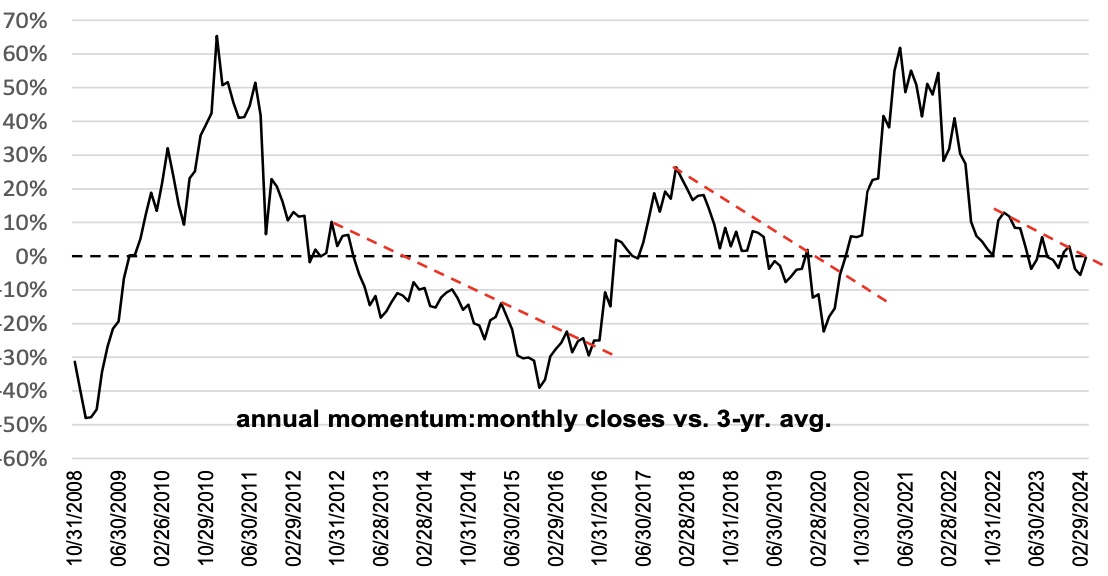
What we want to see is a monthly close above the multi-point downtrend but also above the last peak close along it. Closing any month this year at $4.1820 would accomplish that.
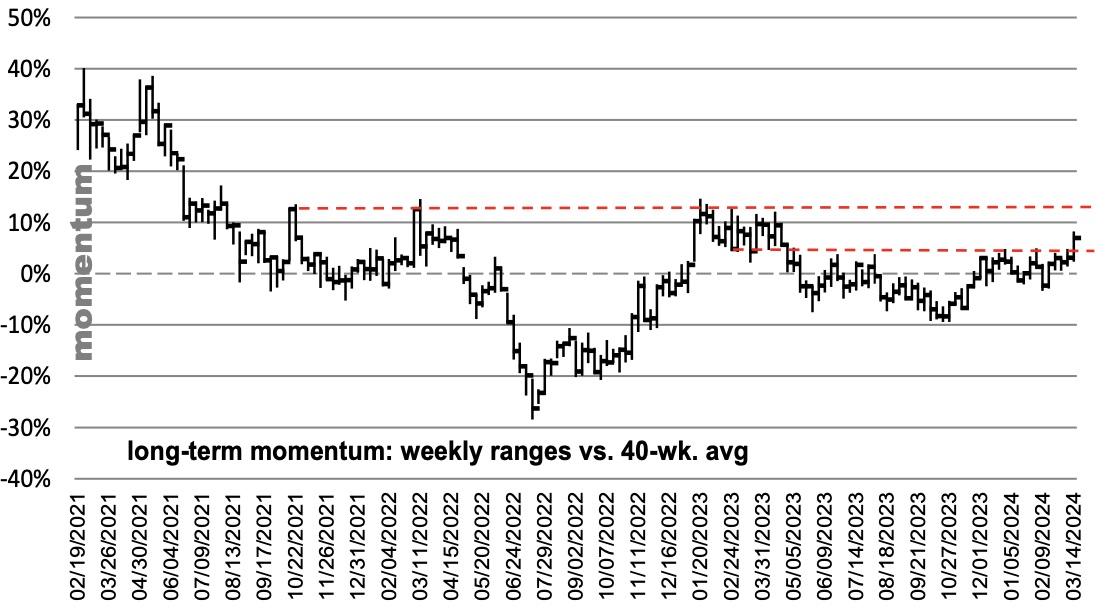
That means this annual momentum chart, though a longer-term metric than the 40-wk., will break out before that second level breakout noted on the 40- wk. oscillator.
Copper’s Final Upside Momentum Breakout (RED) Dotted Line
Inflation And A Trapped Fed
King World News note: More inflation puts the Fed in a very difficult position. Will they raise rates into inflation? We will see. Right now the Fed funds rate has 3 rate cuts priced in for 2024…
In Times Of Increased Uncertainty
First, The Problem: An Undeniable Currency/Wealth Crisis & Transformation.
Fiat currencies are openly entering the last chapters of their once illusory but now steadily declining purchasing power and global credibility. La plus ça change…
This slow and steady spiral of fiat currency strength and the consequent risk of wealth destruction is nothing new. In fact, all debt-soaked systems throughout history have ended with a debased and then broken fiat currency. This is true without exception—from Ancient Rome to the Modern West.
Today’s global currencies are empirically following the same familiar pattern. In a global setting of unprecedented (and rising) debt levels which have risen from $258 trillion in 2020 to well over $330 trillion by 2022, etc. 2023, etc. 2024…
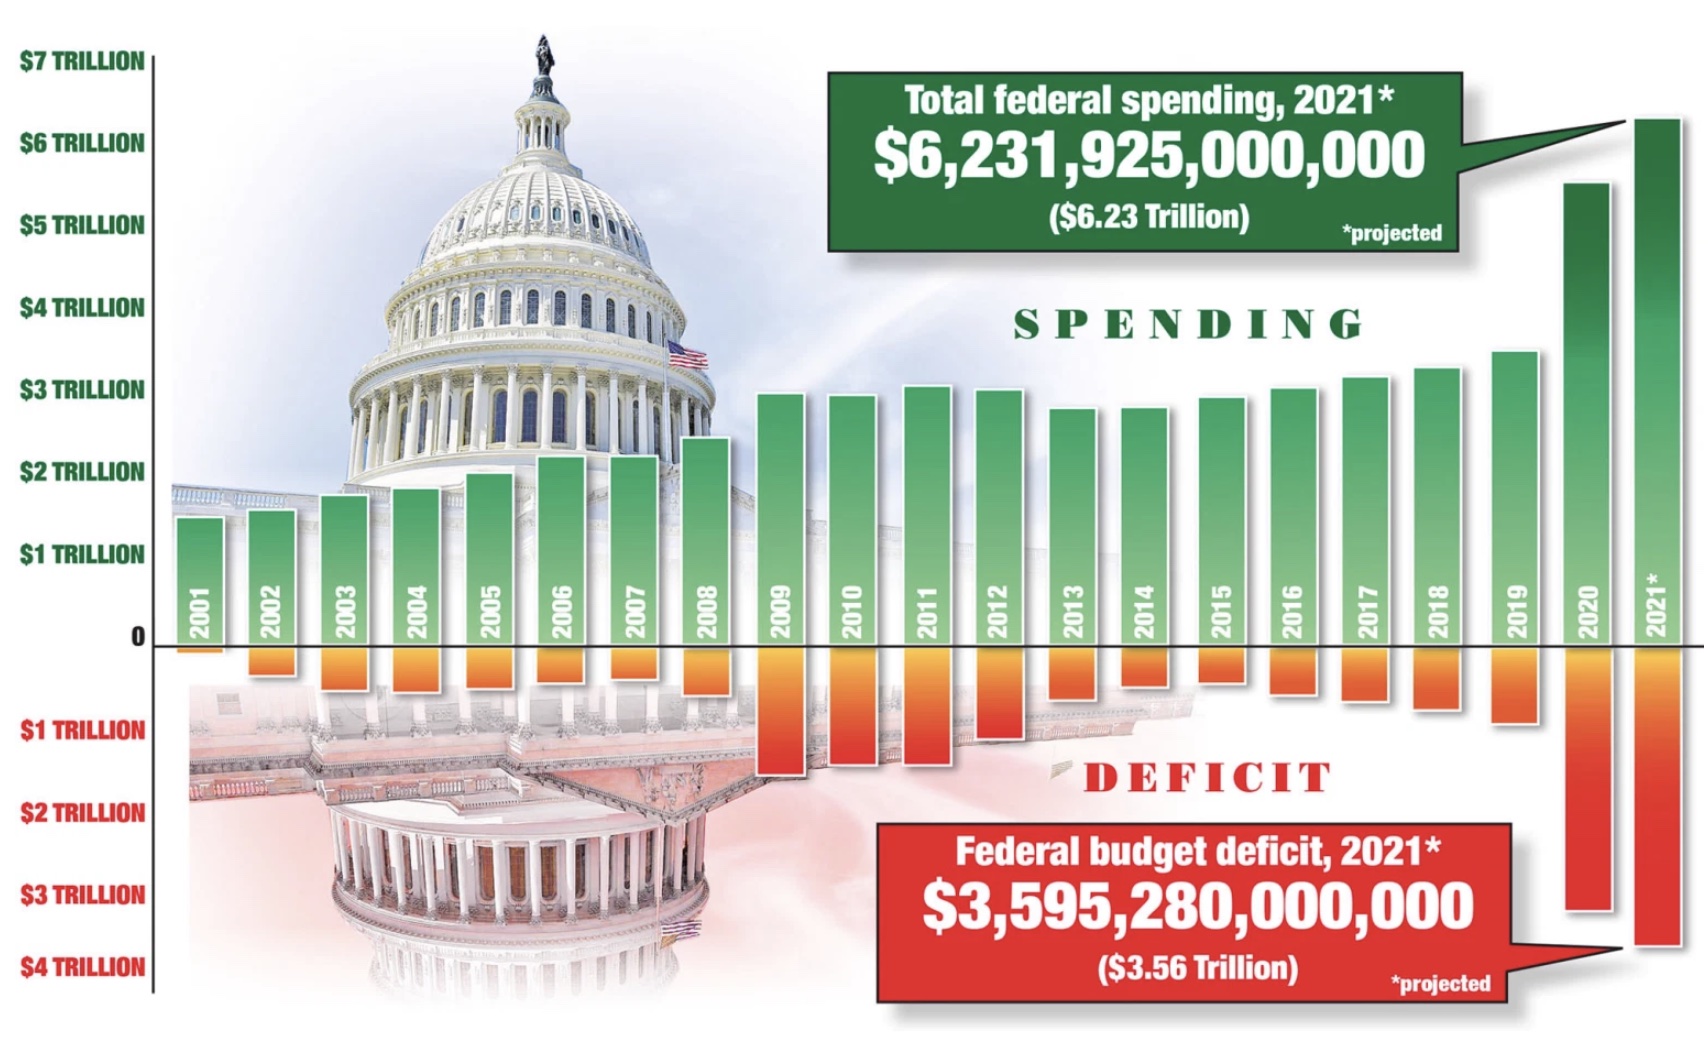
Out Of Control Spending:
The US Portion Alone Is Trillions
In early 2002, this legend made major investments for himself, his family a his group of investors into physical gold when the price was $300 per ounce.
His company is now the world leader for direct investor ownership of physical gold and silver outside of the banking system. It is also the industry leader in wealth preservation through precious metals for HNW clients in over 90 countries seeking private and unencumbered ownership of their assets outside of a fractured commercial banking system.

To listen to this amazing interview about the surge in the price of gold over $2,200 this week as well as the coming mania in the gold market, silver, inflation, and what to expect next CLICK HERE OR ON THE IMAGE ABOVE.
Sponsored
US DOLLAR INDEX: Yields Already Responding To Inflation
From Citi’s Naveen Nair: Even with an upside surprise in PPI on Thursday, the narrative in the US remains intact: labour markets are loosening, and with details of PPI likely to imply softer core PCE inflation, chances for the “goldilocks” scenario still remain firm.
We re-visit the techs charts for US 2 year, 10 year yields and DXY [US Dollar Index].
US 10y yields
In techs, 10y yields have bounced higher from the pivotal 55w MA support that we had highlighted. At the same time yields have broken above the 4.18%-4.20% resistance (Jan 19 high, Feb 15 low, 200d MA). Yields now look likely to test the strong resistance at 4.34% (YTD highs).
Strengthening US 10-Year Yields Helping Boost US Dollar Index
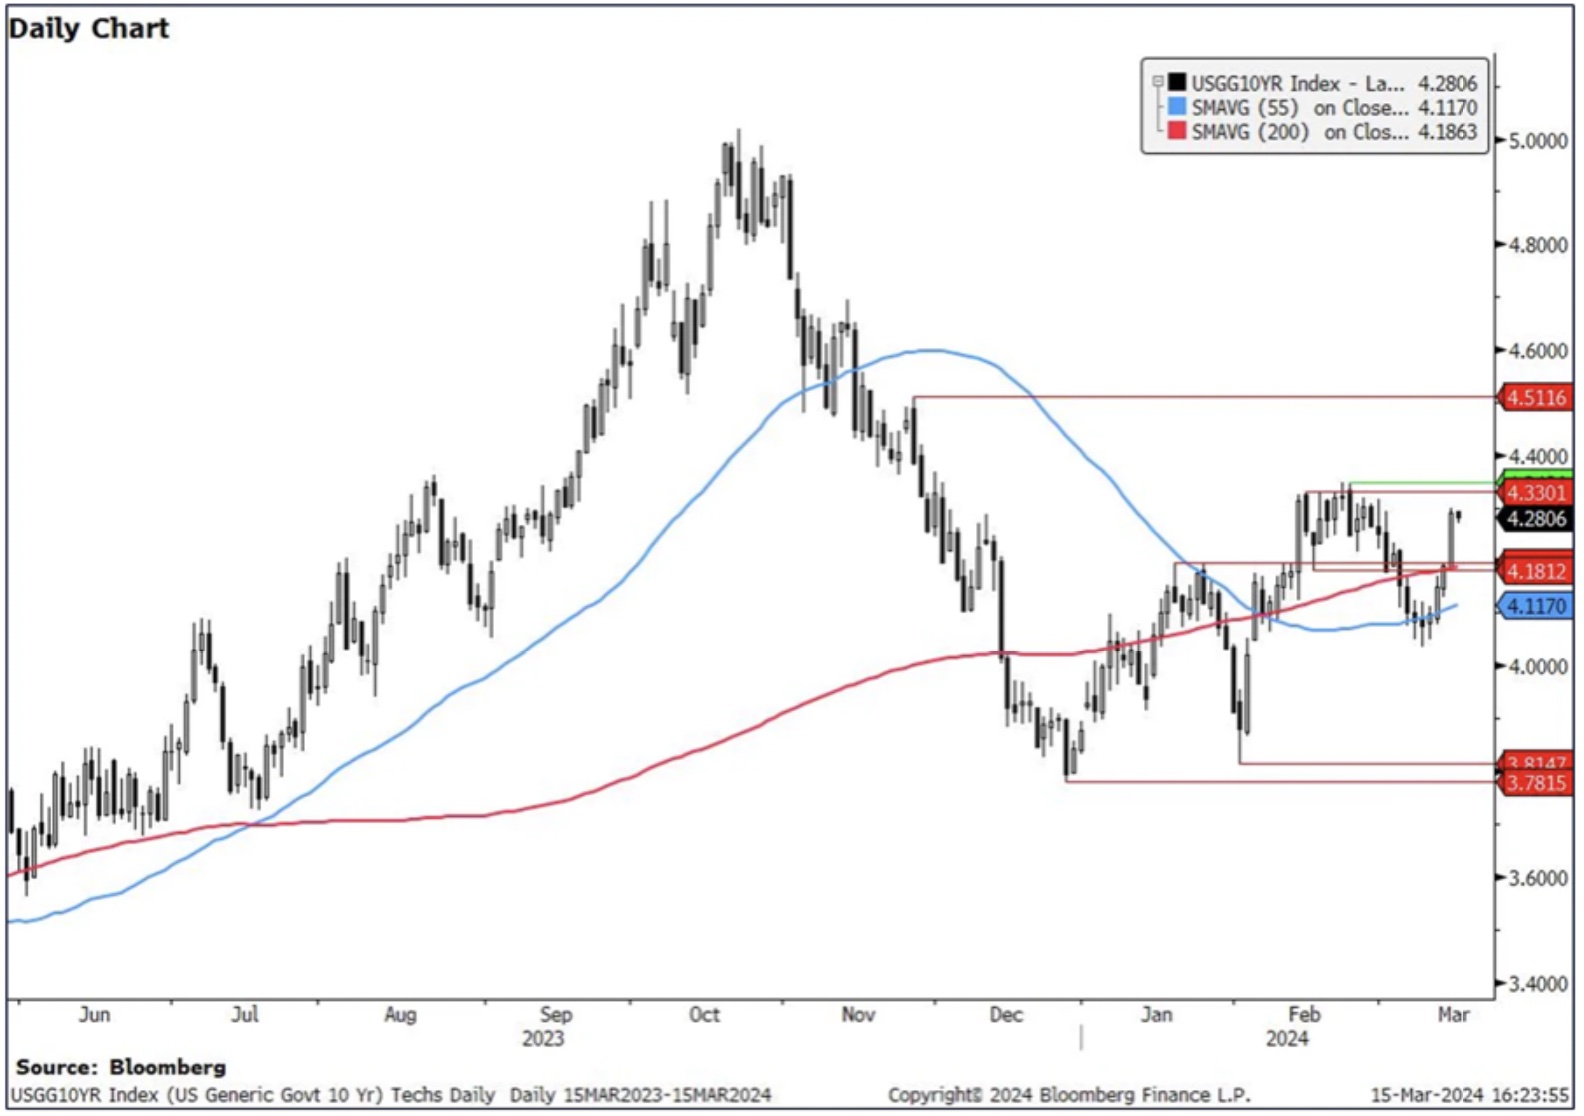
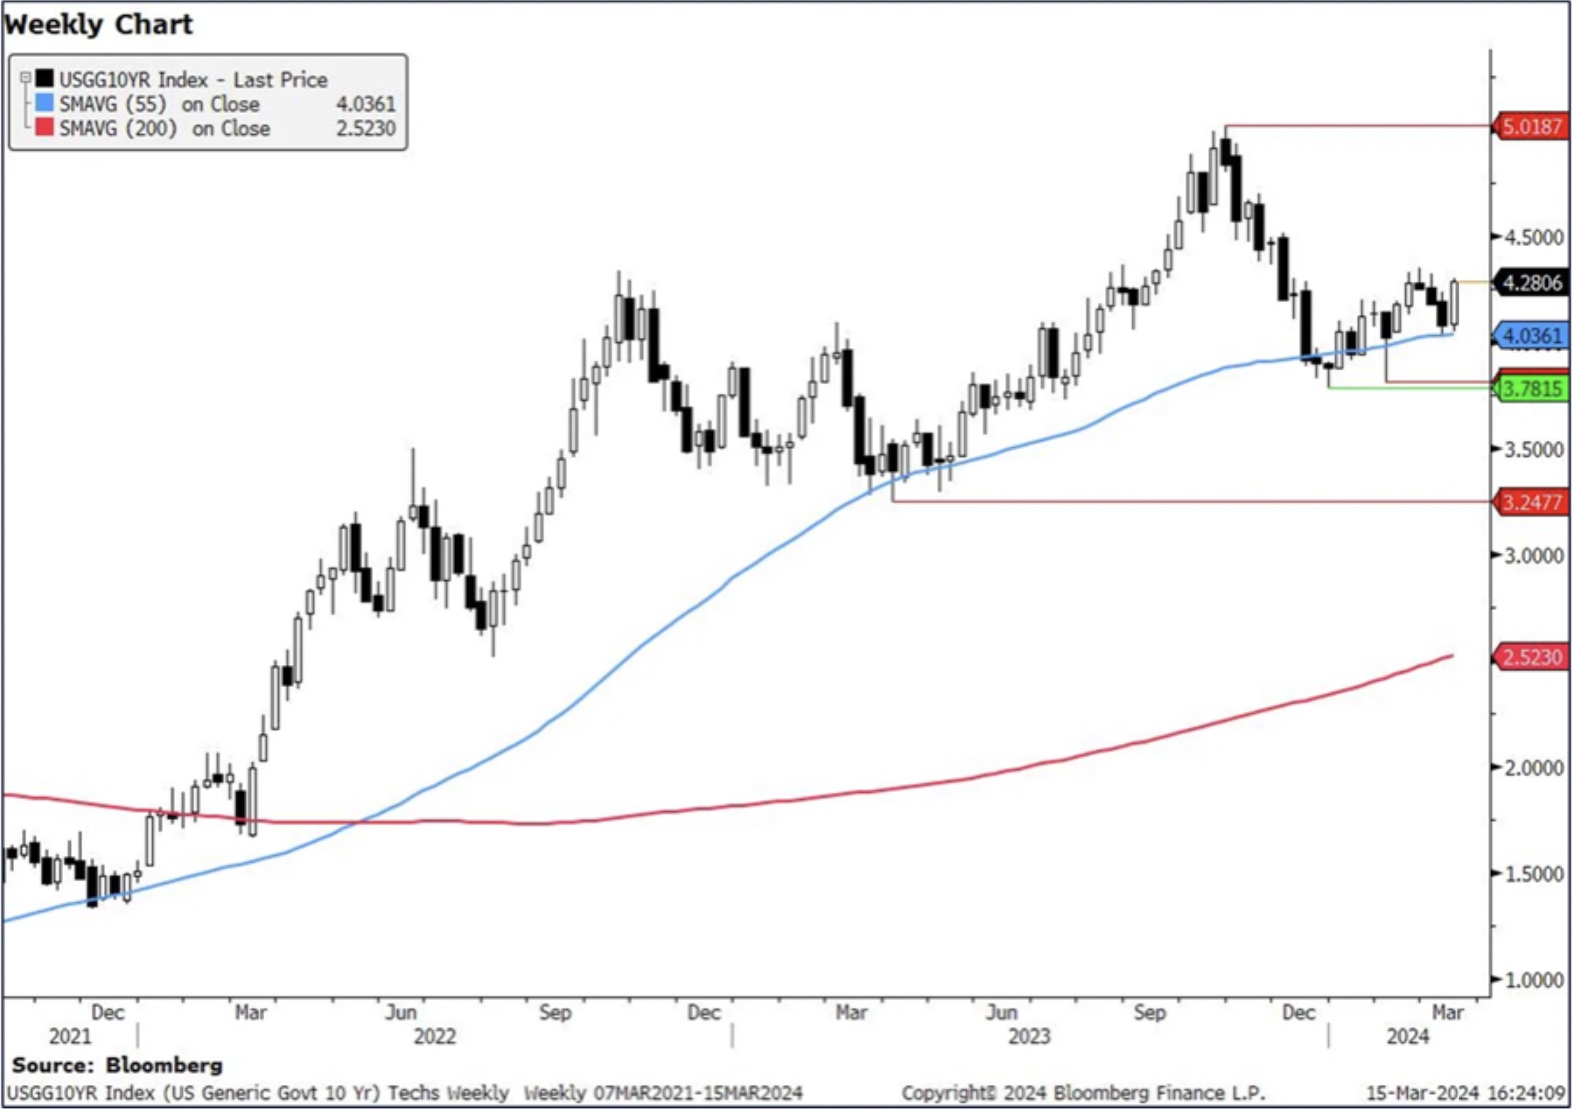
With both support and resistance strong, we think 10y yields will stick to the 4.03% (55w MA) – 4.34% (YTD highs) range in the near term.
Will The US 10-Year Yields Retest 5%?
US 2 Year Yields
Yields have firmly bounced off support at 4.42%-4.46% (55d MA, Jan 19 high). However, we are now coming close to very strong resistance at 4.74%-4.77% (200d MA, Feb high, Dec high).
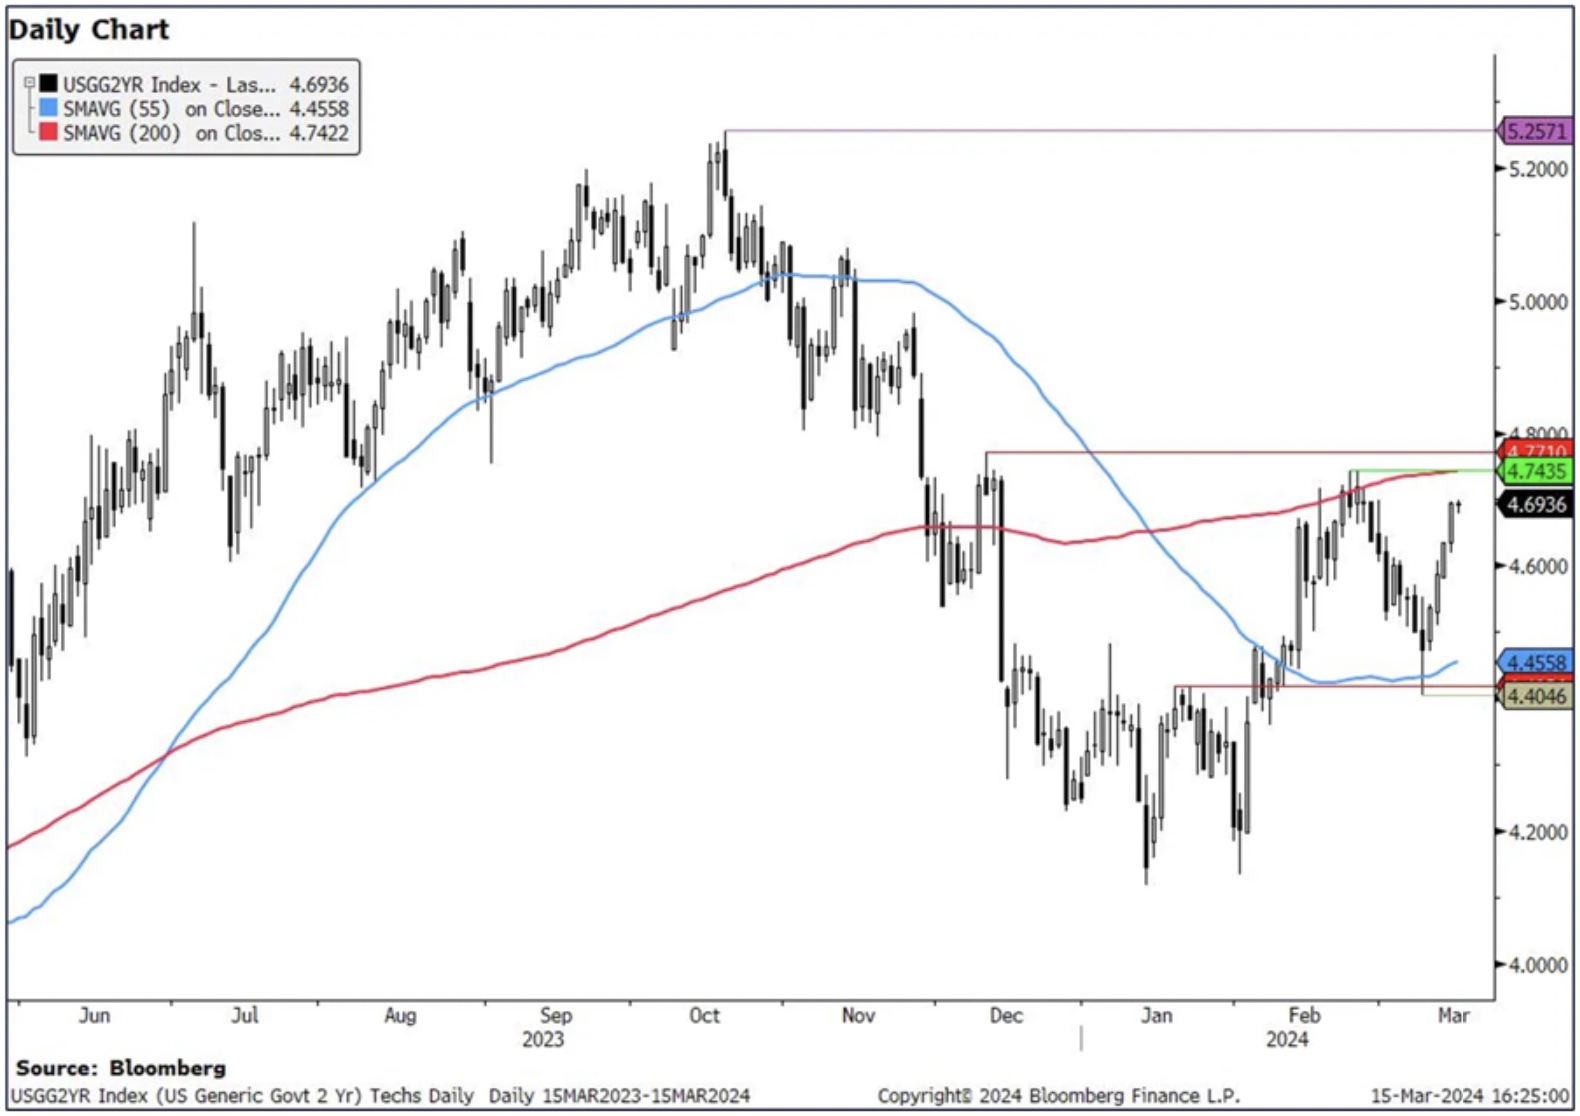
As a result, we think we are likely to hold this 4.42%-4.77% range in 2y yields.
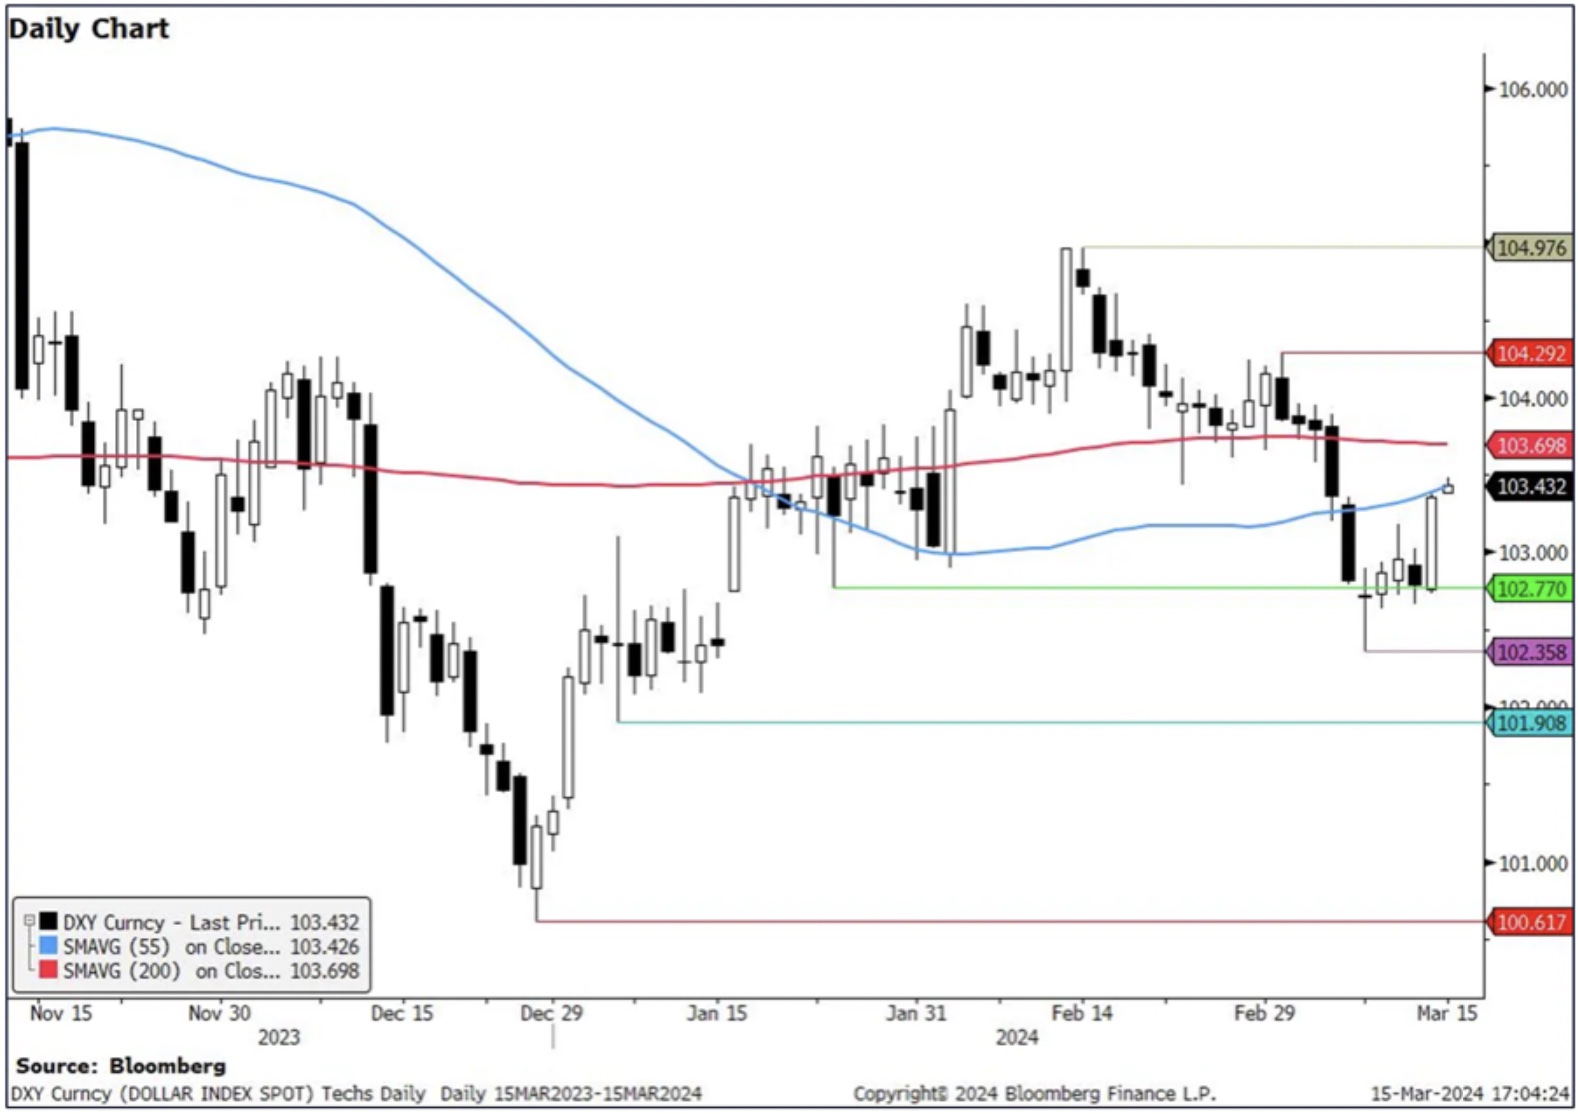
US Dollar Index
The rally post the PPI data means that we have bounced higher off the 102.77 support level (Jan 24 low), after closing below it marginally on a weekly basis. We are now testing the 55d MA resistance at 103.43, with 200d MA resistance just above at 103.70.
Meanwhile The US Dollar Index Has Been Rallying Along With Bond Yields
We retain a bias for a weaker dollar for two reasons: 1) we see a number of resistance levels limiting a rally in the dollar and 2) weekly momentum is fading, shown by the cross lower in weekly slow stochastics after touching overbought territory. First support remains at 102.77.
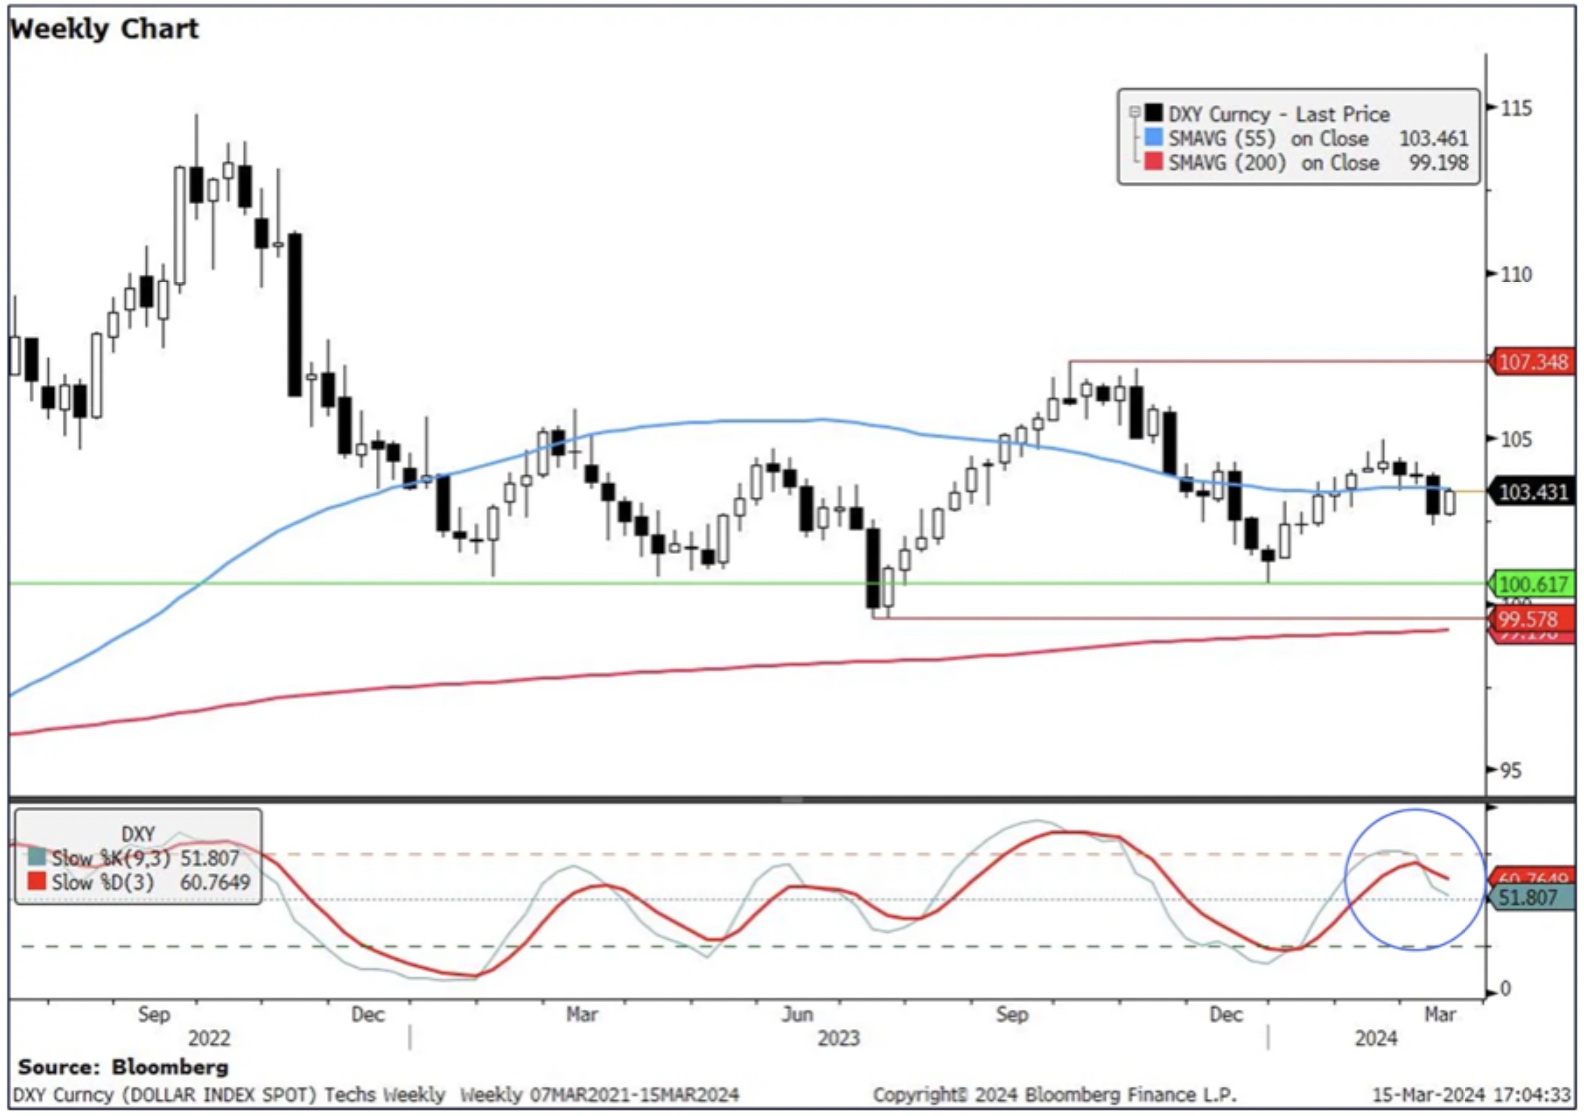
The “Wall Of Terror”
King World News note: With copper and other commodities heating up another inflation wave is on the way, and regardless of how the US dollar trades, this is going to add more fuel for the gold and silver bull markets to head higher. Silver is on the verge of a major breakout that will send the price into the high $30s followed by a move to new all-time highs above $50. In the meantime, the high-quality mining and exploration stocks continue to climb “a wall of terror.” Remain patient.
© 2024 by King World News®. All Rights Reserved. This material may not be published, broadcast, rewritten, or redistributed. However, linking directly to the articles is permitted and encouraged.


