

Today Michael Oliver, the man who is well known for his deadly accurate forecasts on stocks, bonds, and major markets, shared with King World News one of the most important charts of 2024. This chart is designed to get investors into a sector that is about to see radical upside gains.
One Of The Most Important Charts Of 2024
April 22 (King World News) – Michael Oliver, Founder of MSA Research: Miners’ underperformance ended in late 2015, coincident with the bear market price lows in gold and the miners. The miners have since rebounded and entered what can be called a par performance range of action vs. gold. Meaning it was just as positive to own miners since late 2015/early 2016 as it was to own gold. Hard to believe, but a fact. Yes, there were ebbs and flows in that range, and for the past three years a downside move from peak performance levels in 2021, but still within that “par” or sideways performance range.
The question is when and where do we mark an upturn from this multi-year-wide spread chart base? Just looking at the action since the peak in the mid-1990s, we can readily plot a three-point downtrend. It was bumped in 2021, and the action since, though glued to that trend line, has slid back down. It’s up- ticking now. Almost any further marginal gain will break it out over that trend line. Step one.
But after clearing the trend line, there’s also a clear set of highs that define the upper end of the past nine years of par action. Clear that and MSA argues that the spread could advance to the next and obvious resistance. That in itself is a massive performance move. We think that trend line factor is close to turning now.
ONE OF THE MOST IMPORTANT CHARTS OF 2024!
After Breaking Above Red Line, Miners Will Massively Outperform Gold.
A Move Back To 38% = Miners Outperforming Gold 8x!
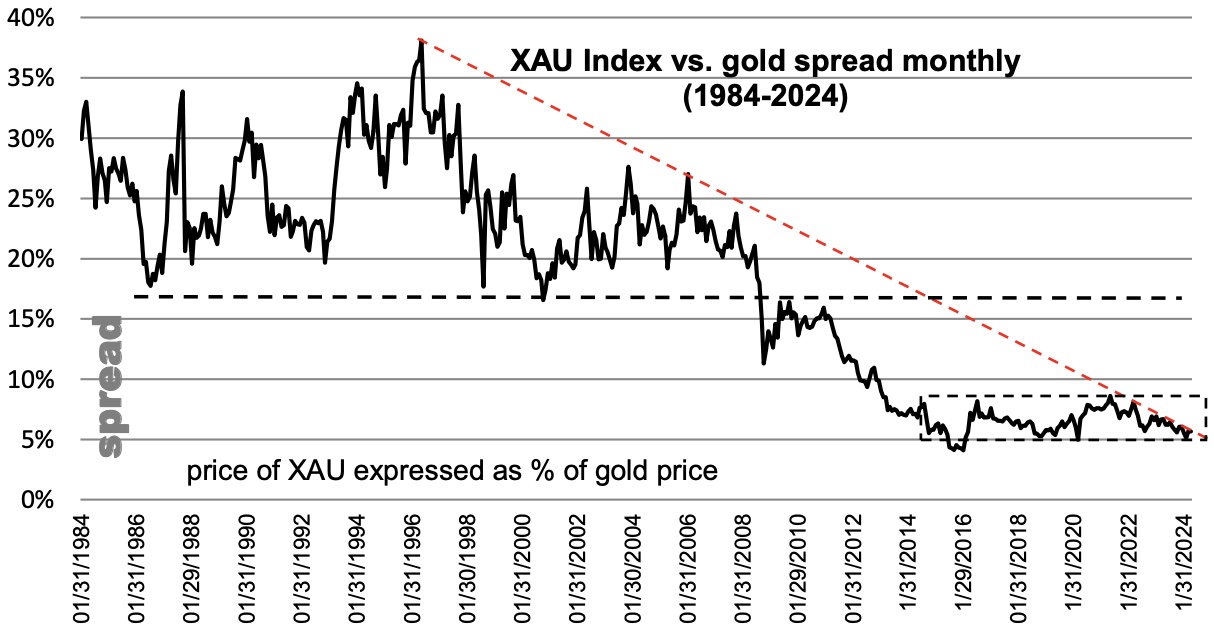
For XAU to close over the peak of that range it needs to close a month such that the spread is at 7.47% (XAU’s price expressed as a percent of gold’s). That will be the next major relative performance signal level to watch. The spread, up-ticking this month, is now at 5.68%.
When the spread closes over the upper end of the range, we expect to see it advance to its next and frankly only major resistance. Namely, the bottom end of the prior two decades of spread chart lows around 17%. Meaning the spread’s next resistance involves a tripling of its current value vs. gold. To read the rest of this important report, which has remarkable updates on gold, silver, mining stocks and so much more (12 pages long!) you must be a subscriber. To receive the special KWN discount to subscribe to Michael Oliver’s internationally acclaimed MSA Annual Research which is used by professionals and serious investors all over the world CLICK HERE.
Celente – $3,000 Gold In 2024
To listen to one of Gerald Celente’s most important interviews ever discussing his predictions for the price of gold and what other surprises to expect in 2024 CLICK HERE OR ON THE IMAGE BELOW.

China Has Stockpiled 30,000+ Tonnes Of Gold
To listen to Alasdair Macleod discuss China’s massive gold hoard as well as what to expect for the rest of 2024 CLICK HERE OR ON THE IMAGE BELOW.

© 2024 by King World News®. All Rights Reserved. This material may not be published, broadcast, rewritten, or redistributed. However, linking directly to the articles is permitted and encouraged.


