Today Michael Oliver, the man who is well known for his deadly accurate forecasts on stocks, bonds, and major markets, communicated to King World News about gold’s parabolic phase and gold’s next key resistance level.
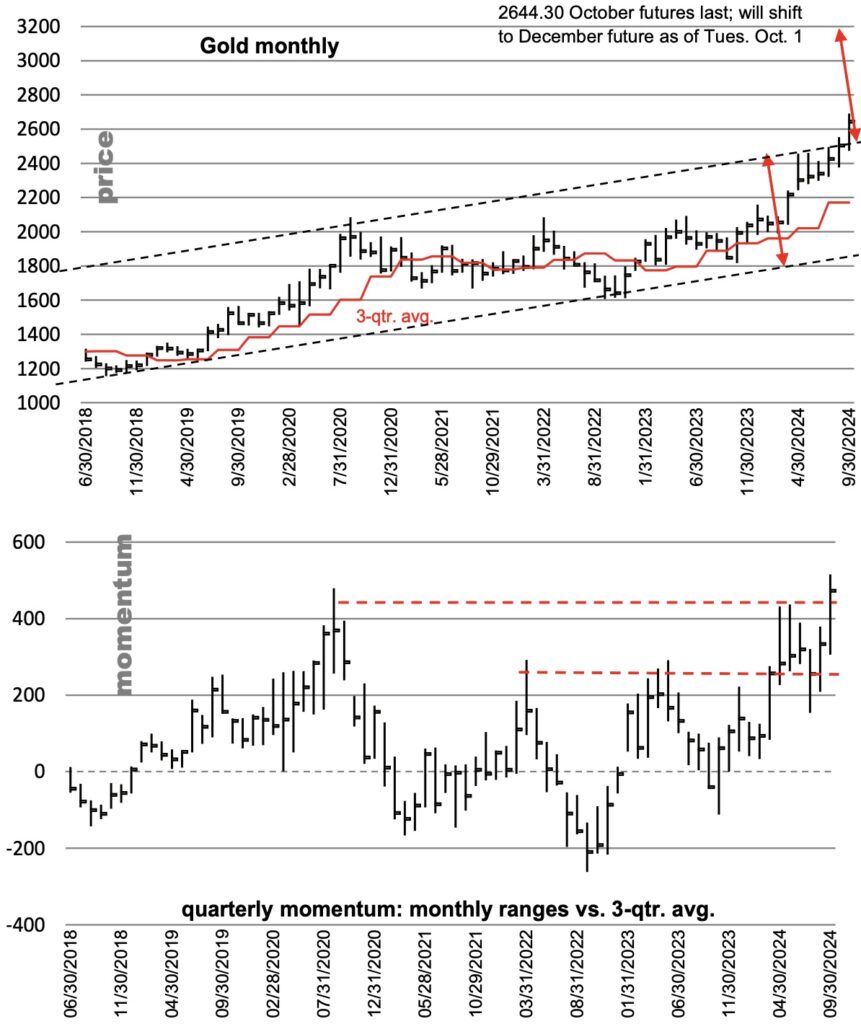
Gold: price channel analysis and quarterly momentum
September 30 (King World News) – Michael Oliver, Founder of MSA Research: Gold is headed a lot higher. Of that we have no doubt. But that could involve upside that persists well into next year or more. Our focus right now is this particular surge and where it might encounter a wobble worth calling one.
We realize, of course, that most gold bugs and “analysts” out there remain continual doubters. Every wobble along the way is a top or a “time to exit.” This syndrome has persisted during the nearly vertical action of the past year. Every time gold hiccups, “It’s over!” Jeez.
That’s fine with MSA, as it continues to indicate there’s no investor fever here despite the monetary metals rising and rising. Nice.
Here we’re primarily focusing on a price tool that I learned decades ago when at E.F. Hutton. Art Sklarew was a broker/forest product futures analyst (plywood and lumber futures were traded then) whom I met at Hutton’s International Commodity HQ down in Battery Park (NYC). He was developing price tools that he later collected in the book Techniques of a Professional Commodity Chart Analyst (available on Amazon). One of the tools he developed (and he was skeptical of many prevailing “technical” price chart notions) was parallel channel analysis.
In the case of the ongoing gold bull trend—and now the beginning of the vertical phase—channel analysis is very helpful and something MSA trusts.
The channel’s angle of ascent is defined by highs and lows from 2018 until recently. In August, marginally, and especially this month, price burst through that resistance level (the ascending channel top). Yes, annual momentum and 100-wk. momentum had told MSA way back in March that verticality was coming, and price joined in the past two months. And even this quarterly momentum chart had taken out two flat highs in late March and April and now all highs of past several years. The parallel channel top on price that had provided resistance from April to July this year has now been taken out. Now, if we take the size of that channel and swing it up, it suggests that next resistance is… You must subscribe to Michael Oliver’s MSA Annual Service to find out the next resistance level and read the other 7 pages of this important and timely report. MSA also lists individual mining stocks in their reports that they believe will significantly outperform the HUI Gold Mining Index. To receive the special KWN discount to subscribe to Michael Oliver’s internationally acclaimed MSA Annual Research and gain access to their research and stock picks CLICK HERE.
GOLD & SILVER: Just Released!
***To listen to Alasdair Macleod discuss the stunning things taking place behind the scenes in the gold and silver markets CLICK HERE OR ON THE IMAGE BELOW.
© 2024 by King World News®. All Rights Reserved. This material may not be published, broadcast, rewritten, or redistributed. However, linking directly to the articles is permitted and encouraged.


