

Today one of the greats in the business said gold and silver have a perfect setup after Friday’s orchestrated takedown.

Gold & Silver: Pullback To Perfect Setup
June 8 (King World News) – Matthew Piepenburg, partner at VON GREYERZ: With gold and silver having fallen by greater than 20% from their January highs of 2026, some have argued the gold trade is over. In fact, and as explained below, it is only just beginning.
Trading vs. Investing
Such misunderstandings are nothing new, as the difference between precious metal trading and precious metal investing is nothing new.
Nor is there anything new about top-down misinformation and misdirection given to Main Street when it comes to understanding gold and silver.
Traders, both skilled and unskilled, tend to track near-term signals for immediate rates of return (long or short) while longer-term investors typically watch history, debt cycles and currency debasement with patient detachment and a steady eye toward wealth preservation.
Such patience has served the longer-term, wealth-preservation-focused investors with greater returns (and calm) through periods of headline flux and geopolitical gyrations.
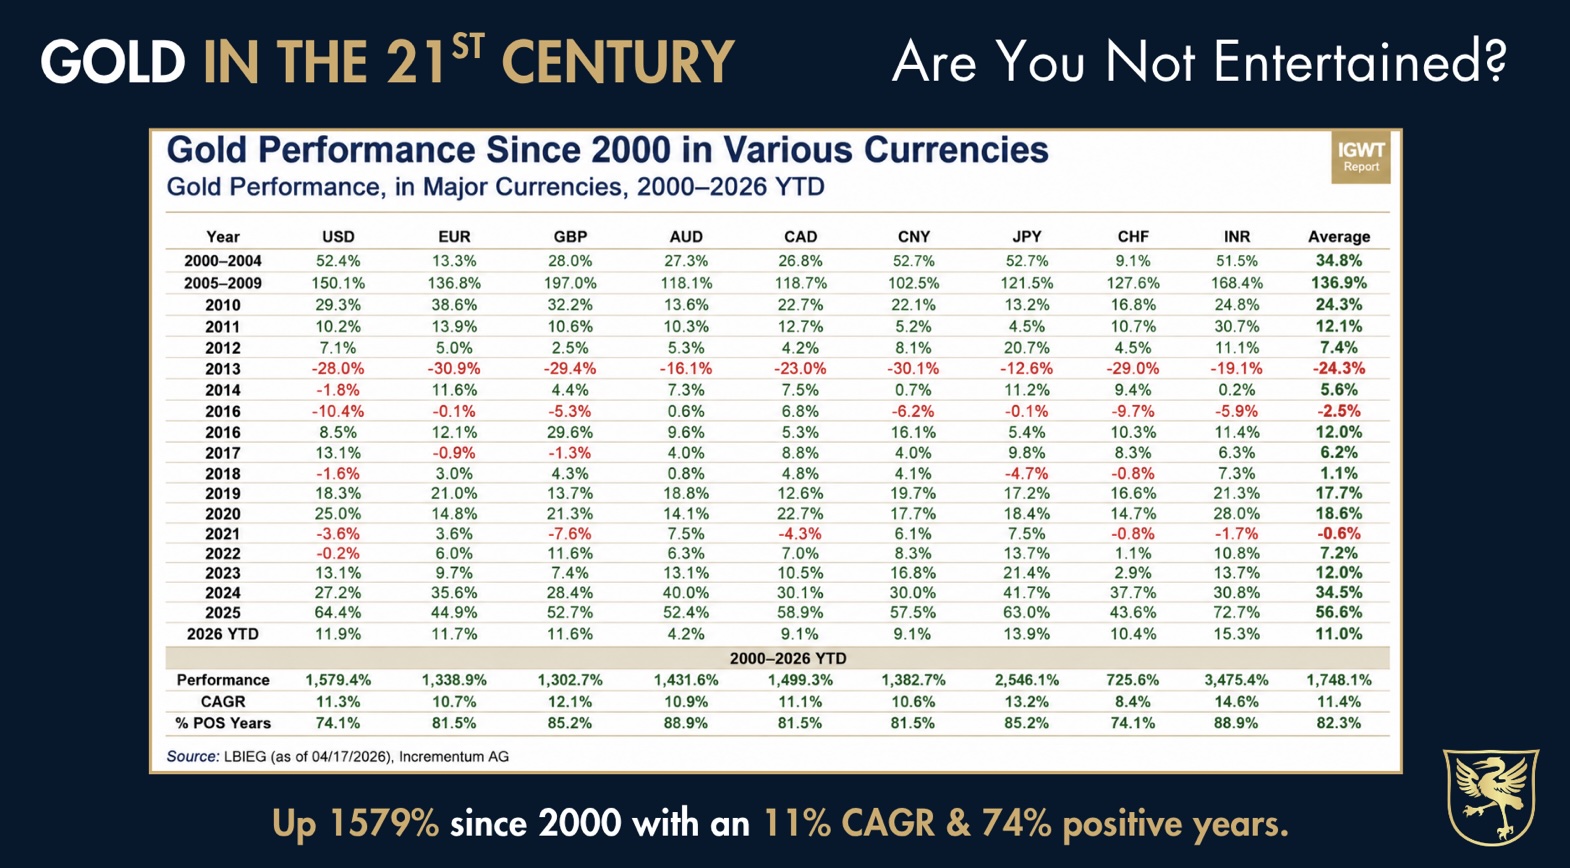
Since 2000, gold has outperformed the S&P, and when compared against the major global paper currencies (down 94% since 2000), gold (up 1580% since 2000) has demonstrably outperformed fiat “money.”
Longer-term investors see this larger picture and trend.
They don’t book losses in pullbacks because they understand the greater direction of the precious metal ball in a debt-saturated and hence currency-debasement playing field.
Comfort in Historical Fundamentals
In short, the fundamentals of history, economics and hence currency debasement confirm a clear pattern by desperately broke(n) nations to inflate their way out of debt at the expense of their currencies.
This makes the longer, anti-fiat direction for gold and silver almost too obvious, even in times of inevitable price retracements in the metals.
Historical cycles and longer-term calm, however, are easily forgotten or ignored in times of crisis. Investors somehow think “this time is different,” or, even worse, they don’t think about history at all.
Patterns: From Crisis to Gold Highs
But for those looking for signals, as well as sanity confirmation, it’s worth remembering that in every prior geopolitical and/or oil crisis (the OPEC embargo of 73, the Iranian Revolution of 79, the Gulf War of 91, the 9-11 disaster of 2001 or, more recently, the Ukraine/Russia crisis of 2022) there are clear patterns eerily similar to the current crisis surrounding the Iranian “conflict.”
Specifically, we are living within a template by which a geopolitical crisis sends the oil price up, which is followed by a rise in “inflation expectations,” which in turn means central banks like the Fed can’t cut rates, and soon thereafter the market, rather than central bankers, sets the rates.
This explains why yields on the US 10Y Treasury Bond (the true cost of Uncle Sam’s hideous bar tab) have risen by 75 basis points despite no active rate hikes by a Fed which couldn’t afford rate hikes even if they wanted them.
In this same template, as yields rise, investors typically follow the street’s traditional (yet now grossly mistaken) view that a yielding bond (from a broke issuer) is still better than a yield-less bar of gold.
What typically follows is a herd-like move to bonds whose “positive” nominal yields are measured in increasingly debased currencies and negative real returns when measured against actual rather than mis-reported inflation…
Listen to the greatest Egon von Greyerz audio interview ever
by CLICKING HERE OR ON THE IMAGE BELOW.

The ironies do abound…
But what fifty years of crisis patterns have also told us—at least for those paying attention—is that gold tends to drop early in every crisis only to then recover at newer all-time-highs as the crisis plays out.
During the 1973 OPEC embargo, for example, gold would dip and then participate in an historical, 4-digit upside in the seven years that followed.
After a temporary retracement during the 1979 Iranian Revolution, gold rose by 90% in one year, and saw double-digit upside within weeks of the 1991 Gulf War.
We saw similar dip-to-high surges in gold following the 9-11 tragedy. And as for the 2022 fiasco in Ukraine, gold broke 2000 not long after the crisis grew from threat to now ongoing reality.
Patterns in Moving Averages
But for those who still feel that history is no guide to future rhyming patterns, let us give equal respect to some of the key technical signals for the metals.
In fact, these signals—most notably from the 200-day moving averages in gold and silver—are themselves just historical signals of a different flavor.
More importantly, they are indicators which signal a rare opportunity in a time of crisis.
Looking at both gold and silver, for example, each metal has fallen below its 200-day moving average.
This is a powerfully bullish rather than bearish signpost.
Silver Signals
The last time silver fell below this average was in April of 2025, just before the metal, then trading at $27, ripped north at historical multiples and new highs.
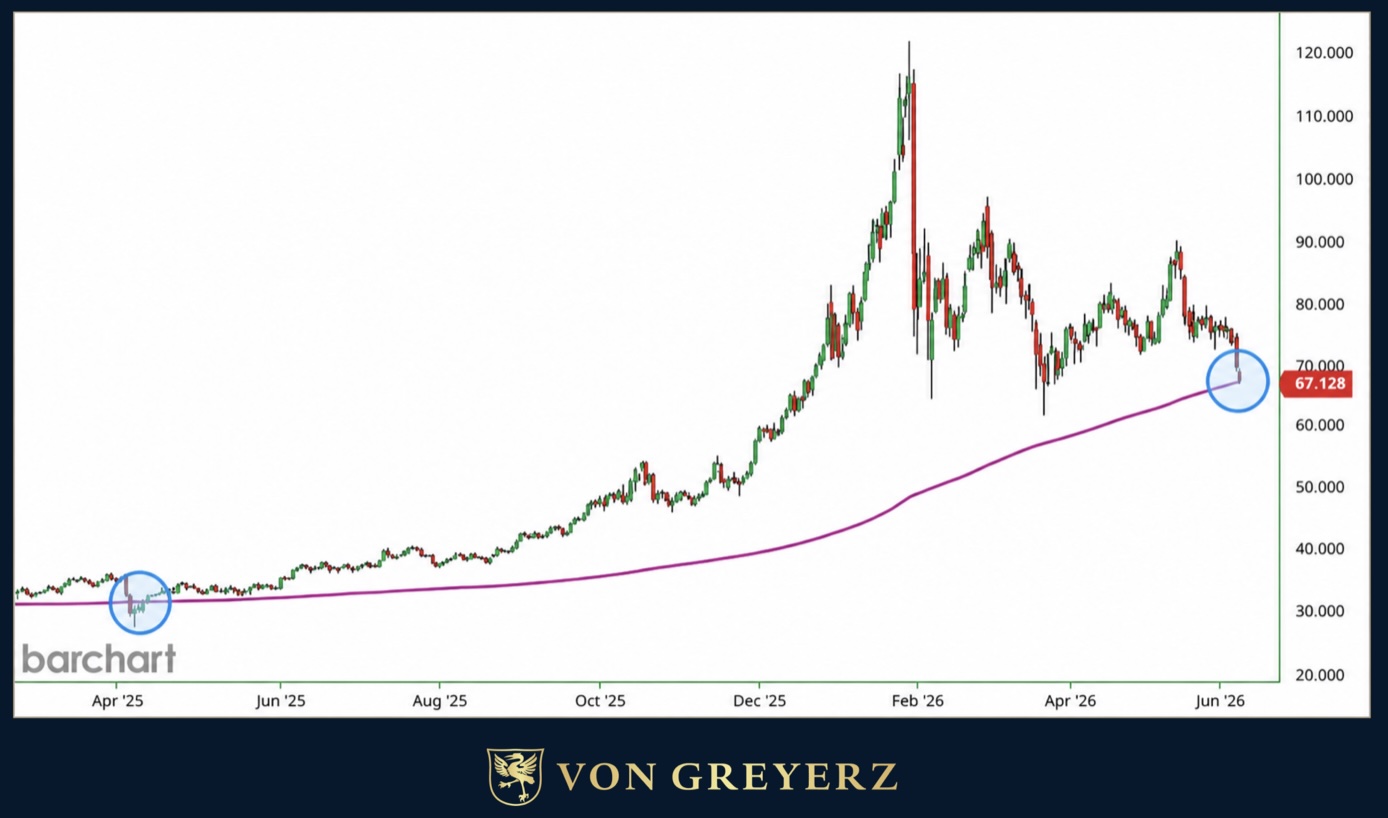
Prior to 2025, we saw similar bullish signals beneath silver’s 200-day line in 2020 (when silver was at $11) and in 2022 (when silver was at $17).
Gold Signals
Equally bullish technical signals are ringing from gold’s recent dip beneath its 200-day moving average.
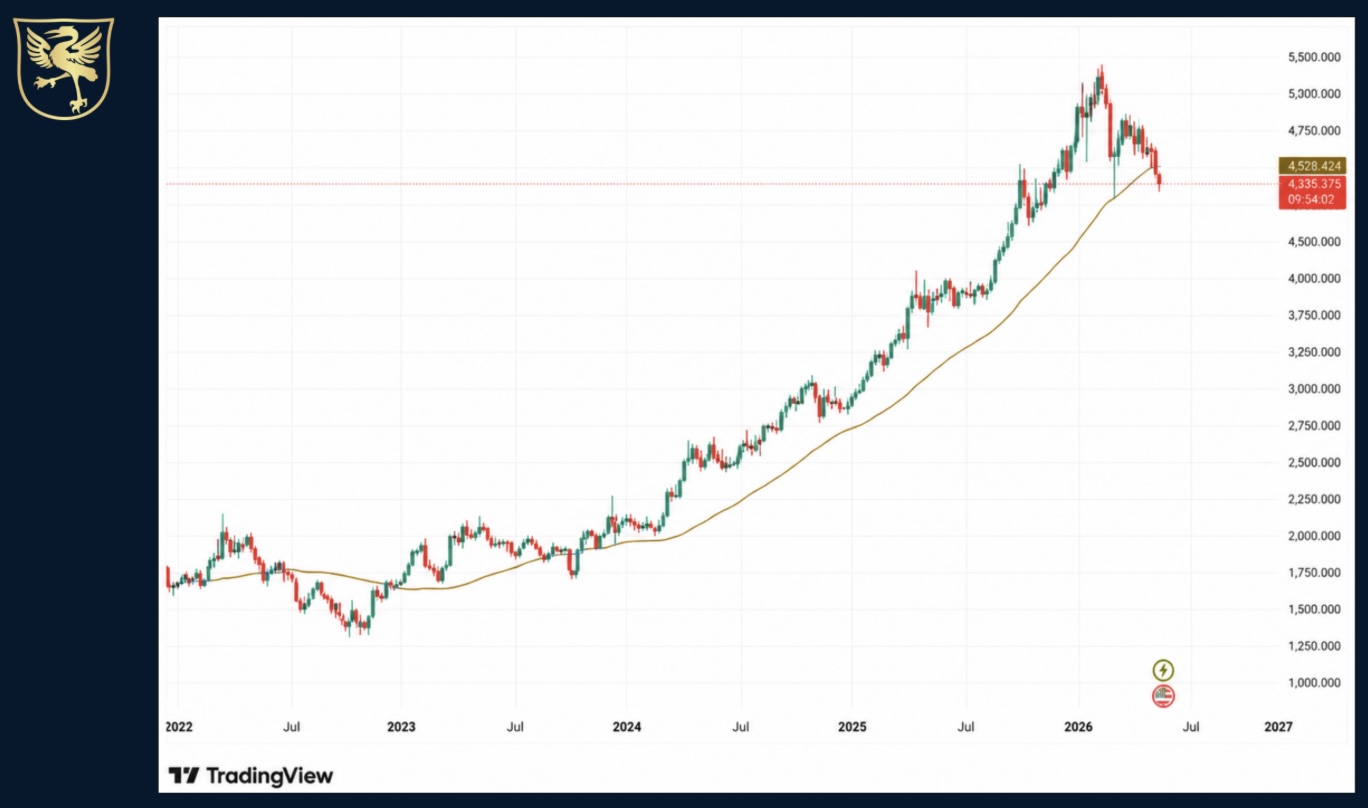
The last times we saw gold below this line it was trading in the $1500-$1600 range (2022) or the $1800 range (autumn of 2023). Thereafter, gold went 100% north 12 months out.
From Pullback to Historical Set-Up
Taken together, these fundamental as well as technical signals combine within a current as well as historical context which makes the current pullback in the metals a near perfect set-up rather than break-up for gold and silver.
In fact, current conditions for the precious metals in 2026 are even more favorable than the prior patterns of the 1970’s discussed above.
In 1973, for example, U.S. public debt was in the $500B, not $39T, range. Today, interest expense alone on American IOUs is twice the size of total US public debt in 1973.
Think about that for a second. At debt this high and unsustainable, the debasement trade is no longer a meme; it’s a fat pitch.
The Structural Bid Few Understand
In the 1970’s, moreover, central banks around the world were selling gold. As of this writing, and despite recent forced gold sales out of Turkey and Saudi Arabia, central banks (from Poland to Asia) are net-buyers of gold.
In fact, since the USA weaponized the world reserve currency in 2022, central bank gold purchasing has increased by 5X.
These signals from the world’s central banks are screaming signposts of a structural bid in the metals which most retail investors (who were spooked out of the trade at lows after buying at tops) are tragically missing.
Even the commercial banks have understood the patterns for gold after an oil crisis, and their price targets for the metal remain nearly twice current price levels.
Thus, whether drawing from historical patterns or from moving-day-average signals, the question going forward is simple: Do you trust King Dollar or a “pet rock”? Crowns of gold or crowns of paper?
Time will tell, and time is clearly on the side of precious metals. This will link you directly to more fantastic articles from Matthew Piepenburg, Alasdair Macleod and Egon von Greyerz CLICK HERE.
Gold & Silver Takedown
To listen to Alasdair Macleod discuss the gold and silver takedown and exactly what he would be telling his clients to do if he was still a broker CLICK HERE OR ON THE IMAGE BELOW.

ALSO RELEASED!
BULLION BANK TAKEDOWN: Gold Plunges $165, Silver 8%, Miners Fall 9% CLICK HERE.
Gold Open Interest Collapses To Lowest Level In Decades CLICK HERE.
Fantastic Look At Gold, Oil And The US Mega Bubble CLICK HERE.
The US Stock Market Is Set For A Historic Crash CLICK HERE.
This Will Be Terrifying For The Public If It Unfolds CLICK HERE.
BUCKLE UP: This Sector Is About To Skyrocket CLICK HERE.
The Price Of Gold Is Coiled To Surge Above $6,000 CLICK HERE.
2026 Has Unleashed Screaming Alarm Signals, But Gold Will Resume Its Historic Surge CLICK HERE.
Crude Oil Headed To $150-$160, Plus A Look At Silver As 90+ Day Delinquencies Skyrocket CLICK HERE.
China Paying $10-$12 More For Silver Than What Is Being Quoted On COMEX CLICK HERE.
Gold & Silver Are Being Drained Out Of COMEX Vaults CLICK HERE.
Gold & Silver Open Interest Collapses To Lowest Level In 13 Years! CLICK HERE.
Gold, Miners And Commodities Poised To Radically Outperform CLICK HERE.
The Great Unwind, Gold, Silver And Mining Stocks CLICK HERE.
The Truth About Gold And The Coming Stock Market Crash CLICK HERE.
Everyone Needs To Read This And Be Prepared For What Lies Ahead CLICK HERE.
© 2026 by King World News®. All Rights Reserved. This material may not be published, broadcast, rewritten, or redistributed. However, linking directly to the articles is permitted and encouraged.


