

Gold and silver continue to consolidate upside gains, but take a look at this…
Gold: 5% dip is in the cards
May 15 (King World News) – Graddhy out of Sweden: The present pullback is just one more brick in the secular bull market wall.
The Current Pullback In Mining Stocks Will Be Short-Lived On The Way To The HUI Soaring 1,250%!
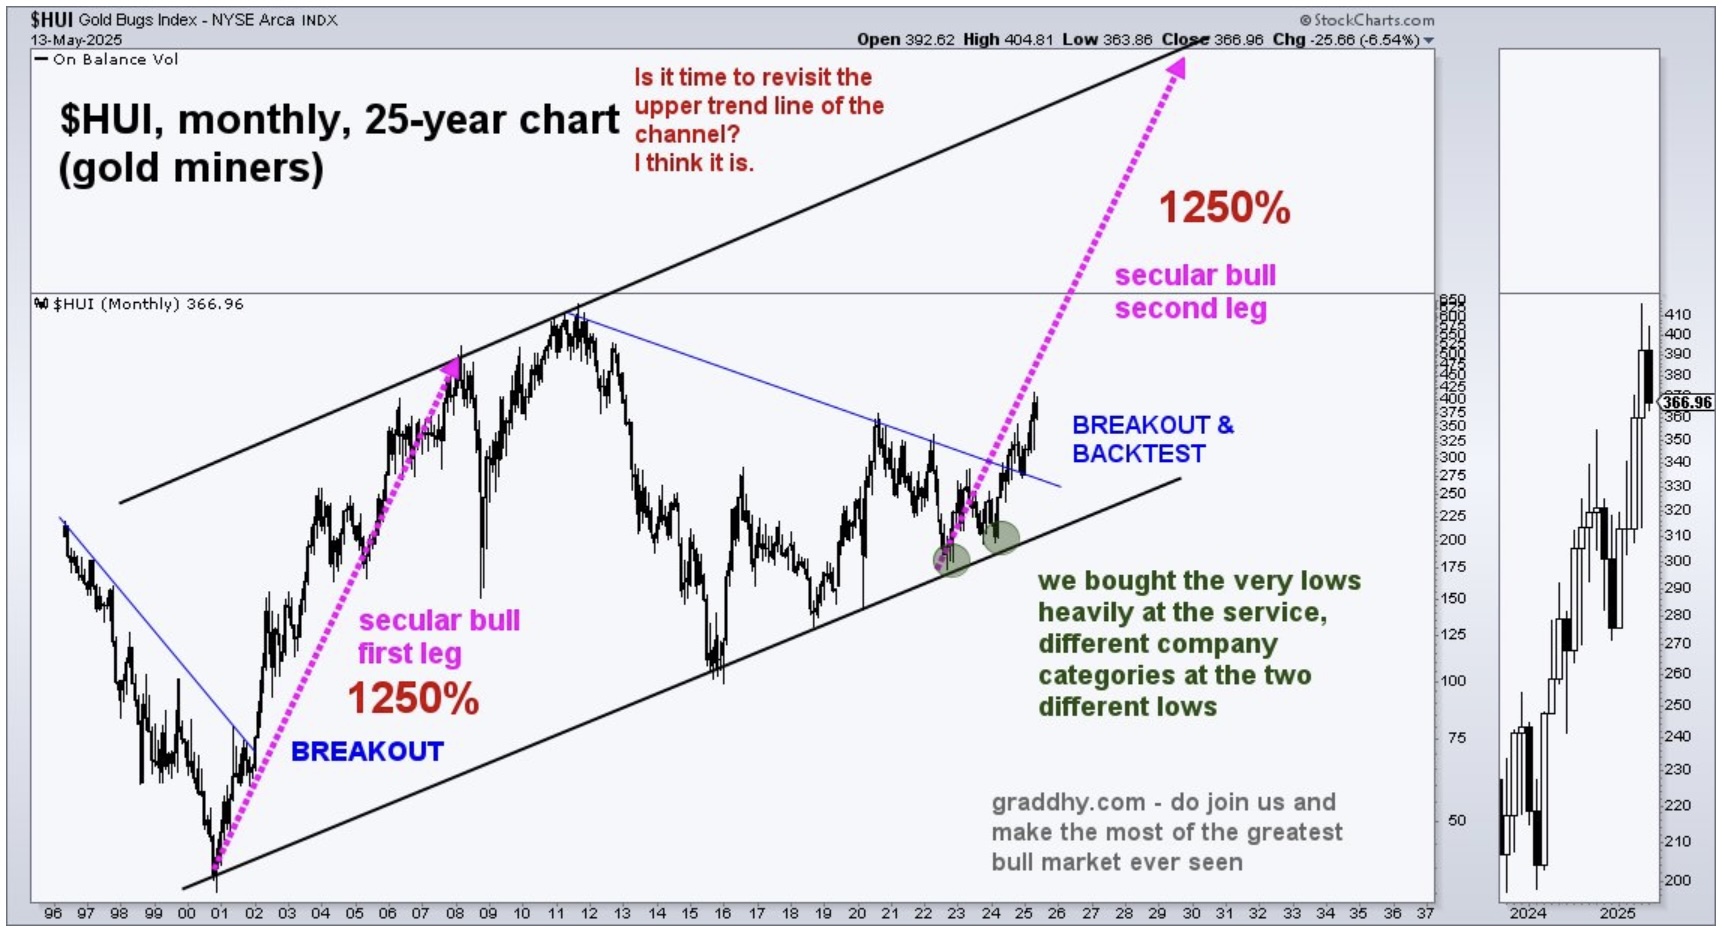
Do Not Lose Sight Of The Big Picture
Graddhy out of Sweden: It is important to not lose sight of the bigger picture, e.g. this chart showing a combined chart for gold & silver.
Very interesting that this chart now shows a red parabolic move in the making.
CEF Gold & Silver Red Parabola
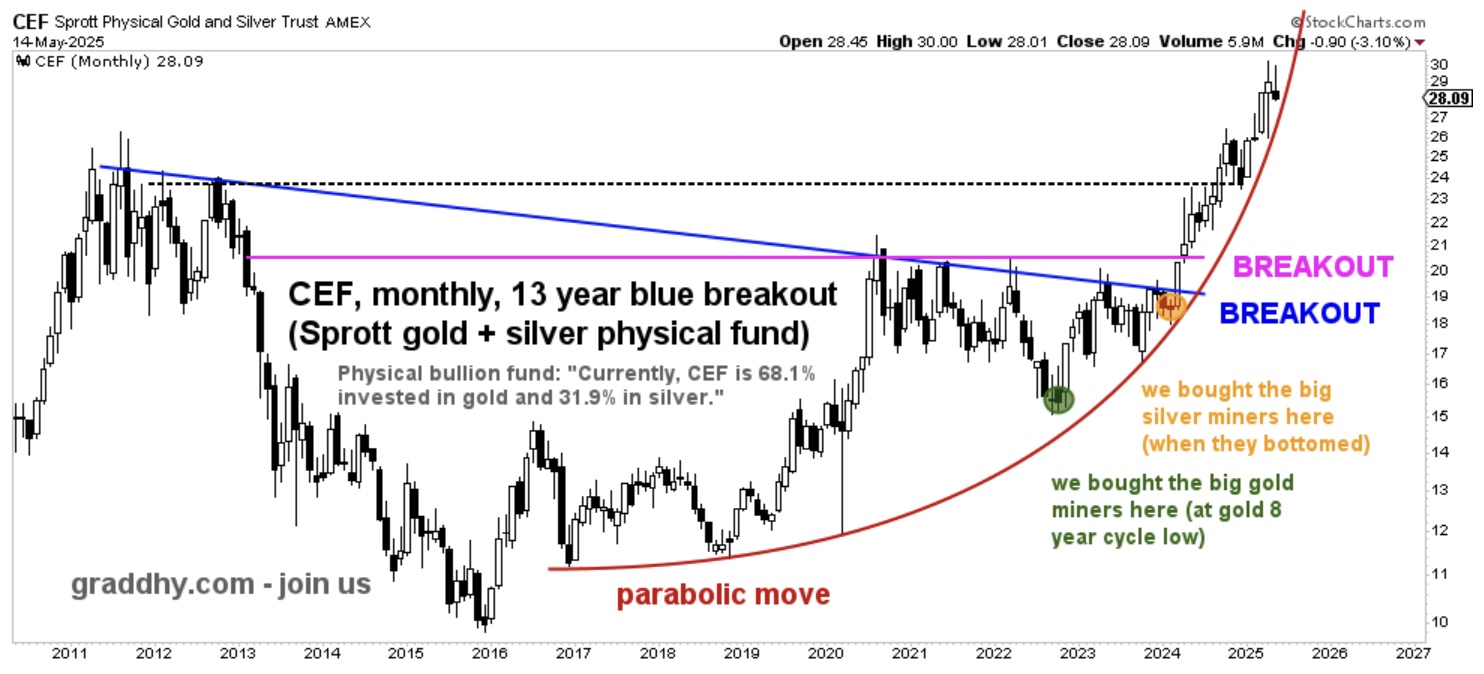
Shared this chart at both blue plus pink line breakout.
Also shared this chart on breakout plus also backtest of black line as well as on the higher high after the black breakout.
Stated at the blue 13-year breakout that the probabilities favoured gold doing a historical lockout move, i.e. not backtesting the blue breakout. That is exactly what happened.
From the blue breakout to the high was a move from $2000 to $3500 for gold, i.e. a 75% move (..!) in 15 months. Hoping you took notice of my charts on CEF, plus many on gold, and caught most of the move.
Note that most were calling for a big pullback on the way up last 15 months.
Citi’s Naveen Nair Weighs In On Gold’s Consolidation
Gold: 5% dip is in the cards
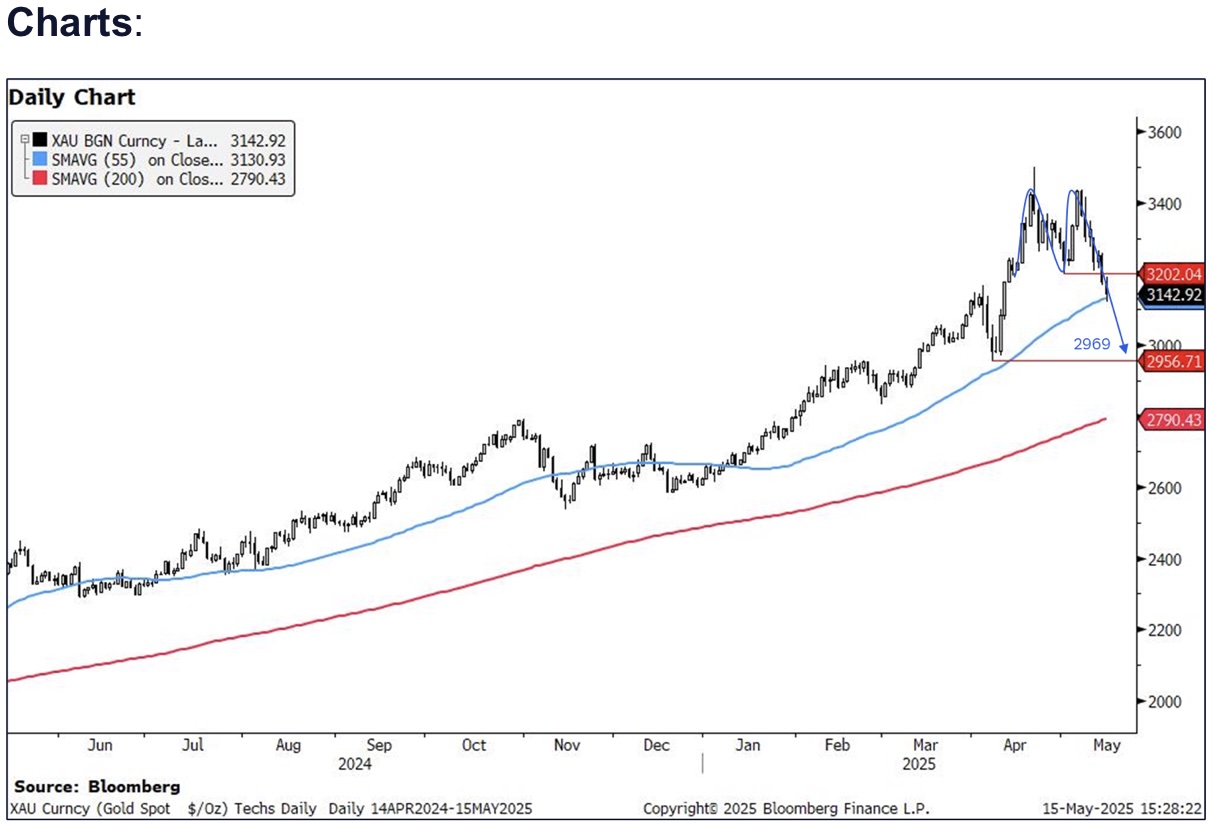
Naveen Nair at Citi: A break of the double top neckline in gold suggests we could see a short term dip towards the 3000 handle, though we first have to clear the 55d MA support at 3130.
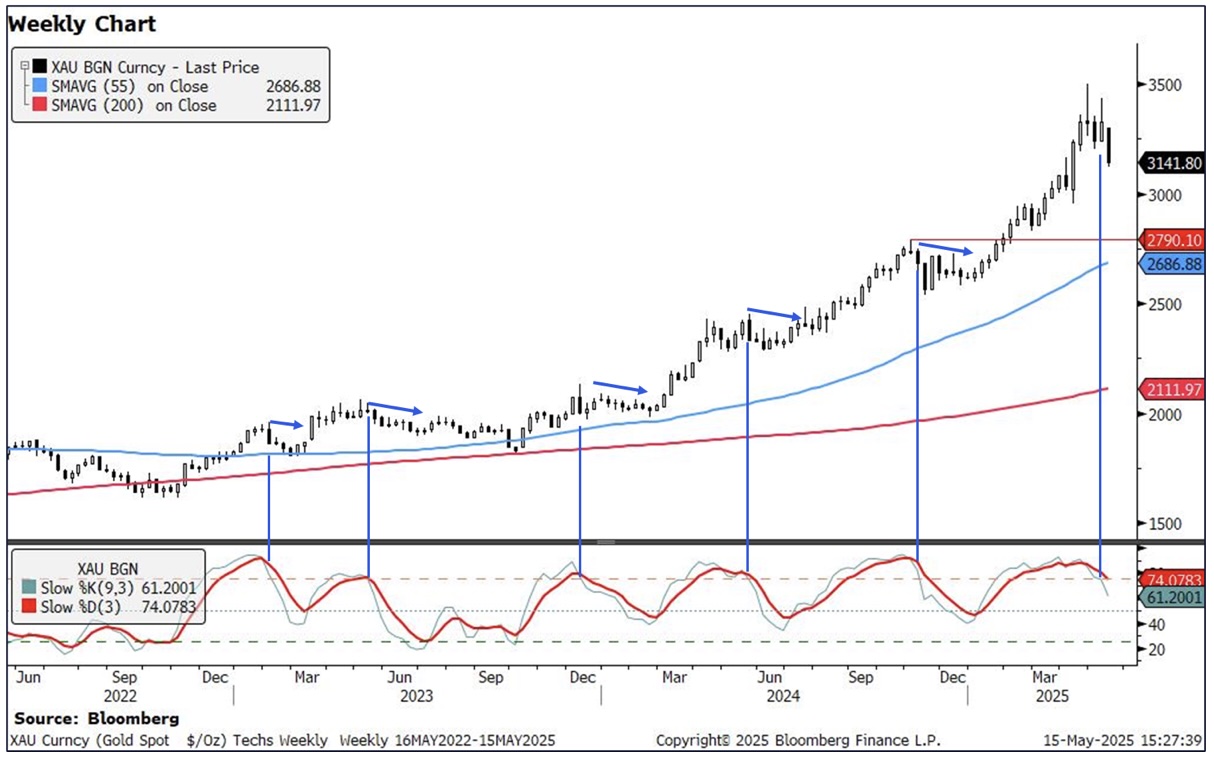
Weekly momentum crossing lower from overbought territory also adds to the picture of a dip, though techs suggest that extended downside is unlikely at this stage.
Gold spot has posted a double top formation in the daily chart, with a clean close below the neckline at 3202 (May 1 low). Price is now testing interim support at the 55d MA at 3131. IF we close below that as well, it would add to the bearish picture, with a potential drop of ~5% below that.
We take a look at the technical building blocks:
- The double bottom formation suggests a target of ~2969, which is a near the 2957 (April low) support.
- Weekly slow stochastics is crossing lower from overbought territory. This has been suggestive of downside, though the drops have only been ~3% when this has happened in the last 3y.
- As a result, it is hard to envision that this downtick will lead to a sustained drop in the medium term. This is further supported by the fact that in the last year, we have only seen brief dips below the 55d MA, and have not tested the 200d MA since 2023.
- Below the 55d MA at 3131, there is no clear support till the 2956-3000 level (April low, psychological level, double top target).
- Broader macro fundamentals also appear to support the move, with a portion of the strong gold rally driven by tariff related concerns. With those coming off amidst recent trade talks, gold could be under short term pressure.
Strong Support For Gold Pullback
Taken together, we think there is potential for further downside in the short term, but think that we will remain supported in the $2956-$3000 area.
Note that our research team is expecting gold to range between $3-3300/oz in the coming months, and have dissected the drivers of the recent record gold rally in their piece.
JUST RELEASED: Price Predictions For Gold, Silver And Much More!
To listen to Nomi Prins discuss her latest remarkable price predictions for gold, silver, mining stocks, uranium, the US dollar and more CLICK HERE OR ON THE IMAGE BELOW.

© 2025 by King World News®. All Rights Reserved. This material may not be published, broadcast, rewritten, or redistributed. However, linking directly to the articles is permitted and encouraged.


