

Another major oil price spike will be even more painful for consumers but hugely bullish for gold and silver.

Is Another Oil Spike Ahead?
May 20 (King World News) – This is a portion of an incredibly important and timely report released by Jesse Colombo: In a departure from my usual precious metals reports, today I’m publishing an analysis focused on oil and, more specifically, the potential for another spike in oil prices as global inventories rapidly deplete. I’ll also discuss what this could mean for precious metals and the global bond market, as well as ways investors can take advantage of this scenario.
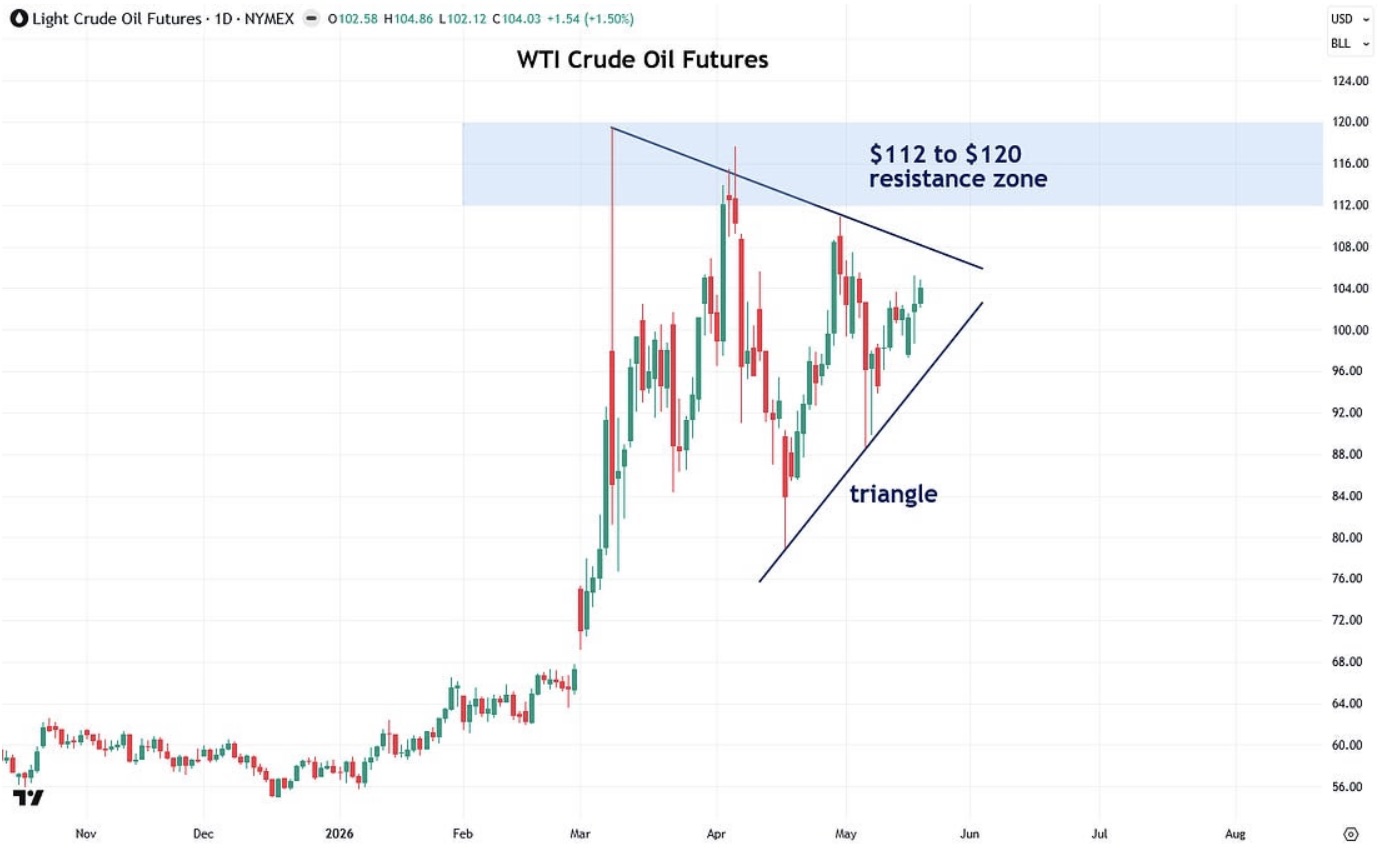
I want to begin with the daily chart of West Texas Intermediate (WTI) crude oil, the main oil benchmark in the United States. Since its initial Iran war-induced spike from roughly $68 to $120 per barrel in early March, crude oil has been surprisingly calm, trading mostly around the $100 level. However, there is a real risk that this is merely a pause or consolidation before another leg higher.
It turns out that the consolidation of the past few months has formed a triangle pattern, and these patterns are often continuation patterns that resolve in the direction of the primary trend, which in this case is up. Of course, confirmation is still needed in the form of a decisive breakout above the triangle accompanied by strong volume (learn more about confirming breakouts with volume).
Assuming a breakout from the triangle does occur, I would also like to see crude oil close decisively above the $112 to $120 resistance zone that formed at the three peaks in March and April for added confirmation. The reason is that breakouts above horizontal resistance zones and levels tend to be more reliable than breakouts above diagonal resistance levels such as the top of the triangle.
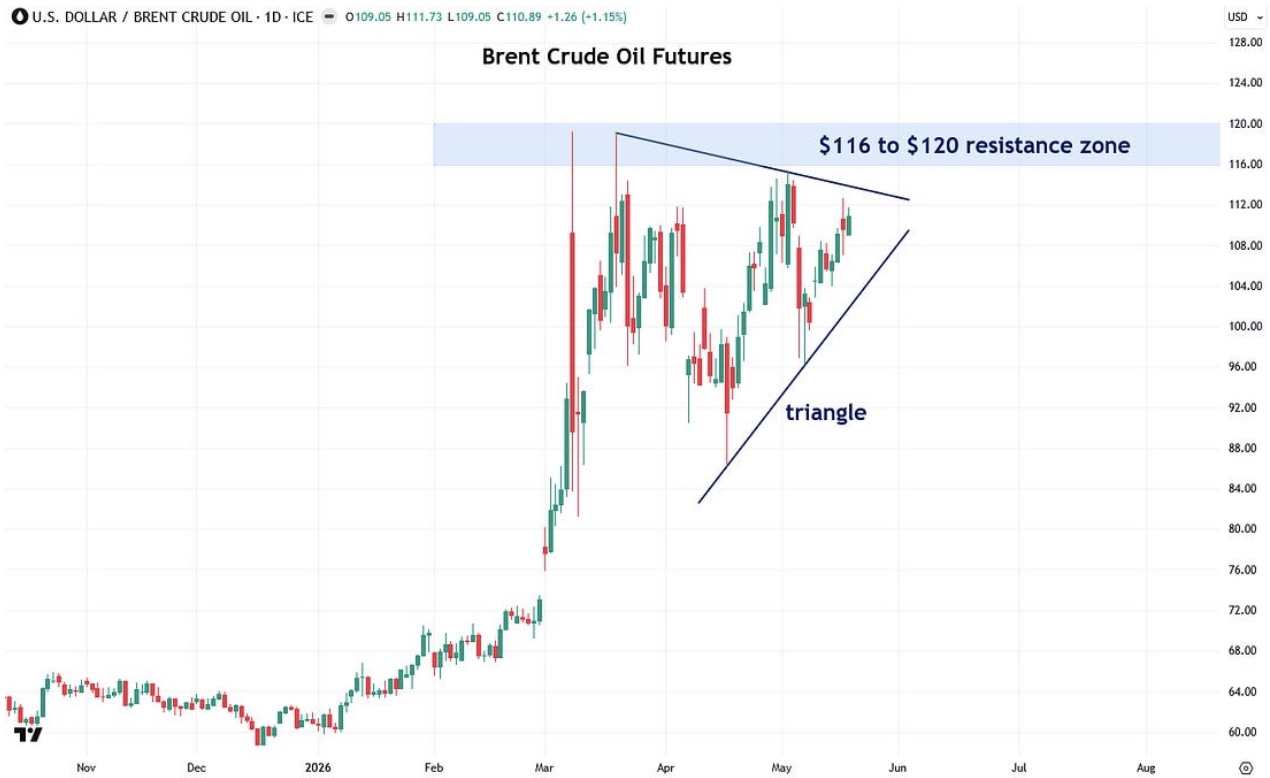
Next, let’s take a look at the chart of Brent crude oil, which is the main international oil benchmark. Like WTI crude oil, it has also formed a triangle pattern over the past few months, and a decisive breakout from it would likely signal another leg higher.
Ideally, the most reliable scenario would be for both Brent and WTI crude oil to break out of their respective triangle patterns simultaneously, which would increase the probability that the breakout is genuine.
In addition to a breakout from the triangle, a decisive close above the $116 to $120 resistance zone that formed at the recent peaks would provide even further confirmation that Brent crude oil is about to surge once again.
Now that we’ve discussed the technical setup, let’s turn to the major fundamental reason there could be another spike in oil prices ahead: global commercial oil inventories are shrinking rapidly, eroding the critical buffer that has prevented oil from surging even higher than it did at the start of the Iran war in early March.
As International Energy Agency Executive Director Fatih Birol said on Monday regarding global oil inventories, “I think it is depleting very fast.” It will be “several weeks, but we should be aware of the fact that it is declining rapidly,” he said. He also said, “This could have major implications for the food prices and together with the higher energy prices they might give a big push to inflation numbers.”
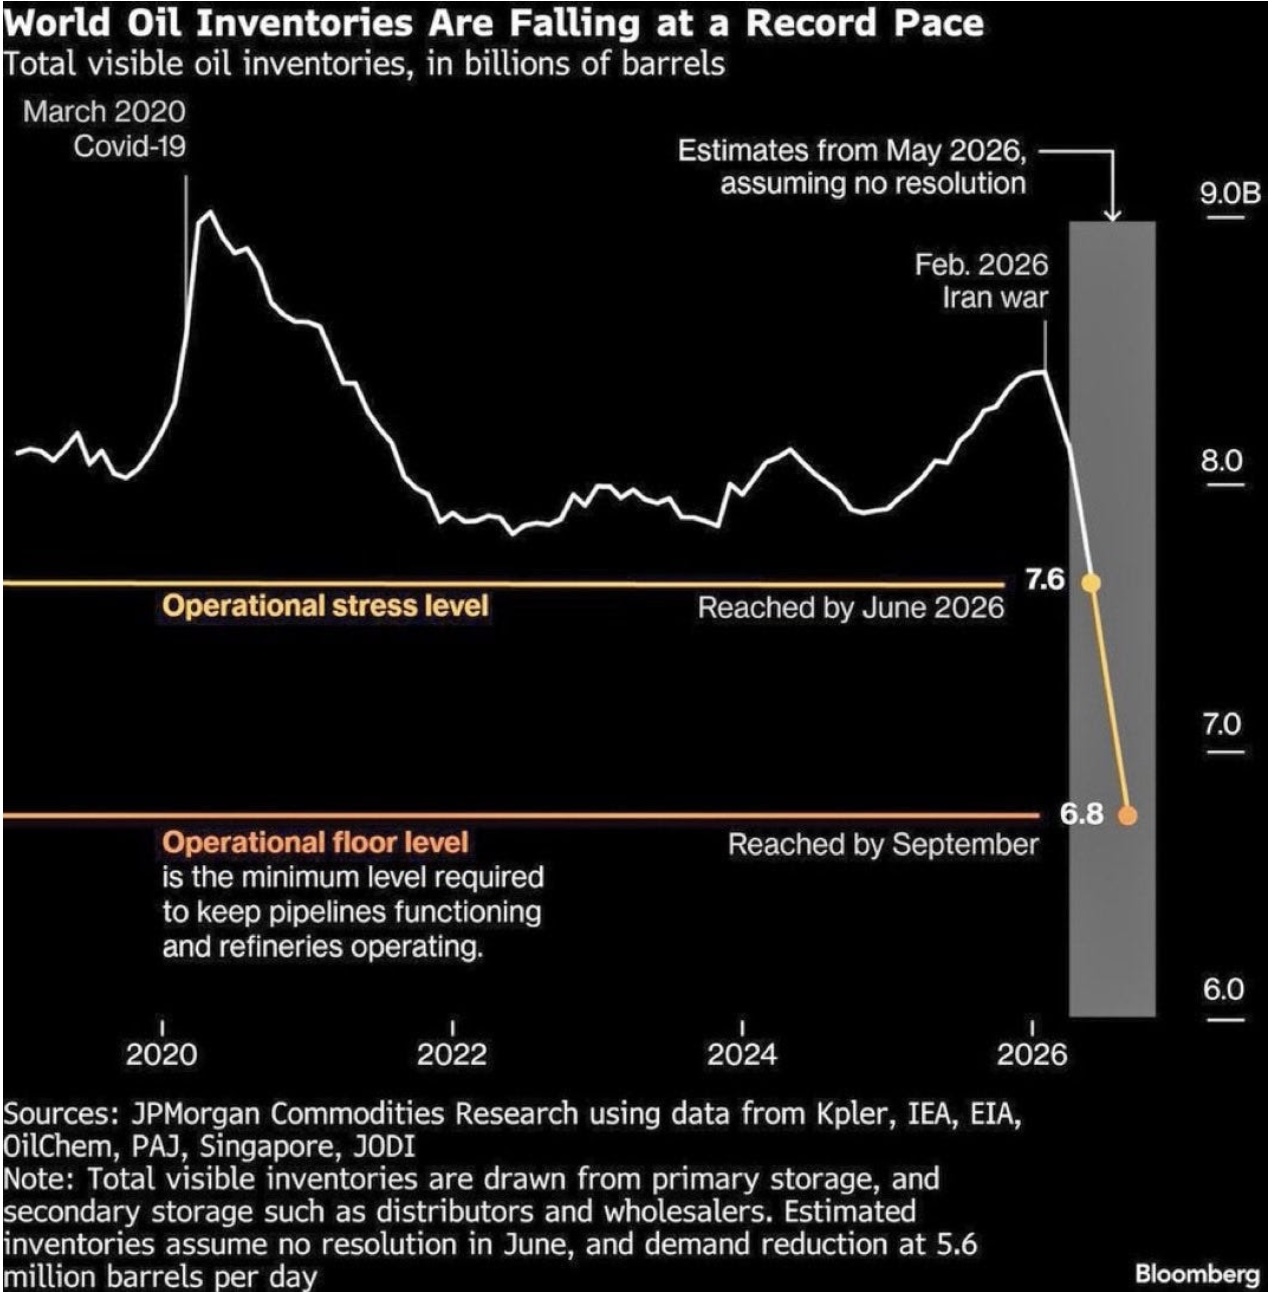
Bloomberg recently published a harrowing chart from JPMorgan showing how sharply global oil inventories have dwindled since the start of the Iran war. Assuming no resolution to the conflict, the bank projects inventories falling to 7.6 billion barrels by June, a level considered the “operational stress level.”
If the war continues through September, inventories are projected to fall further to just 6.8 billion barrels, the so-called “operational floor level,” or the minimum required to keep pipelines functioning and refineries operating.
In other words, we are rapidly approaching the danger zone where a global energy crisis unfolds. It is plausible that this scenario is what the oil price triangle patterns I showed earlier are signaling.
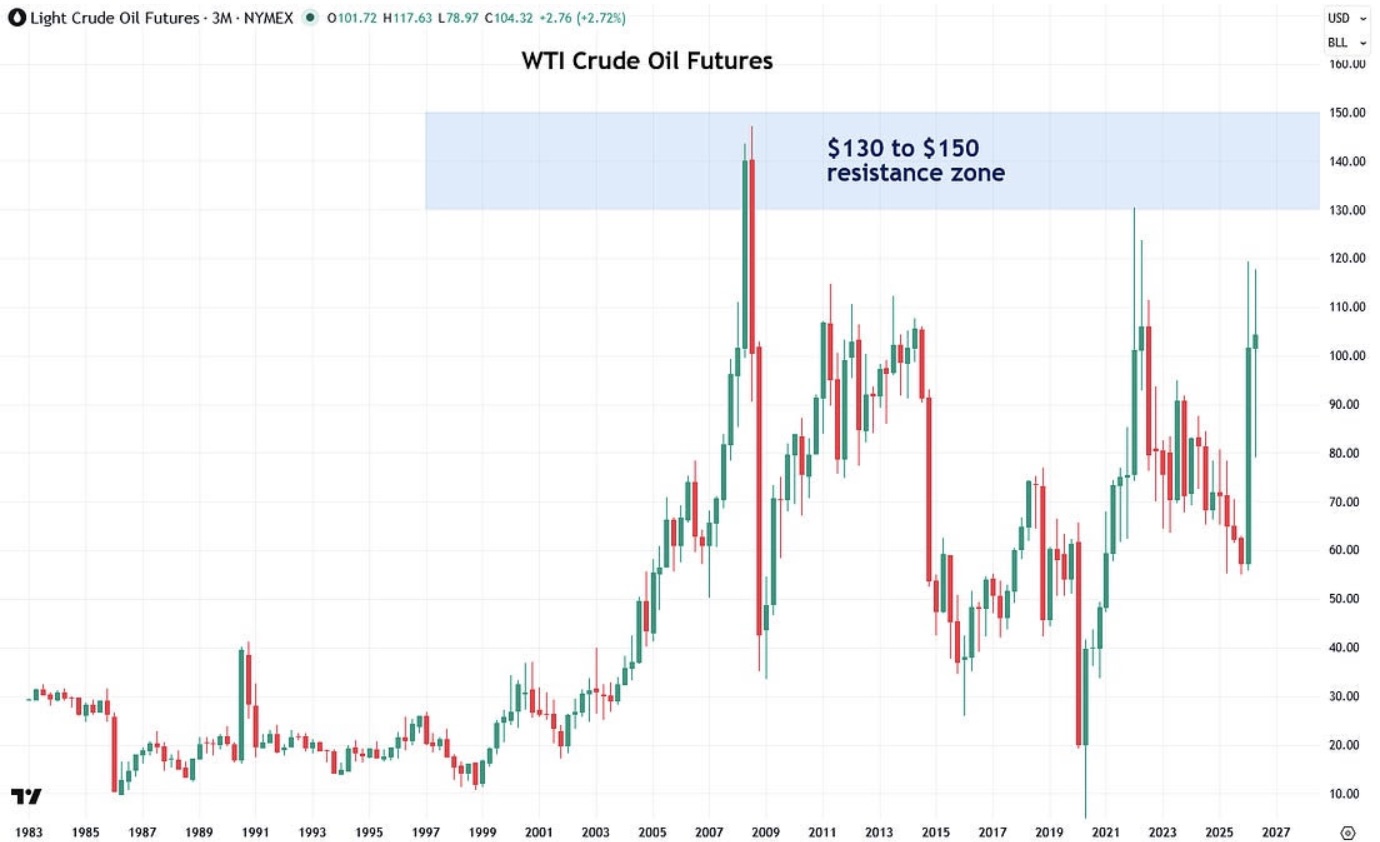
Next, I want to show the long-term price chart of WTI crude oil to provide some perspective on where current oil prices stand relative to past cycles. At roughly $104 per barrel today, crude oil is near the upper end of its historical range going back to 1983, though it still remains well below the 2008 peak of $147 and the 2022 peak of $130.
If WTI crude oil breaks out from its triangle pattern, it would likely put oil back into the $130 to $150 resistance zone formed by the 2008 and 2022 peaks. A potential eventual breakout above that zone could conceivably send oil to $200 or even higher, which is not as far-fetched as it may sound, as I will explain next.
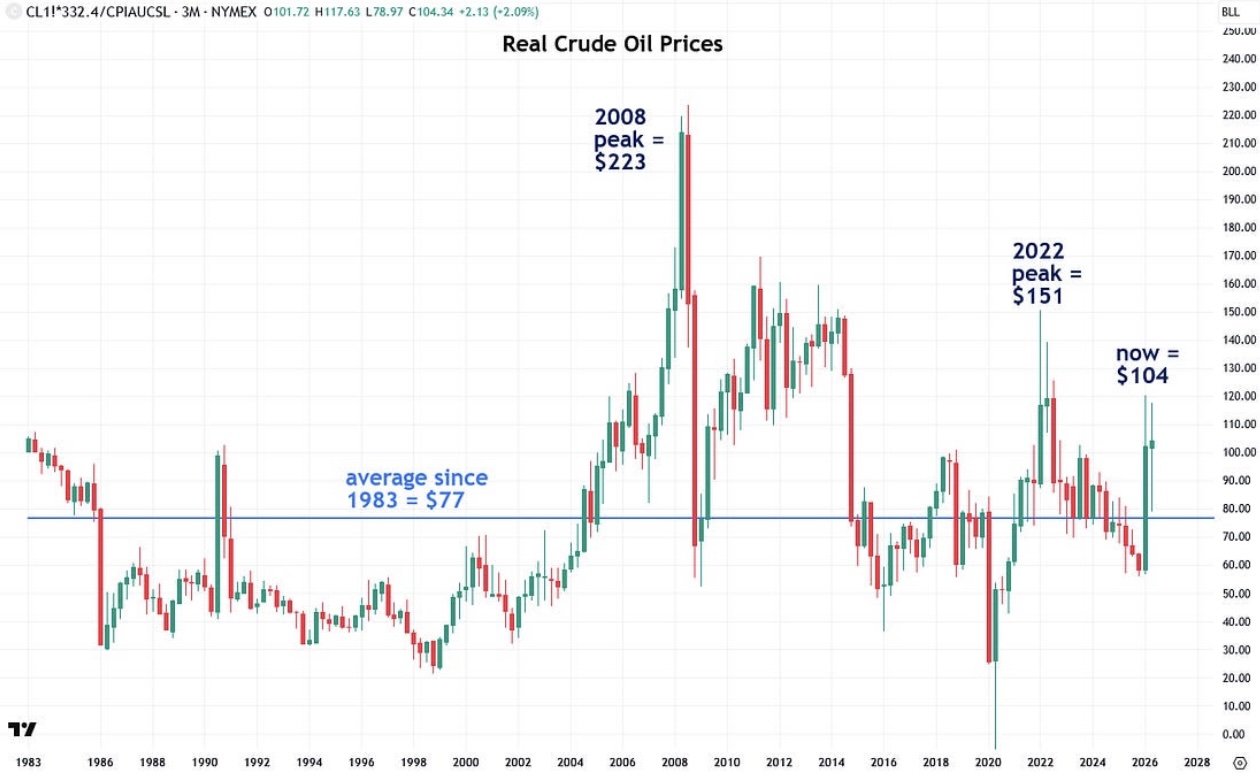
While $104 per barrel oil and U.S. gasoline prices of roughly $4.50 per gallon seem high and are certainly frustrating, while also putting a strain on consumers and the global economy, the reality is that they are not even especially high when adjusted for inflation. In other words, the oil spikes of 2008 and 2022 were actually significantly higher than current prices in real terms.
As the long-term chart of real WTI crude oil prices below shows, the 2008 peak reached $223 per barrel while the 2022 peak reached $151 per barrel, both far above today’s price of roughly $104 per barrel. That indicates that there is still considerable room for oil prices to move higher, making a $150 to $200+ per barrel scenario surprisingly realistic, as outlandish as it may sound. After all, most investors two years ago did not foresee gold doubling to over $4,000, yet here we are.
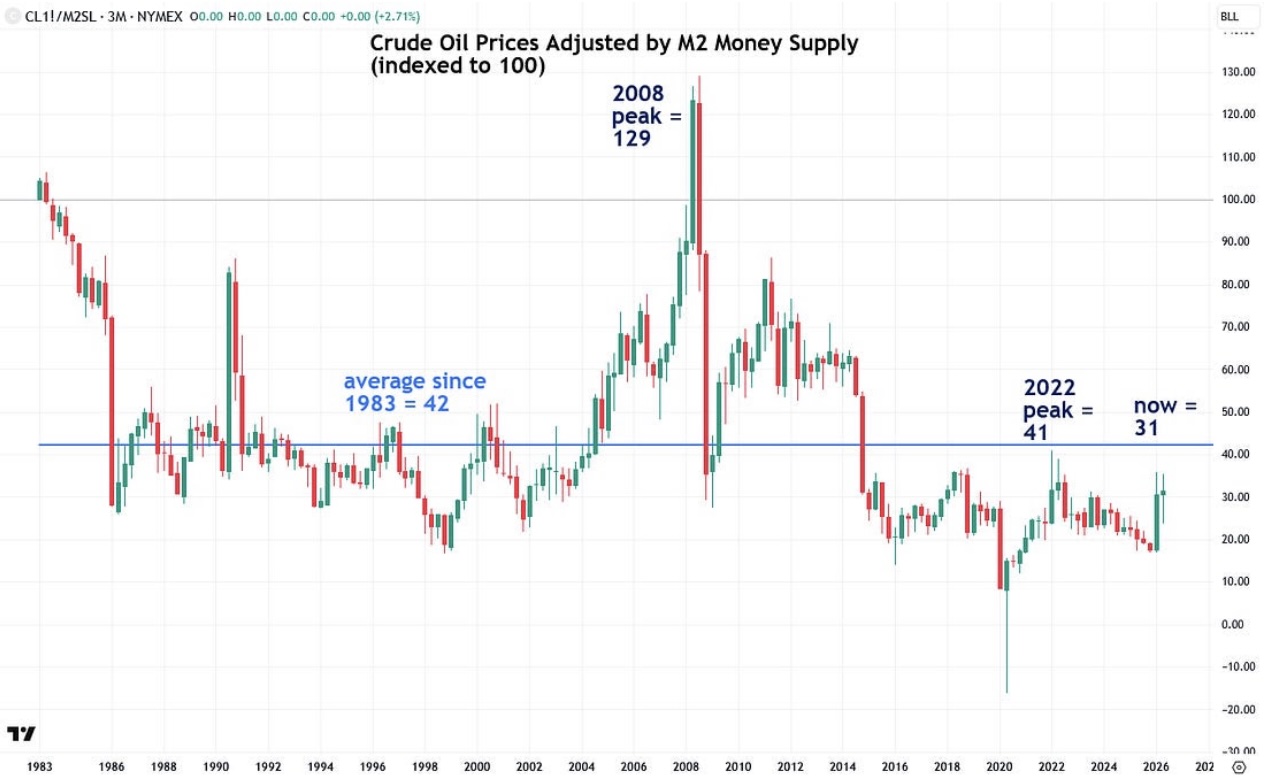
Another way to adjust oil prices or other commodities for inflation is to divide them by the U.S. M2 money supply, and this is arguably a more effective method than using the Consumer Price Index (CPI), as I did in the prior chart.
The reason is that the CPI is known for understating inflation, while growth in the money supply is the true underlying driver of inflation. As Nobel Prize-winning economist Milton Friedman famously stated, “Inflation is always and everywhere a monetary phenomenon.”
A look at the long-term chart of WTI crude oil adjusted for the U.S. M2 money supply shows that, at 31 today, oil is actually quite cheap relative to its average reading of 42 since 1983 and far below its 2008 peak of 129 and even its 2022 peak of 41. Once again, this indicates that there is considerable room for oil prices to reprice much higher.
Now I want to discuss ways investors can position themselves for another oil spike, particularly those who are more experienced traders, have a higher risk tolerance, and are interested in doing so (note: this is not investment advice).
The most obvious and straightforward approach is to buy an ETF such as the United States Oil Fund LP (USO), which tracks the price of oil. If you are in another country and do not have access to that particular ETF, there are other oil ETFs traded in Canada, Europe, and elsewhere, though finding them may require a bit of sleuthing through Google.
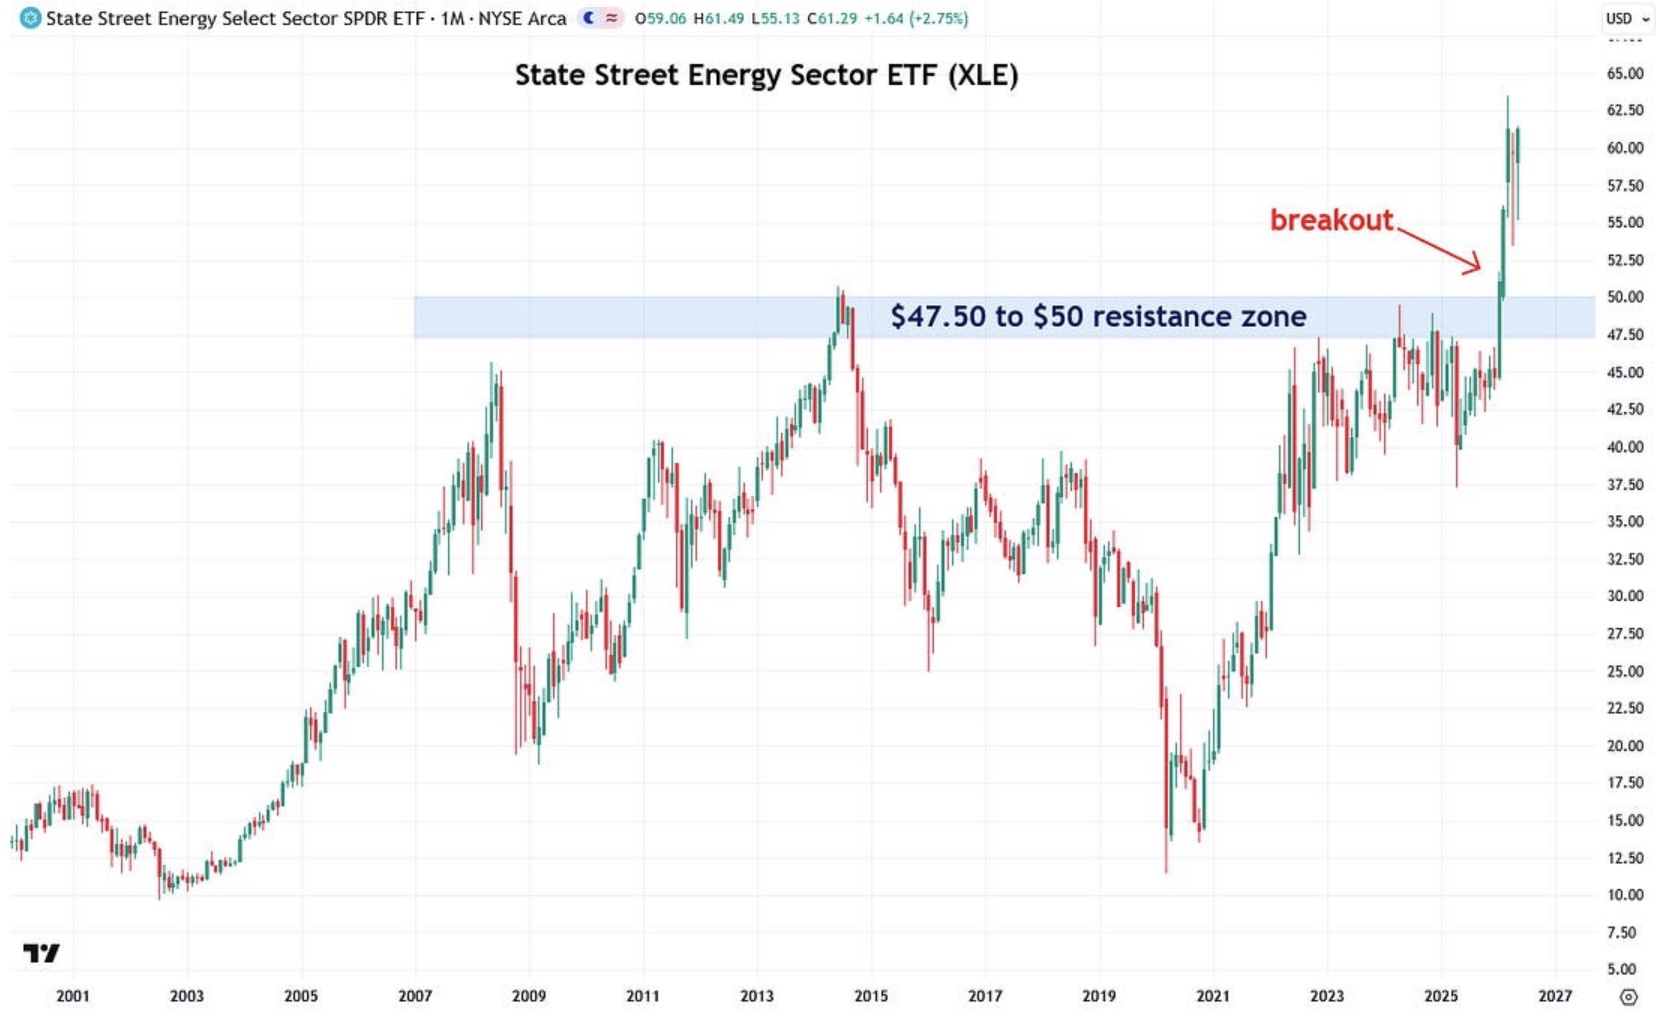
This thesis can also be played through ETFs that hold the stocks of oil companies such as Exxon Mobil Corporation, Chevron Corporation, ConocoPhillips, and Valero Energy Corporation. The most popular oil stock ETF is the Energy Select Sector SPDR Fund (XLE), which generally tracks the price of oil, though it is also influenced by movements in the broader stock market.
As the chart below shows, XLE, and thus the oil sector more broadly, formed a massive base over the past 18 years and recently closed above the key $47.50 to $50 resistance zone. Based on the sheer size of that base, the breakout indicates that even further gains are likely ahead.
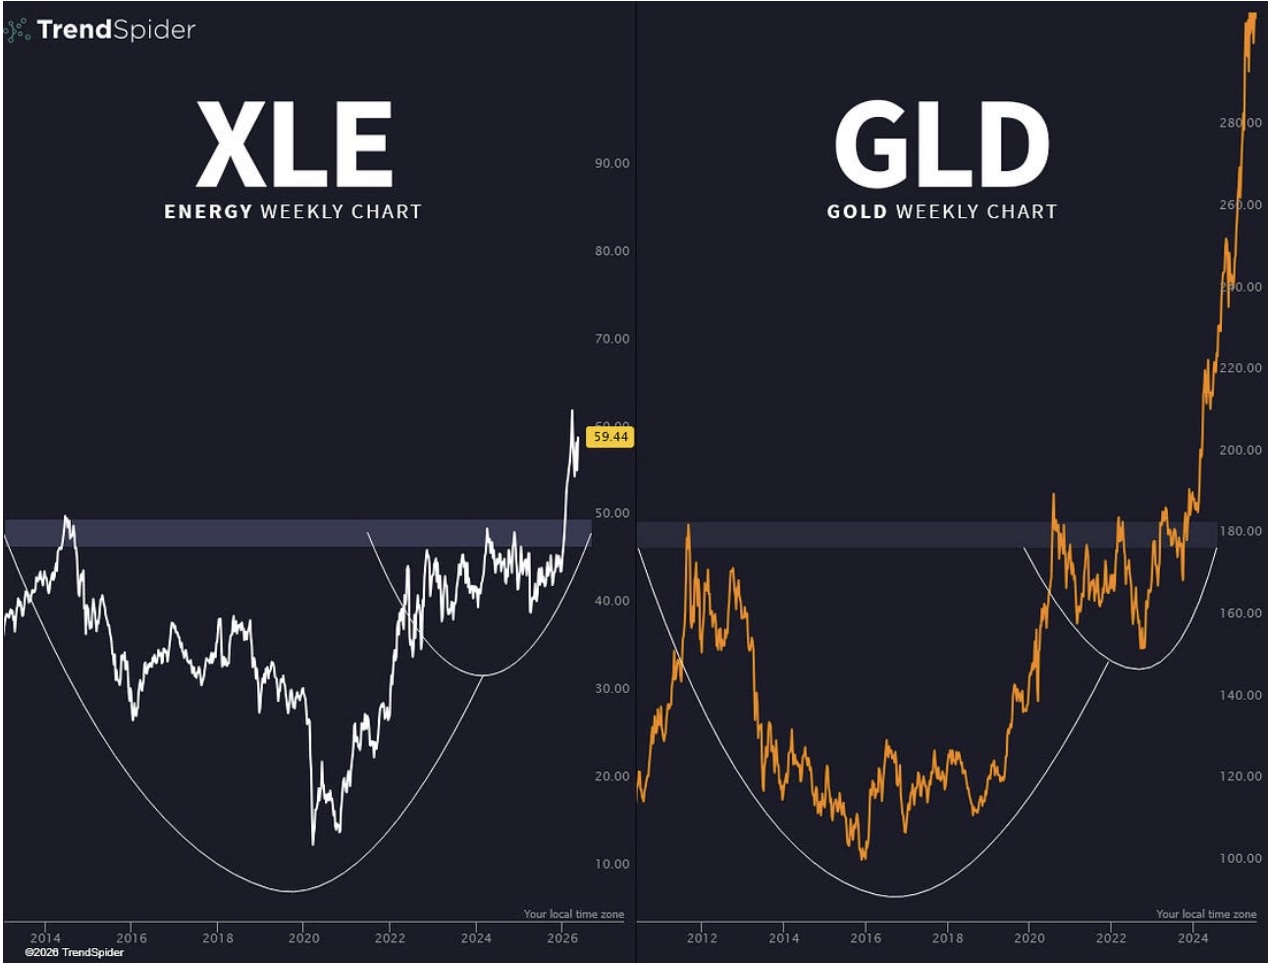
The trading software firm TrendSpider recently posted a fascinating chart comparing the nascent breakout in Energy Select Sector SPDR Fund (XLE) to gold’s breakout two years ago, suggesting that the oil stocks likely have much further to run:
Now I want to discuss what a more extensive oil bull market would mean for precious metals. In the early stages of the Iran war, precious metals took a hit due to the resulting rise in inflation expectations and bond yields, as I explained in this report.
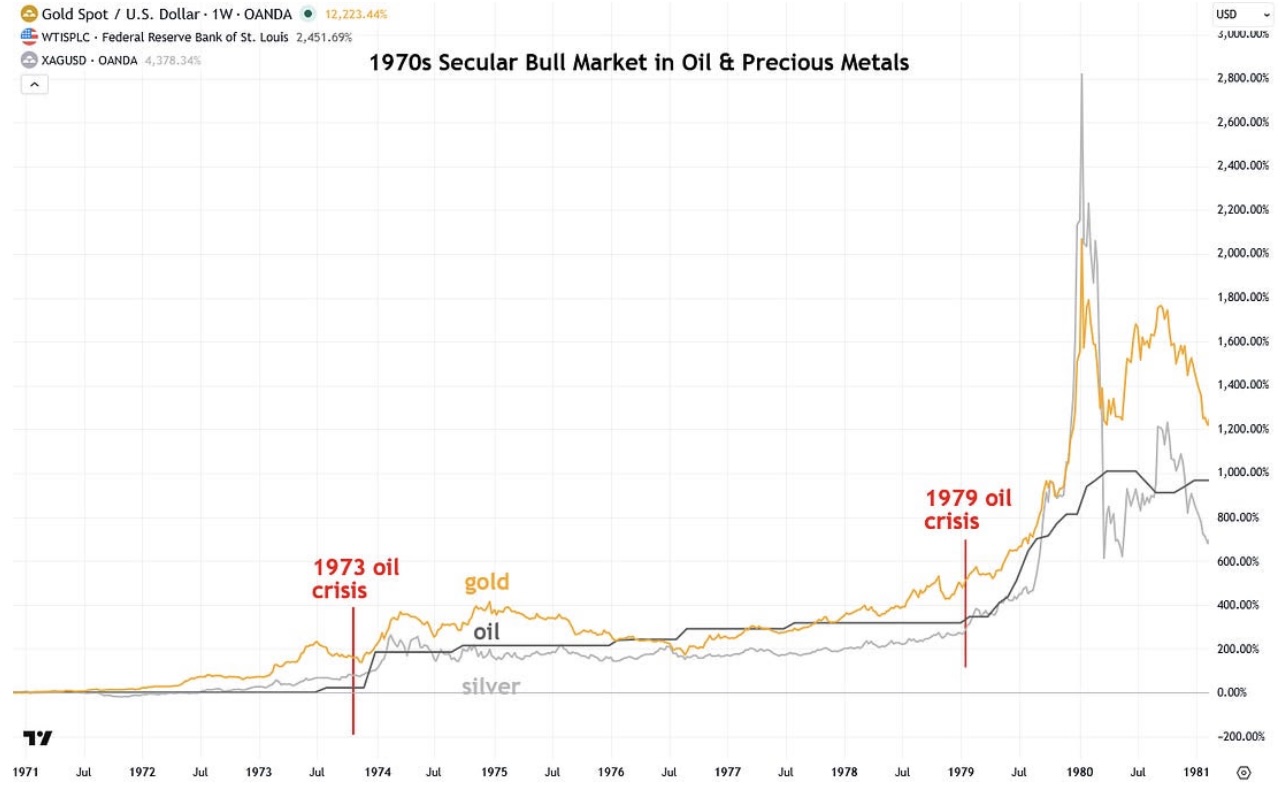
Despite this initial reaction, which I believe was largely driven by the shock factor surrounding the Iran war, historically the biggest bull markets in oil — the 1970s and 2000s — also coincided with major bull markets in precious metals and other commodities, as I explained recently. That phenomenon is known as a commodity supercycle, and I believe we are in one right now and that the bull markets in gold and silver will last many more years.
During the 1970s commodity supercycle, which also involved war-related oil price shocks, oil, gold, and silver all rallied strongly in tandem:
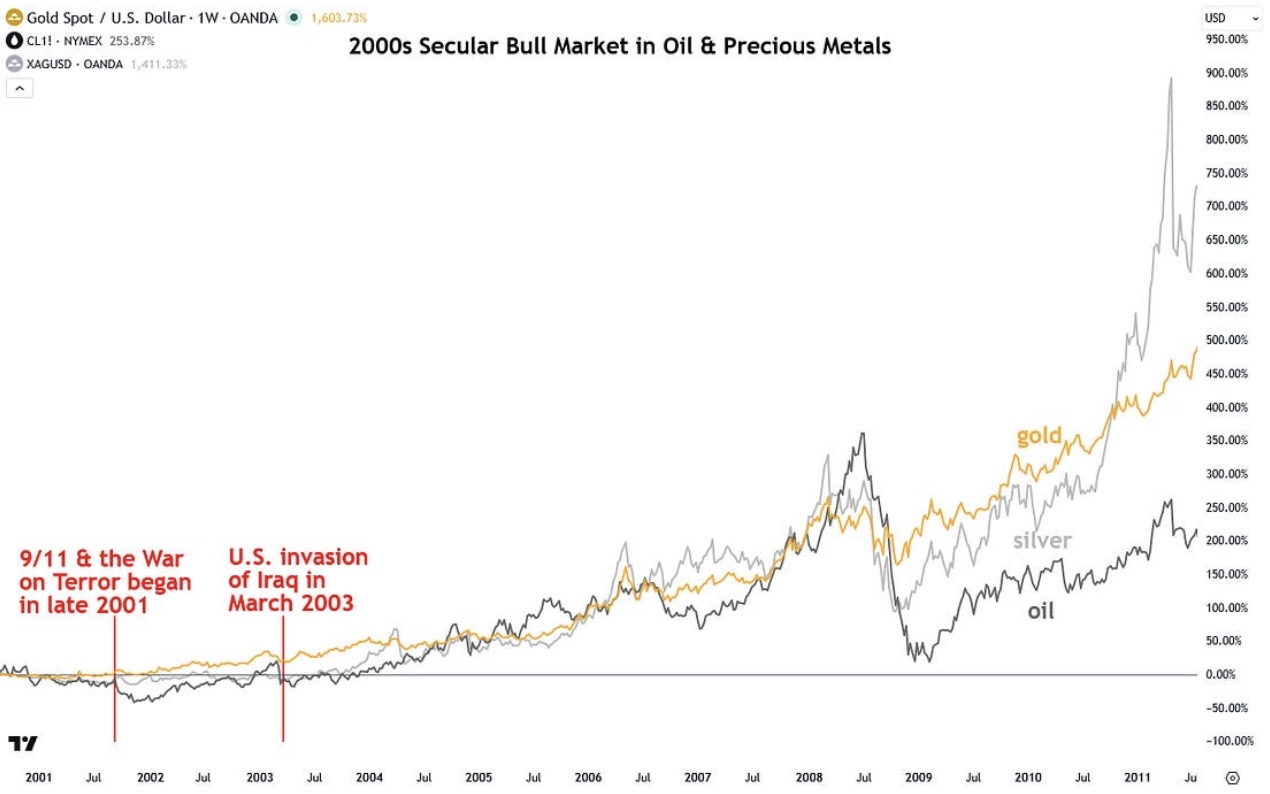
And the exact same phenomenon occurred during the 2000s commodity supercycle, which was also marked by war in the Middle East:
Now I want to discuss how rising energy costs are triggering a steep selloff in the global bond market, which I believe is only getting started. For some background, inflation is the anathema of bonds and bond investors because it erodes the purchasing power of their fixed income payments. When inflation spikes, as it is now due to rising energy prices, investors typically sell bonds, causing bond prices to fall and yields to rise.
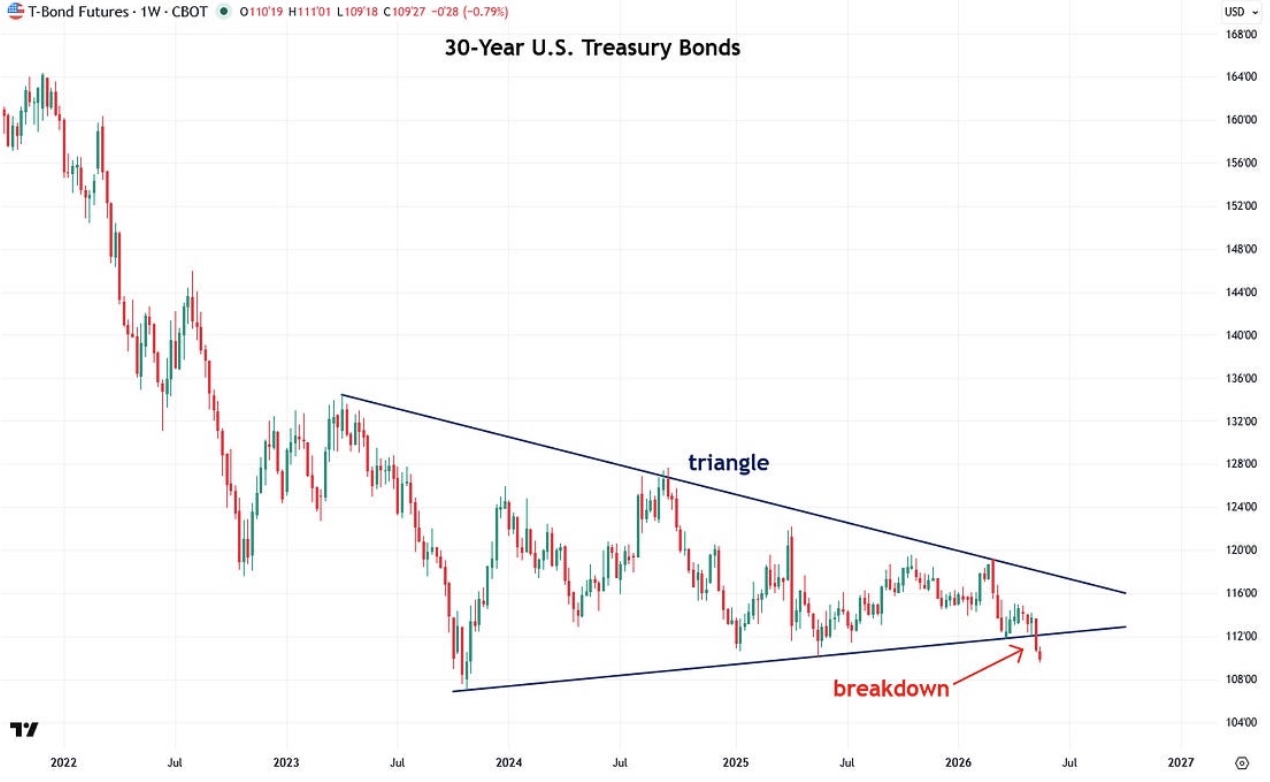
Very concerningly, 30-year U.S. Treasury bonds recently broke down from a triangle pattern that had been forming over the past several years, indicating that even more pain in the bond market is likely ahead (especially if oil takes off again):
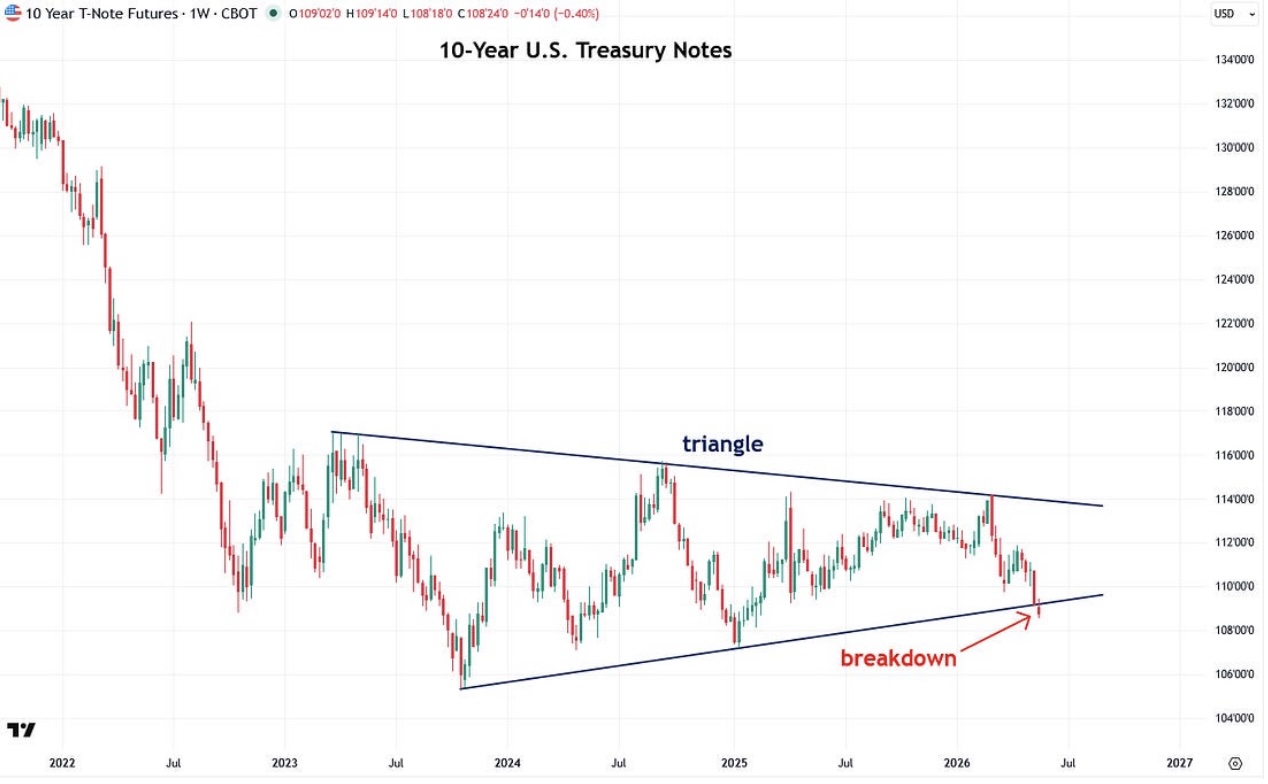
The bond selloff is occurring across the yield curve, with 10-year U.S. Treasuries also recently breaking down from a multi-year triangle pattern:
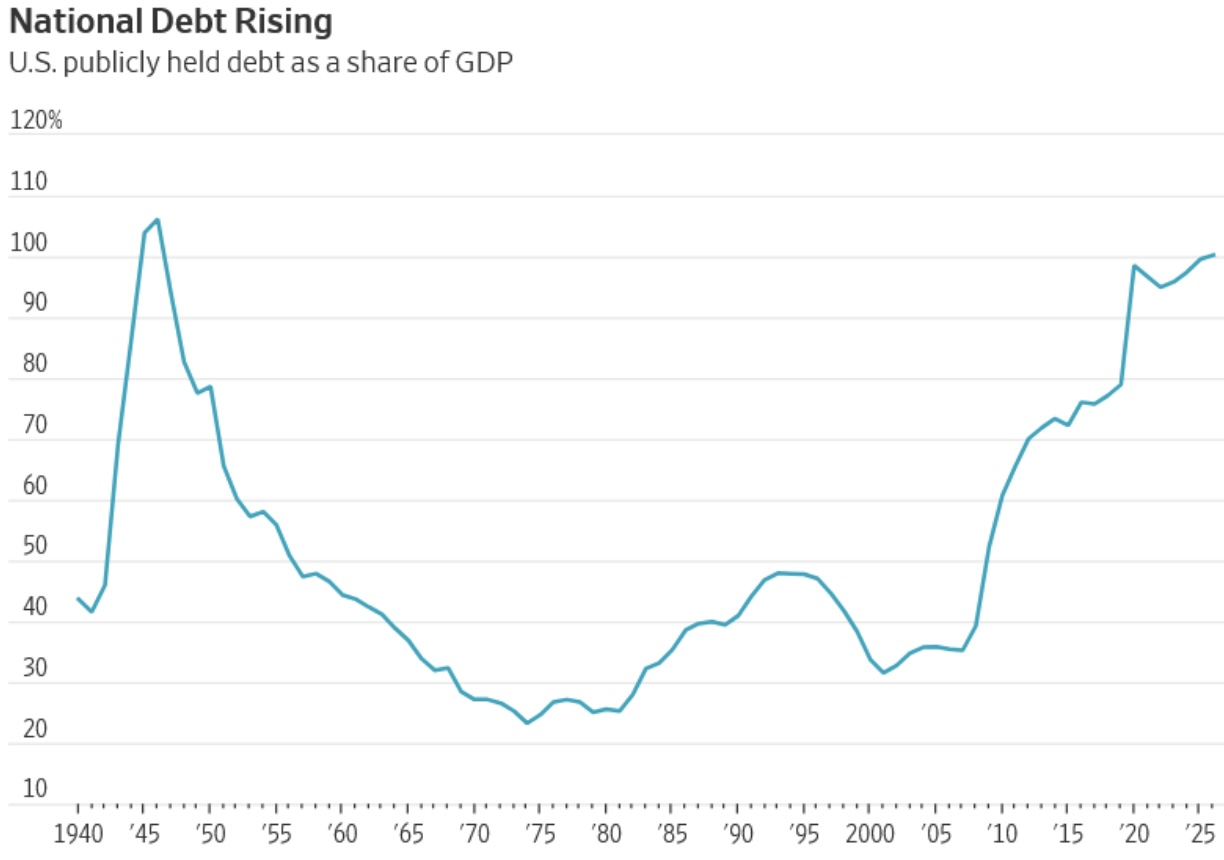
I believe the U.S. sovereign bond and debt crisis is only just beginning as investors recalibrate to a higher inflation environment and reduce their exposure to U.S. debt, which recently surpassed 100% of GDP, as I explained in a recent report:
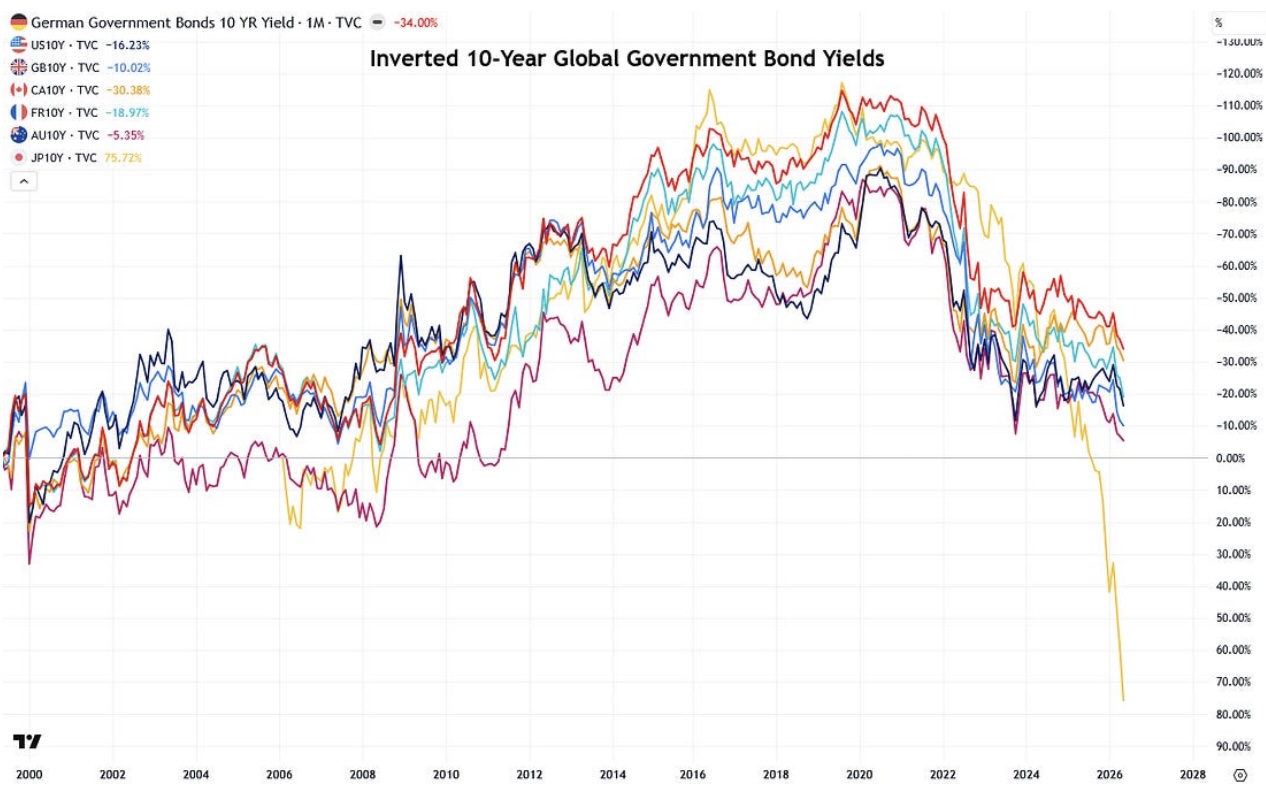
And in case you thought this bond selloff was just a U.S. phenomenon, think again, because it is truly global, as the chart below shows. Japan’s bond selloff, represented by the yellow line below, has been by far the worst among the major countries, which is unsurprising given its staggering government debt-to-GDP ratio of 249%.
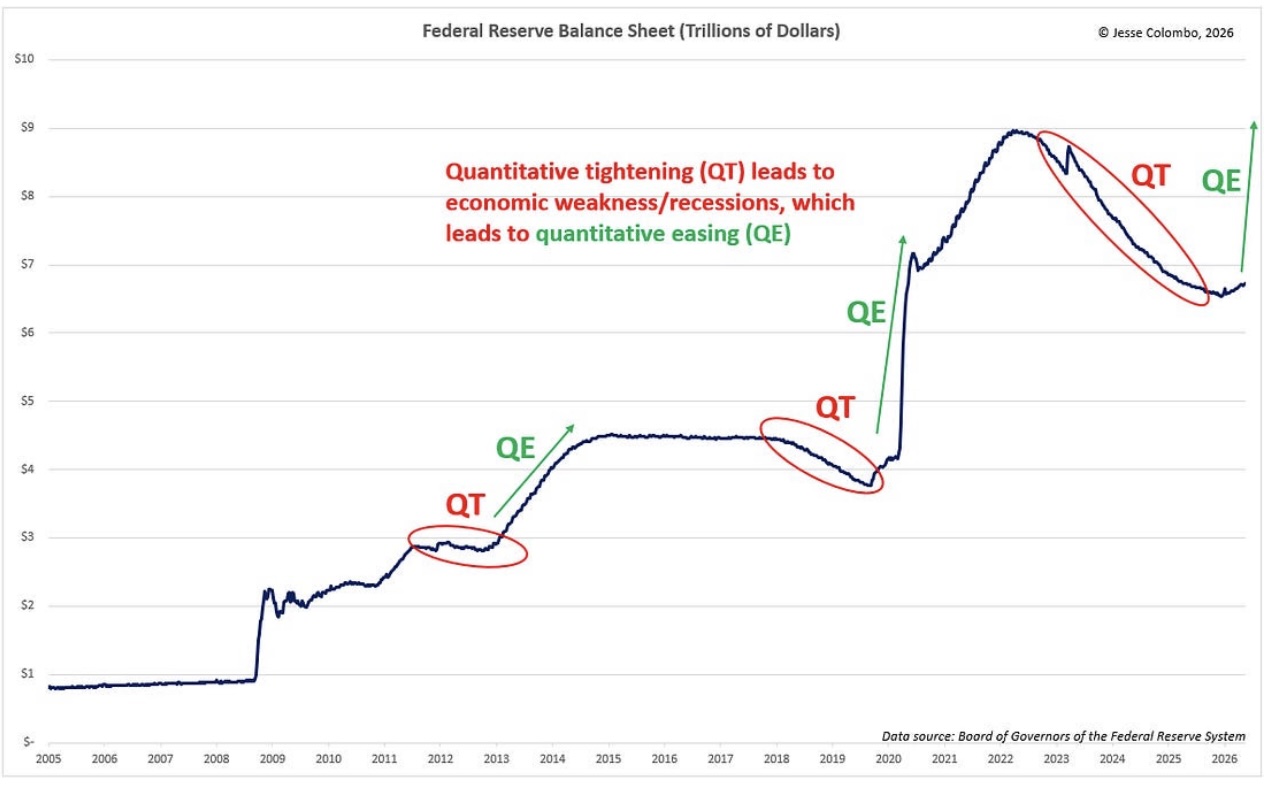
Assuming the global bond selloff continues, which would certainly be the case if oil prices move even higher, it is only a matter of time before global central banks are forced to support their own sovereign bond markets and economies through the digital printing press, i.e. quantitative easing (QE). That would, of course, expand the global money supply even further, intensify the inflation crisis, and send commodities including oil, gold, and silver significantly higher.
Such an outcome would cause the balance sheets of the Federal Reserve and other central banks to expand dramatically, surpassing even the peaks reached during the COVID-19 pandemic:
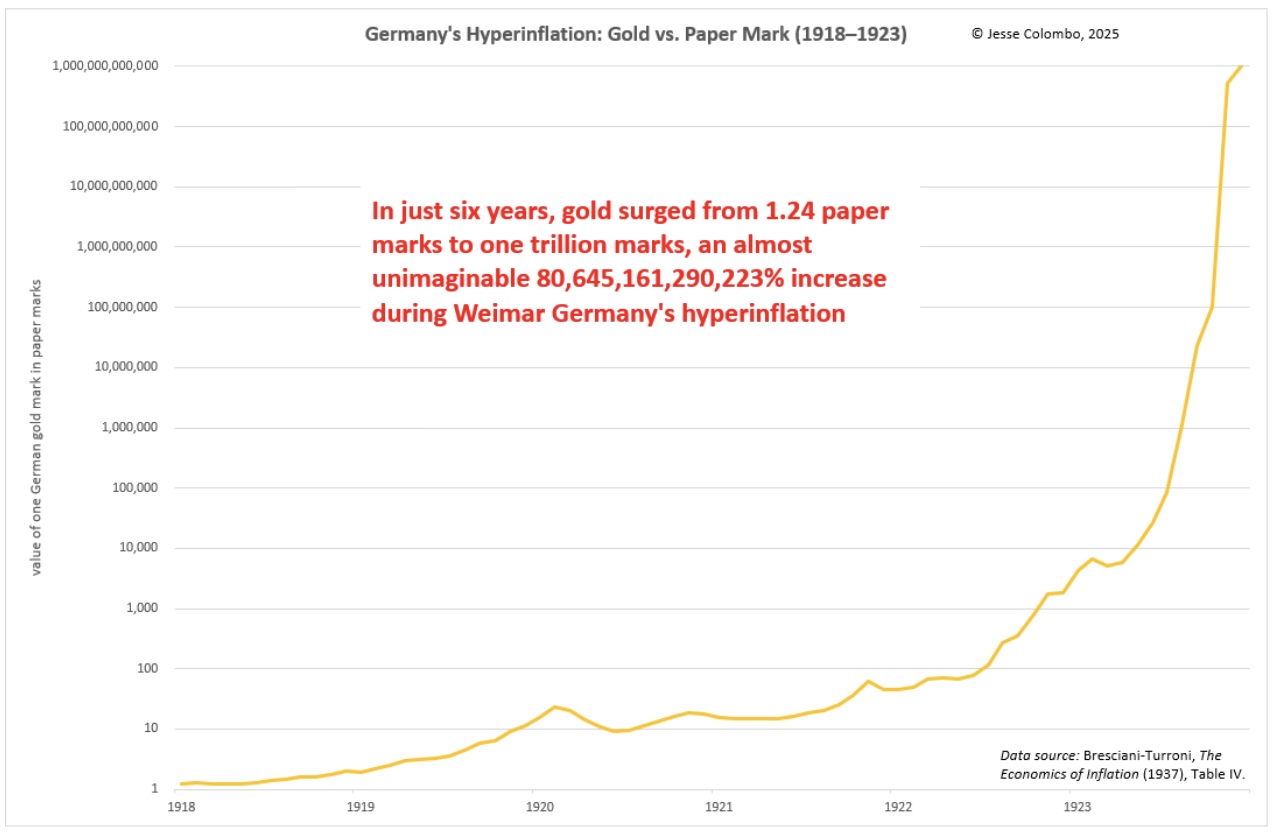
Ultimately, the endgame of such extreme levels of government debt — not to mention private debt — and the resulting actions by central banks to support their sovereign bond markets will be the destruction of fiat, or paper, currencies worldwide, leading to an outcome similar to Germany’s hyperinflation of the 1920s, when gold soared from just 1.24 paper marks to one trillion paper marks:
To wrap up this admittedly long report, I am closely watching the triangle pattern in crude oil as well as rapidly dwindling global oil inventories. If oil breaks out from the triangle and also clears the resistance zones overhead that I showed, there is a high probability that we will see $150+ per barrel oil, and that scenario is not nearly as far-fetched as it sounds considering how low oil prices still are when adjusted for inflation. Trust me, I do not want this scenario to come true, but it is highly congruent with the commodity supercycle that precious metals kicked off two years ago. KING WORLD NEWS NOTE: Jesse Colombo is correct that a break above the recent $120 high in WTI crude oil will kickoff a major upside thrust to the $150–$200 zone. Oil stocks will be a huge beneficiary of that move when it eventually unfolds.
The Bull Market In Stocks Is Gliding Along On A Winger And A Prayer
To listen to Rob Arnott discuss the US stock market bubble, what investors should be doing with their money, the economic shock from the Iran War as well as a massive inflation wave that is ahead of us CLICK HERE OR ON THE IMAGE BELOW.

Silver Buying Opportunity
To listen to Nomi Prins discuss the buying opportunity in gold, silver, and the mining stocks CLICK HERE OR ON THE IMAGE BELOW.

ALSO RELEASED!
World Economy “On Borrowed Time” As Massive Oil Crisis Looms CLICK HERE.
Take A Look At What Is Now Closing In On A 30 Year High! CLICK HERE.
Expect Violent Moves In Gold, Silver, Bonds And Stocks CLICK HERE.
This Is What A Boom Looks Like! Plus A Look At Another Collapse CLICK HERE.
Rob Arnott – This Bull Market In Stocks Is Gliding Along On A Winder And A Prayer CLICK HERE.
Nomi Prins – This Pullback In Silver Is A Tremendous Buying Opportunity CLICK HERE.
Food Inflation Running Hotter Than Ever, But Look At Gold & Silver CLICK HERE.
Iran War’s Worldwide Economic Shock To Worsen CLICK HERE.
More Good News For The Gold & Silver Markets, Plus Look At What Is Skyrocketing CLICK HERE.
They Are About To Unleash A Fairy Tale To Deceive People On Earth CLICK HERE.
BUCKLE UP: Massive Upside Silver Breakout Just Took Place CLICK HERE.
Gold Is Now The World’s Number One Reserve Currency CLICK HERE.
Gold & Silver Miners Are Shocking Wall Street, Plus Look At What Just Collapsed To Lowest Level In History! CLICK HERE.
Gold & Silver Poised To Soar After Lengthy Consolidation CLICK HERE.
Silver Will Skyrocket To $2,200 If This Ratio Hits 1980 Peak CLICK HERE.
© 2026 by King World News®. All Rights Reserved. This material may not be published, broadcast, rewritten, or redistributed. However, linking directly to the articles is permitted and encouraged.


