
Michael Oliver, the man who is well known for his deadly accurate forecasts on stocks, bonds, and major markets, communicated to King World News that investors should not believe the false notion that the gold trades opposite the US dollar.

October 7 (King World News) – Michael Oliver, Founder of MSA Research: 71.2% of this much-watched “index” is the Euro (at 57.6%) and the Japanese Yen (at 13.6%). Meanwhile, other major trading partners such as China, Brazil, Mexico, and South Korea aren’t even included in the index. But the Swedish krona and the Swiss franc are included, at a combined weighting of 7.8%. Why not include the Icelandic króna or the Tunisian dinar?
Our point is that this “index” merely shows the ups and downs in the relative value of the Dollar vs. basically two fiats—the Euro and the Yen. Of course, all three of those pieces of paper are competing with each other in their rate of decline in real value (i.e., buying power), which is clear from the verticality of their increasing money supply (or M2) charts. (MSA is considering no longer using this false metric of supposed Dollar “value” in our reports.)
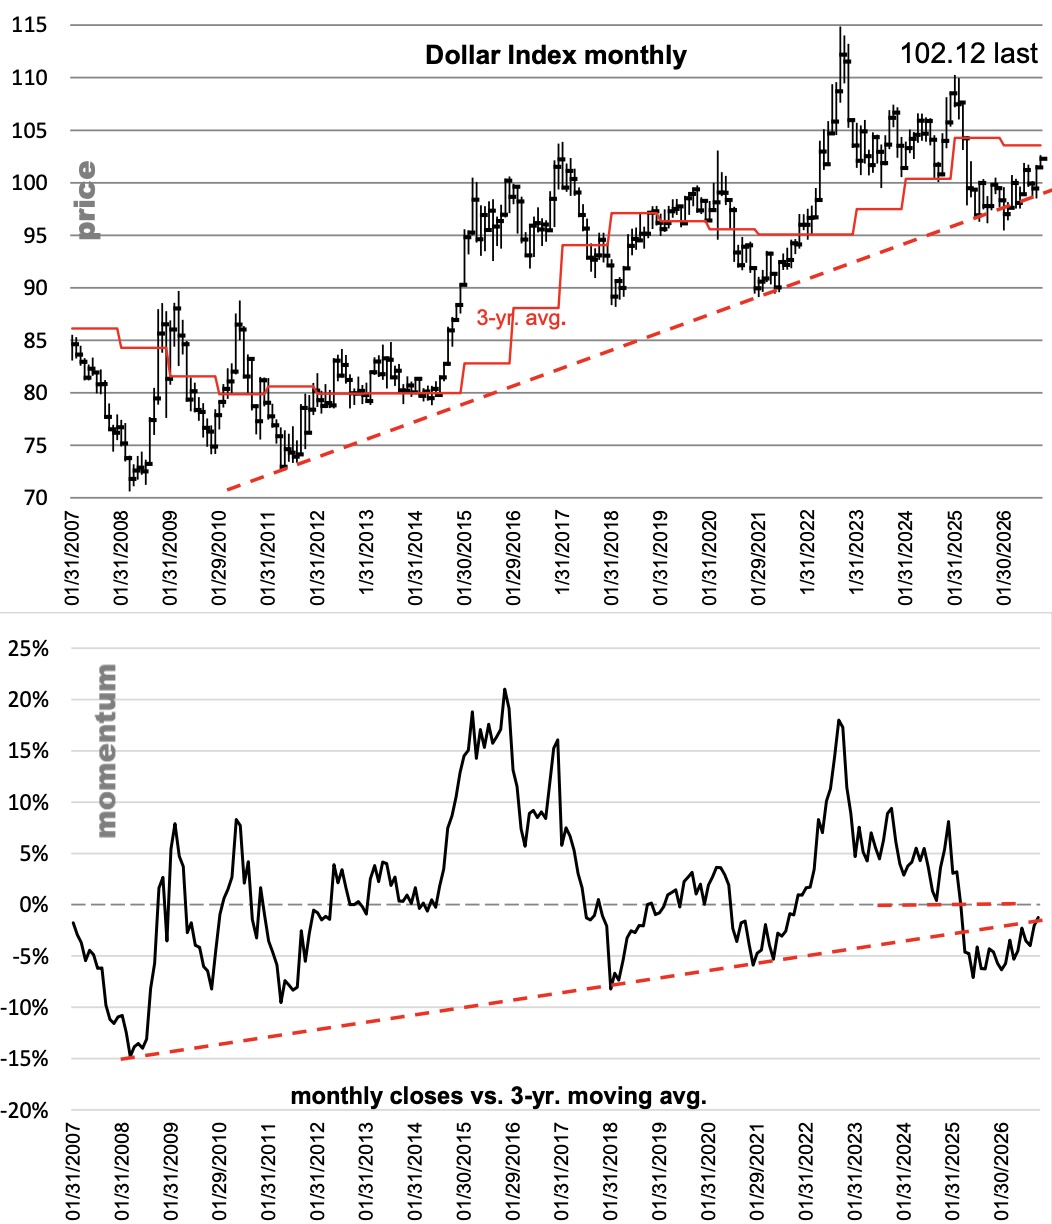
Since the sharp drop that followed MSA’s sell signal at the March 2025 close of 104.21, there has been a year and a half of rally effort. You can see why price chart “analysts” are still bullish and have been buying along a fifteen-year trend line for that year and a half. And they’ve made a measly few percent in the process. In this “upside” there was even a minor oops below that line. Note that the prior major lows that define that fifteen-year-old trend line tended to turn up fairly rapidly. This one has been a time-wasting crawl.
As for the very clear annual momentum trend (which is no more), it requires no comment. Momentum usually leads price.
Here’s yet another of those popular but false market assumptions that seem to prevail regardless of the lack of measurable reality.
And that assumption is that gold trends opposite the Dollar or (Dollar Index).
Since gold made its major bear market low in late 2015, it has more than quadrupled.
Over that same time, the Dollar Index has oscillated but basically held and is now several percent above its late 2015 high. So why the hell did gold go up?
KING WORLD NEWS NOTE: Gold Price Has More Than Quadrupled Since 2015 Low While US Dollar Index Has Traded Higher!
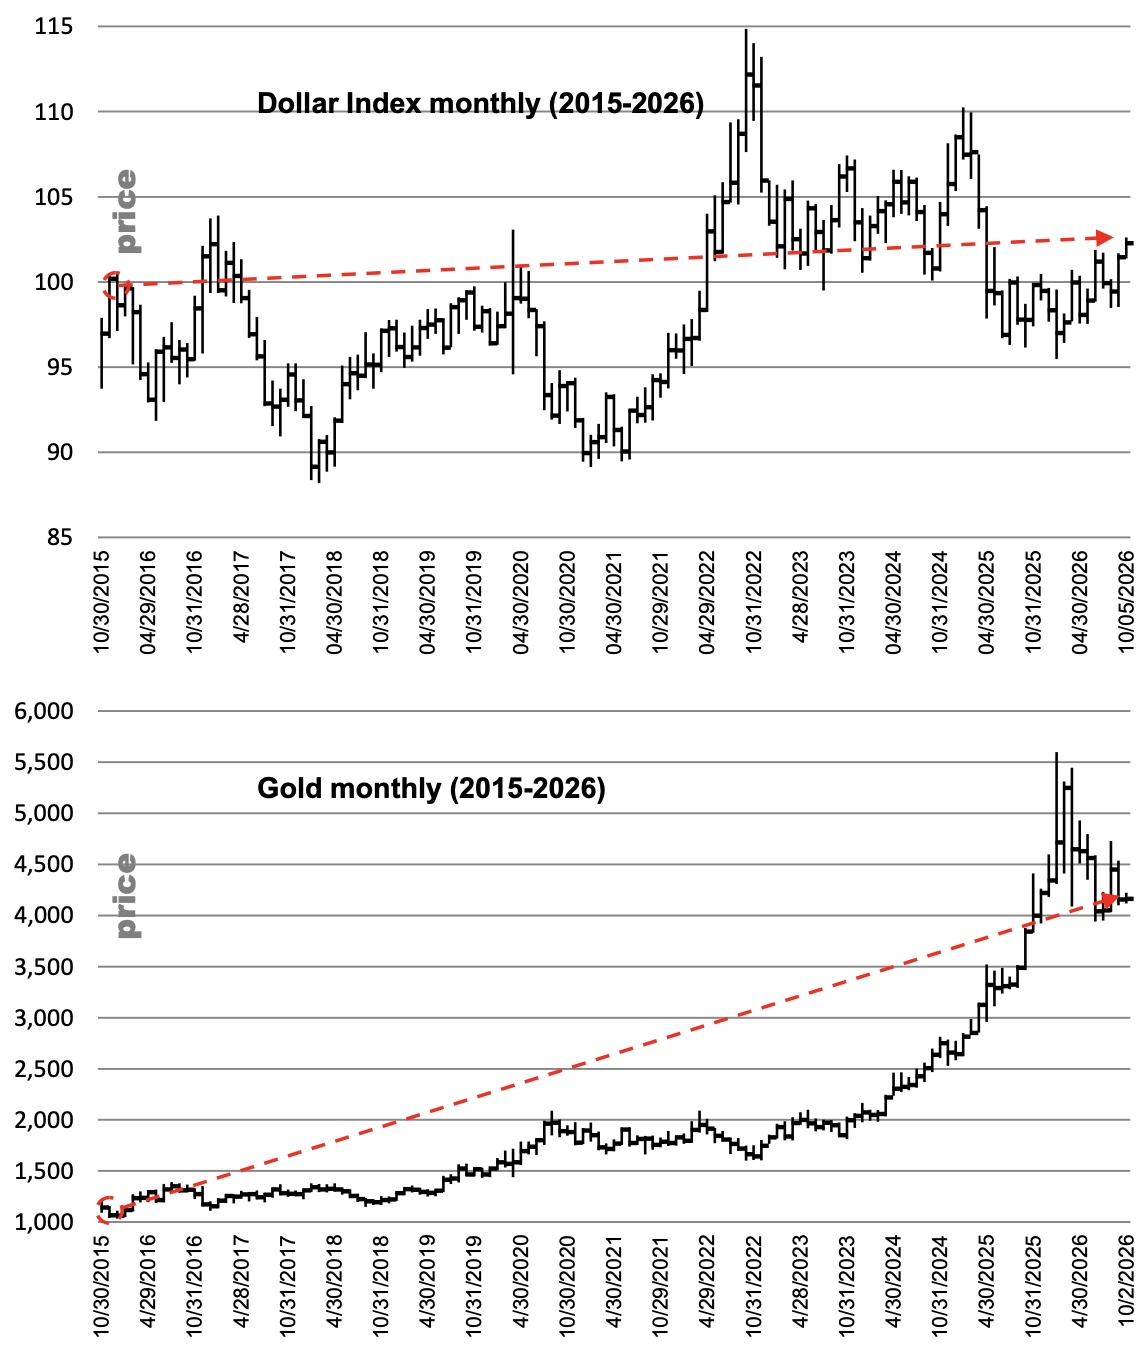
Ditch these tired and wrong assumptions, and look instead at an M2 chart to see a more accurate view of what the Dollar fiat has been doing over the decades in terms of losing real buying power, and then you’ll realize why gold (historical money) has been rising.
ALSO RELEASED!
VITOL CEO Warns Oil May Hit $200 As Fire Erupts At Saudi Arabia’s Largest Oil Field CLICK HERE.
Japan Is About to Nuke The Global Economy CLICK HERE.
$153,000 Gold And Billionaire Frank Giustra Warns US Dollar Collapse Is Coming CLICK HERE.
Look At Who Just Warned It’s Too Late To Save The US Bond Market CLICK HERE.
Forget Volatility As Gold Miners Coiled To Skyrocket CLICK HERE.
Gold & Silver Open Interest Remain Collapsed As War Rages In Crude Oil Countries CLICK HERE.
US Average Family Income In 1971 Was 252.2 Ounces Of Gold Or $1,053,623 At Today’s Price CLICK HERE.
RAY DALIO: US Debt Collapse Is Coming MICHAEL BURRY: The Big Short Is About To Repeat CLICK HERE.
© 2026 by King World News®. All Rights Reserved. This material may not be published, broadcast, rewritten, or redistributed. However, linking directly to the articles is permitted and encouraged.