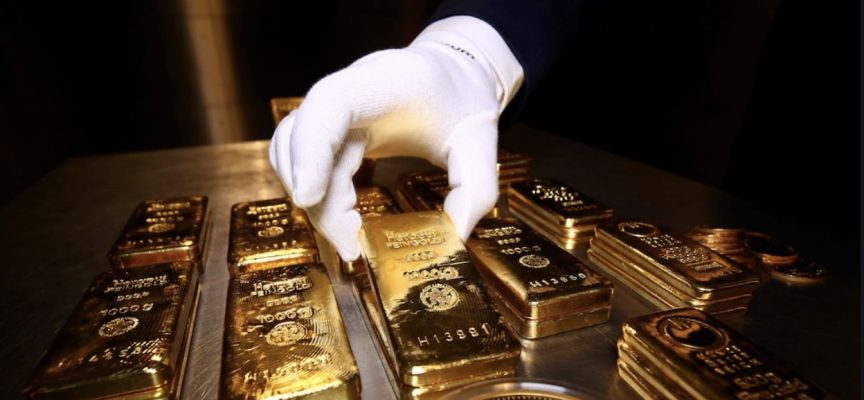
We are in the process of seeing a major gold bottom that is accompanied by doom and gloom while inflation continues to spike.
$2,410 Gold
August 11 (King World News) – Alasdair Macleod: This chart shows that the difference between M3 (the blue line) and the gold price (red line) is about 41% (the grey line — right hand scale). The point is that since the Lehman failure, gold has not been this cheap relative to broad money at a time when it is getting increasingly difficult for the Fed to control monetary expansion. And since gold bottomed in December 2015, gold’s discount to M3 has only approached these levels twice before.
If gold is to return to parity with M3, it implies a gold price of $2410. And that assumes M3 does not increase from current levels. I think we can be reasonably certain that the fed will do everything in its power to ensure M3 continues to expand.
US M3 Money Supply (BLUE LINE) vs
Price Of Gold (ORANGE LINE)
Gap Between Money Supply And Gold (GRAY LINE)
Indicates Gold Poised For Major Rally
Major Gold Bottom Accompanied By Doom & Gloom
Fred Hickey: Typically the more gloom & doom gold stories there are in the press, the more likely a major bottom approaches. MarketWatch Aug 15, 2018 headline: “Here’s Why Gold Might Die Out As An Investment,” Wall Street Journal July 17, 2015: “Let’s Be Honest About Gold: It’s a Pet Rock”…
Keith Neumeyer Just Predicted $100+ Silver And $3,000 Gold! TO LISTEN CLICK HERE OR ON THE IMAGE BELOW.
Inflation
Peter Boockvar: Headline CPI rose .5% m/o/m in July after a .9% increase in June. That was as expected after months of big upside surprises. The core rate was higher by .3% after a .9% spike last month but that was one tenth less than forecasted. Versus last year, headline inflation rose 5.4% and the core rate by 4.3%.
Core Price Inflation Highest In 30 Years
The core rate is now running at a 6.4% annualized pace over the past 6 months and is up by 5.9% from July 2019, an annual pace of just under 3%. Food prices rose .7% m/o/m and 3.4% y/o/y while energy prices were higher by 1.6% m/o/m and 24% y/o/y.
Rent And Other Inflation
While the methodologies are somewhat different, Apartment List said rents in July rose 2.5% from June. The BLS said Rent of Primary Residence was up just .2% m/o/m and Owners’ Equivalent Rent by .3%. So assume now that the big rent increases within the BLS data will only be playing catch up in the quarters to come because nowhere in real life were rents up just .2% in July from June and up by 1.9% y/o/y. Apartment List has rents up 11% just from January thru July while the BLS has OER higher by 2.4% y/o/y.
I point this sector out specifically because it is the biggest component of CPI at about 30% and around 40% of the core. Elsewhere within services medical care costs rose .3% m/o/m after one tenth declines in the two previous months and they are up just .3% y/o/y. It’s been medical care commodities that have kept a lid on things while the cost of physician and hospital services rose between 2.8-3.9% y/o/y. Airline fares saw no change m/o/m but are up 19% y/o/y on easy comps. Overall, services inflation ex energy rose .3% m/o/m and 2.9% y/o/y which really was the trend pre Covid but as stated, rent prices in this survey are about to quickly accelerate.
Core goods inflation rose .5% m/o/m and 8.5% y/o/y.
Core Goods Inflation Surges To 8.5%
That .5% gain comes after rather aggressive price increases in the prior months, specifically 2.2% in June and 1.8% in May. The price of used cars were up just .2% m/o/m but after a 10.5% spike in June and 7.3% gain in May. They are ‘only’ up 42% y/o/y. new car prices jumped 1.7% in the month after a 2% increase in June and are now higher by 6.4% y/o/y. Apparel prices were flat m/o/m but after a .7% gain in June and 1.2% rise in May. They are higher by 4.2% y/o/y.
Bottom Line
Bottom line, while we might get some further slowing in used car prices as that seems to be a poster child for the current bout of inflation and a noted talking point of those in the transitory camp, the cost of housing within the government numbers have a lot of catching up to do with reality and thus this inflation story is going to continue so don’t rest easy. The problem also here is that inflation is running faster than wages so we have a drop in REAL wages which is economically contractionary and AGAIN why stable prices is the precursor to strong growth and employment and thus the Fed’s sole focus on the labor market is wrongheaded.
***ALSO JUST RELEASED: Gold’s Major Bottom, More Transitory Inflation, Record Lows And Another Interesting Gold Indicator CLICK HERE.
***ALSO JUST RELEASED: GOLD SMASH: The Gold Market’s “Why Me?” Moment And The Dark Side Of Manipulation CLICK HERE.
One Of The Most Important Interviews Of 2021
To listen to one of the most important interviews of 2021 with Michael Oliver discussing gold, silver, and mining stocks CICK HERE OR ON THE IMAGE BELOW.
© 2021 by King World News®. All Rights Reserved. This material may not be published, broadcast, rewritten, or redistributed. However, linking directly to the articles is permitted and encouraged.


