

What we are witnessing right now has only happened a handful of times since 1928.
Where’s The Pullback?
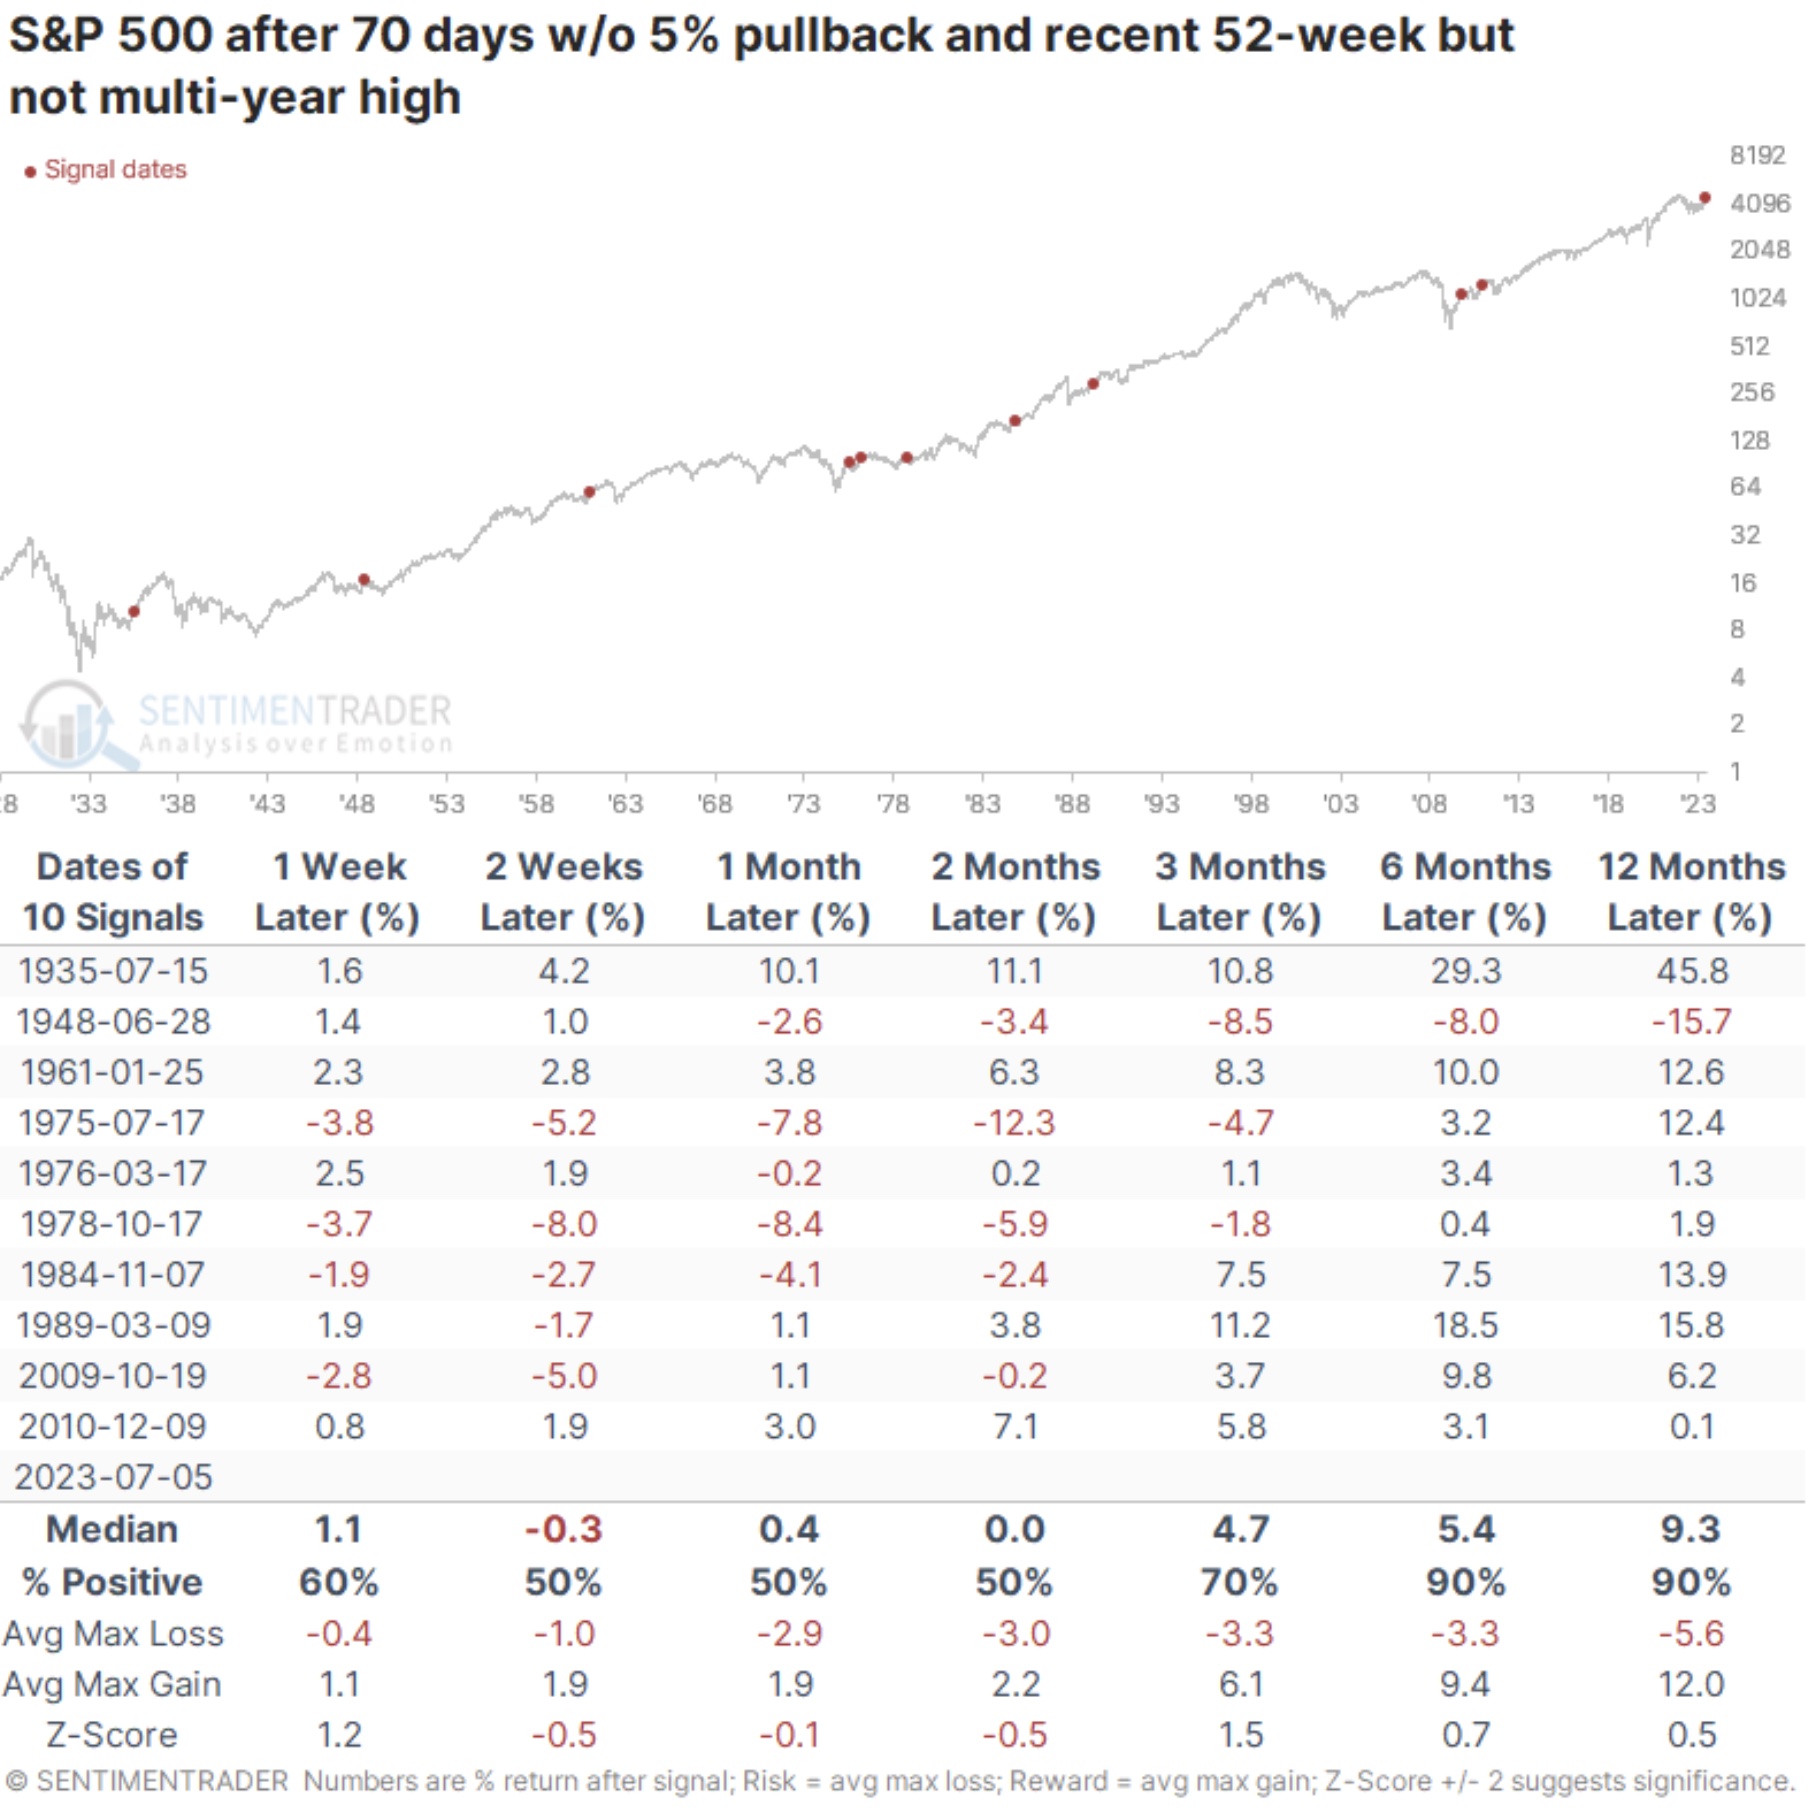
July 10 (King World News) – Jason Goepfert at SentimenTrader: It’s been months since even a minor pullback.
Key points:
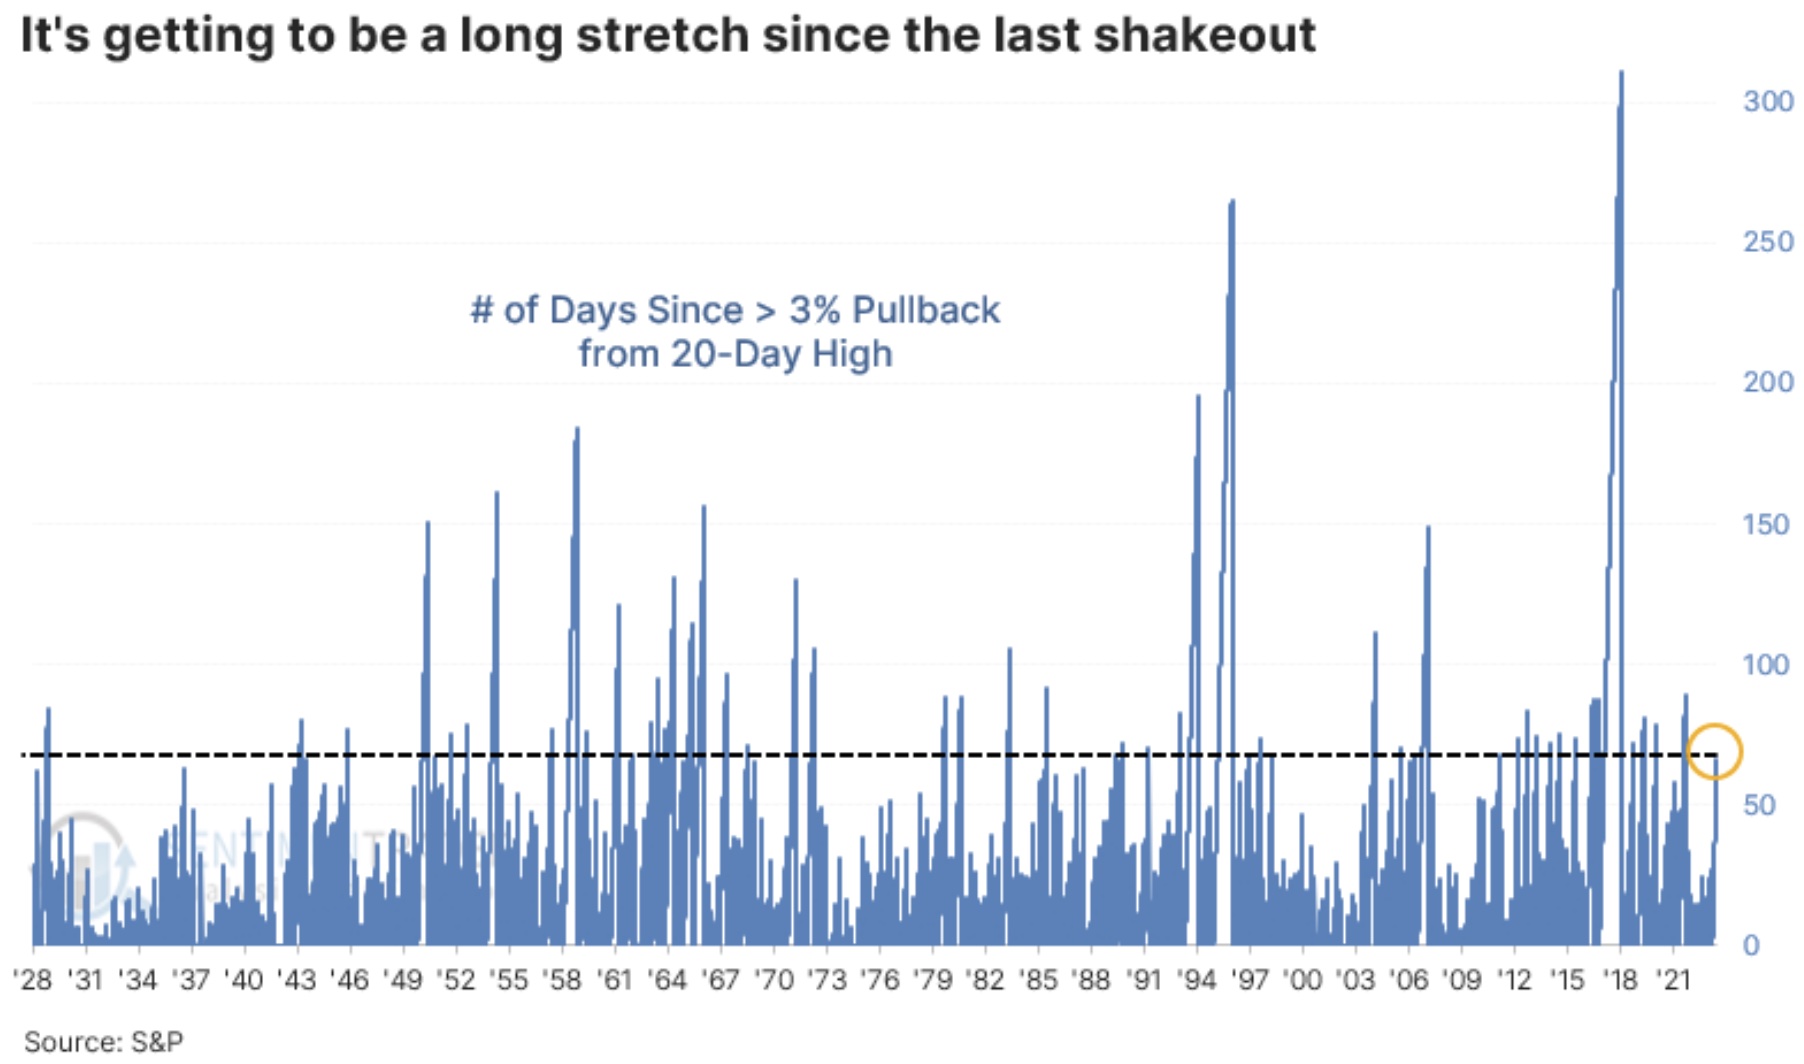
- The S&P 500 has gone months without even a 3% pullback
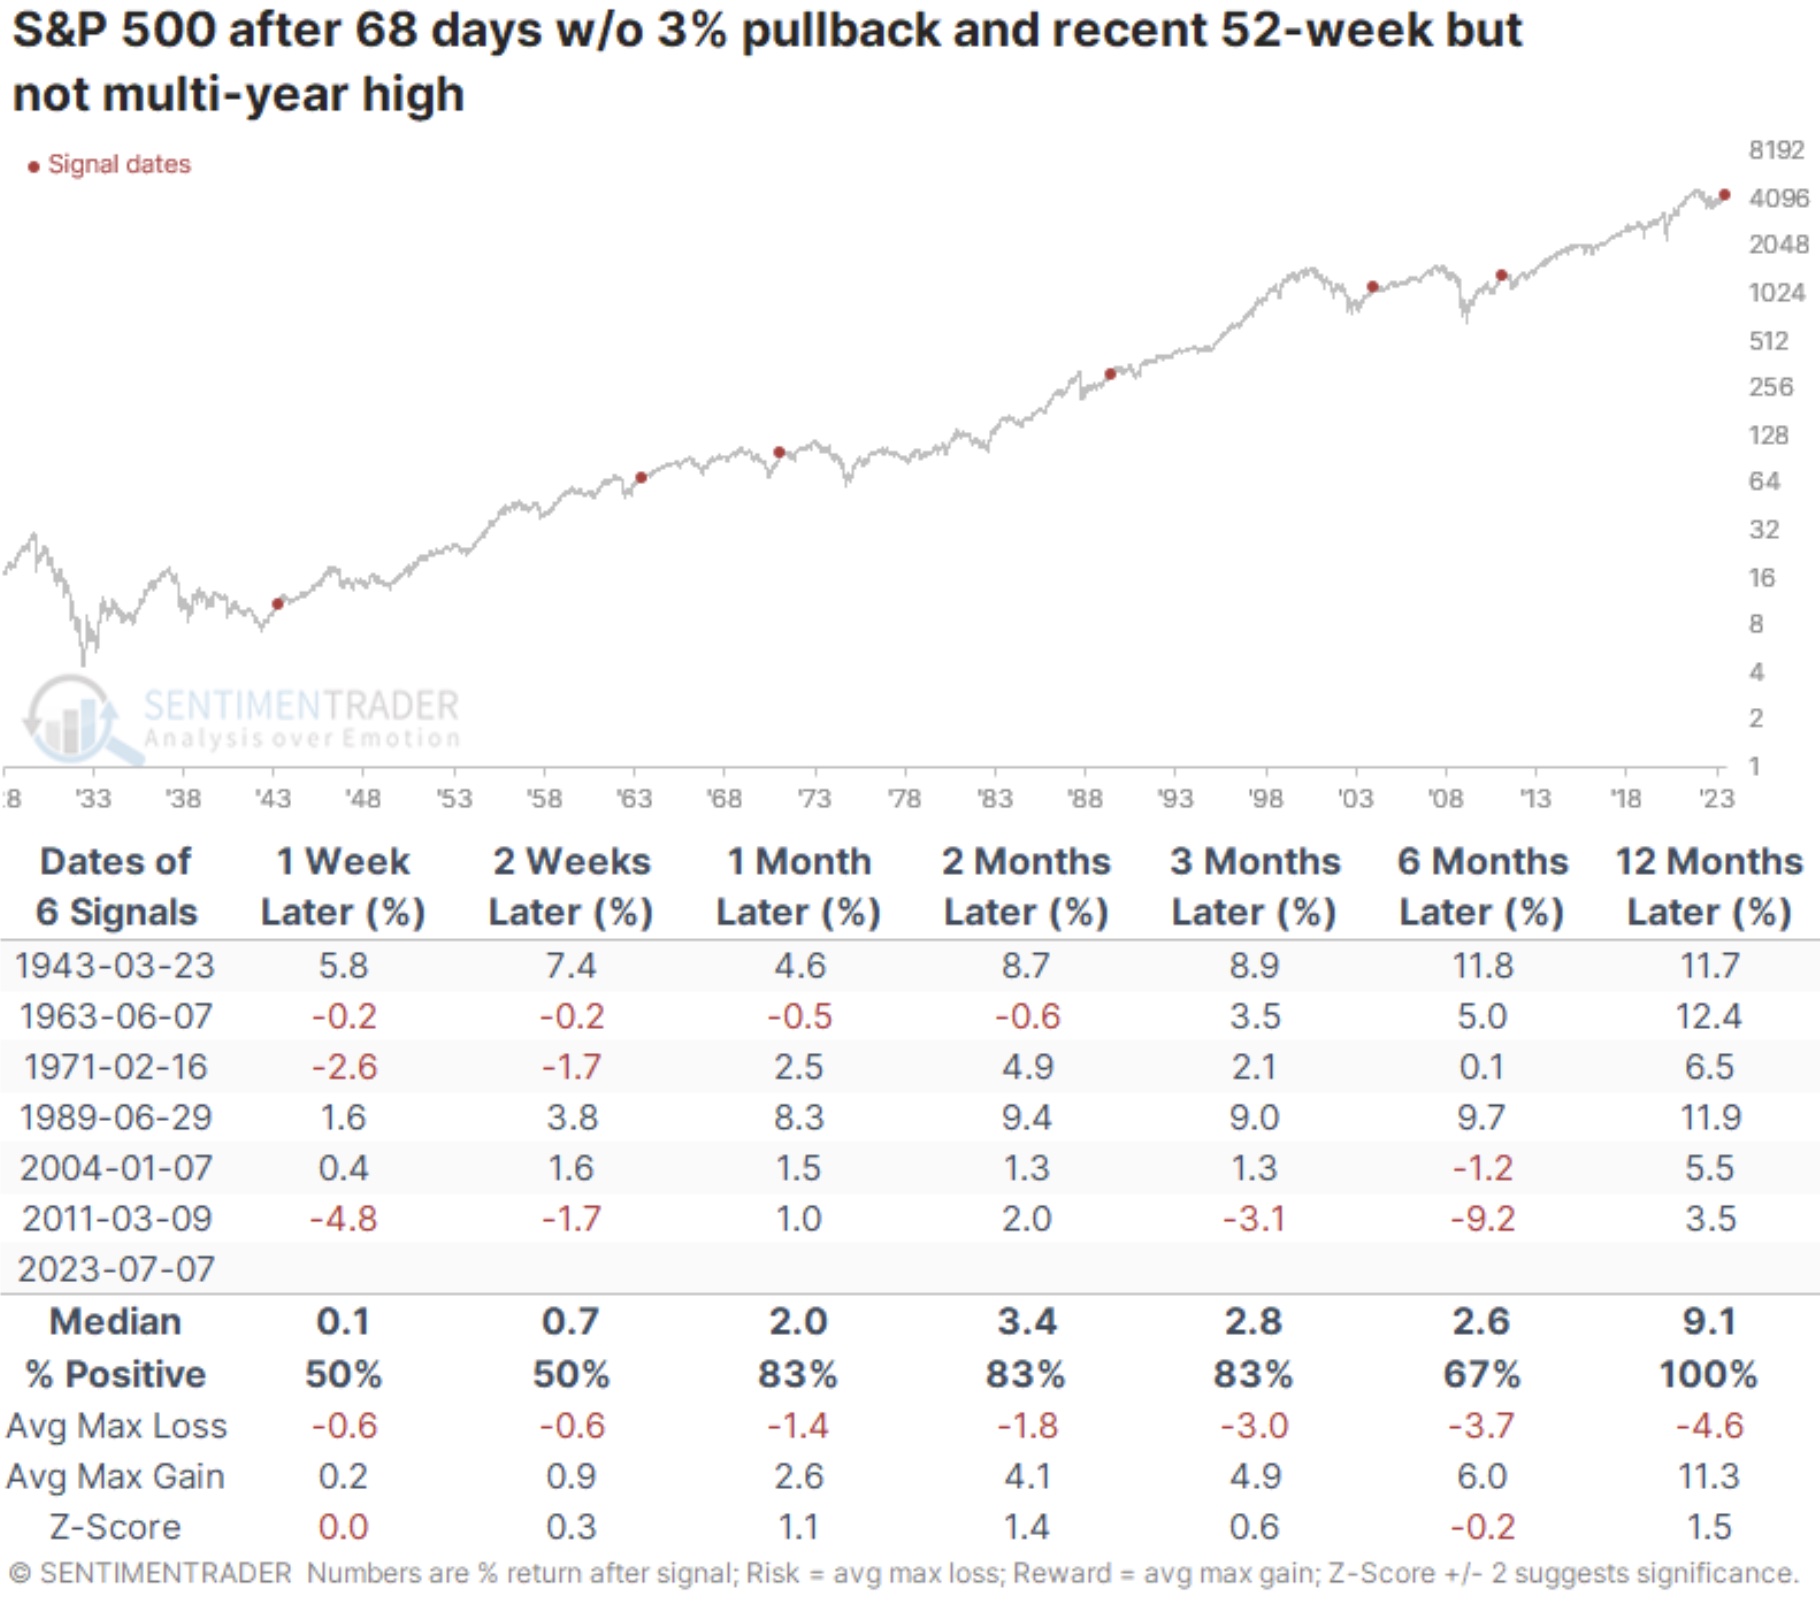
- When such calm conditions persist with the index at a 52-week high, they tend to persist
- It has been more common to see an imminent pullback when the calm stretch occurs at a multi-year high
It has been a while since investors suffered even a minor pullback
Investors have become a lot more confident over the past couple of months, and it’s no wonder why. The most benchmarked index in the world has barely taken a step back for months, with no pullbacks larger than 5%, or even 3%, since March.
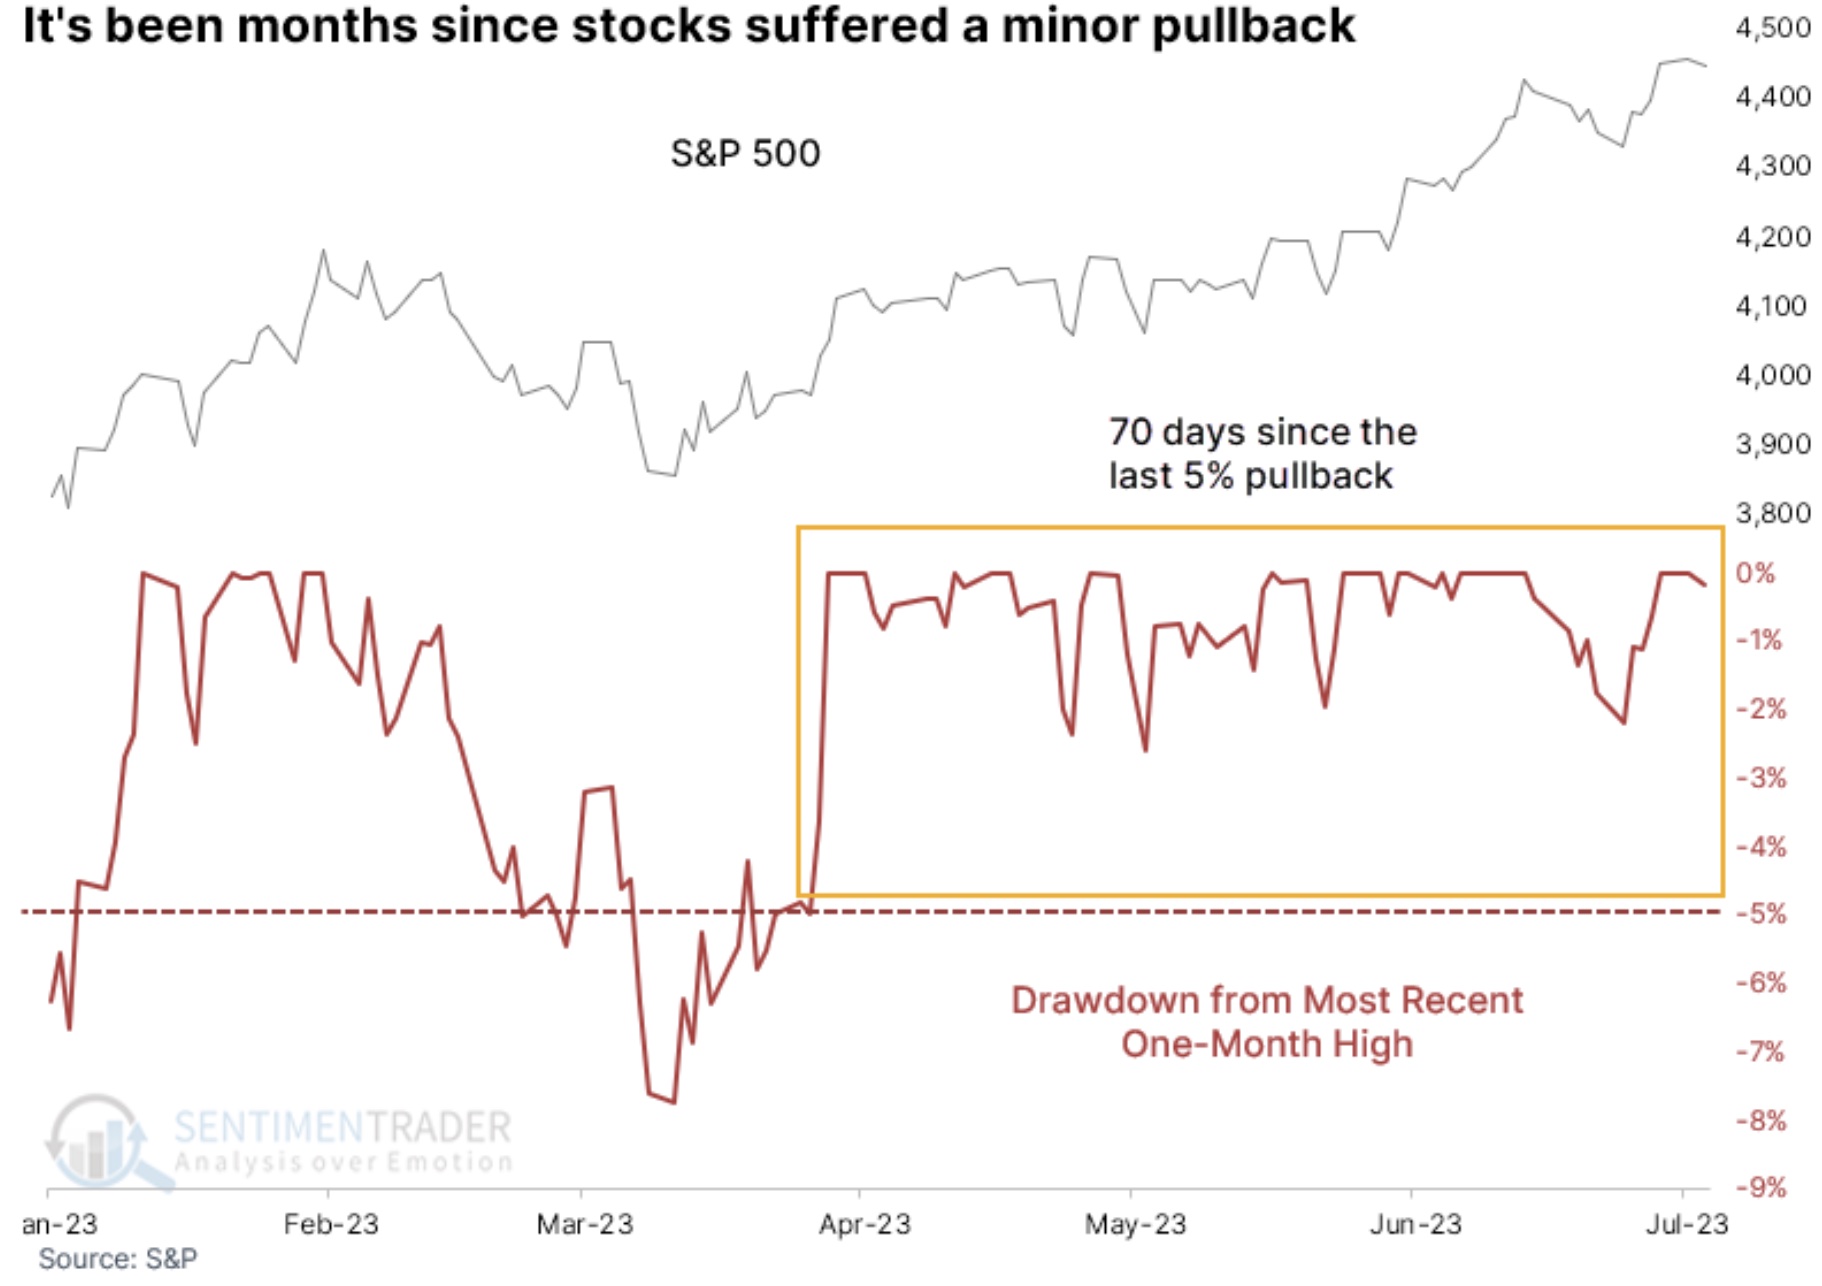
For these purposes, a “pullback” means we are looking at the maximum decline in the S&P 500 from its most recent 20-day high. When a new 20-day high is set, the pullback clock gets reset. The current streak of 68 days since the last 3% pullback ranks in the top 7% of all streaks since 1928.
This low-volatility behavior often signals extreme confidence when stocks are trading at multi-year or all-time highs. And that confidence has often resulted in a quick slap in the face for those who were so confident. Over the next 2-4 weeks, the S&P consistently pulled back, with poor returns.
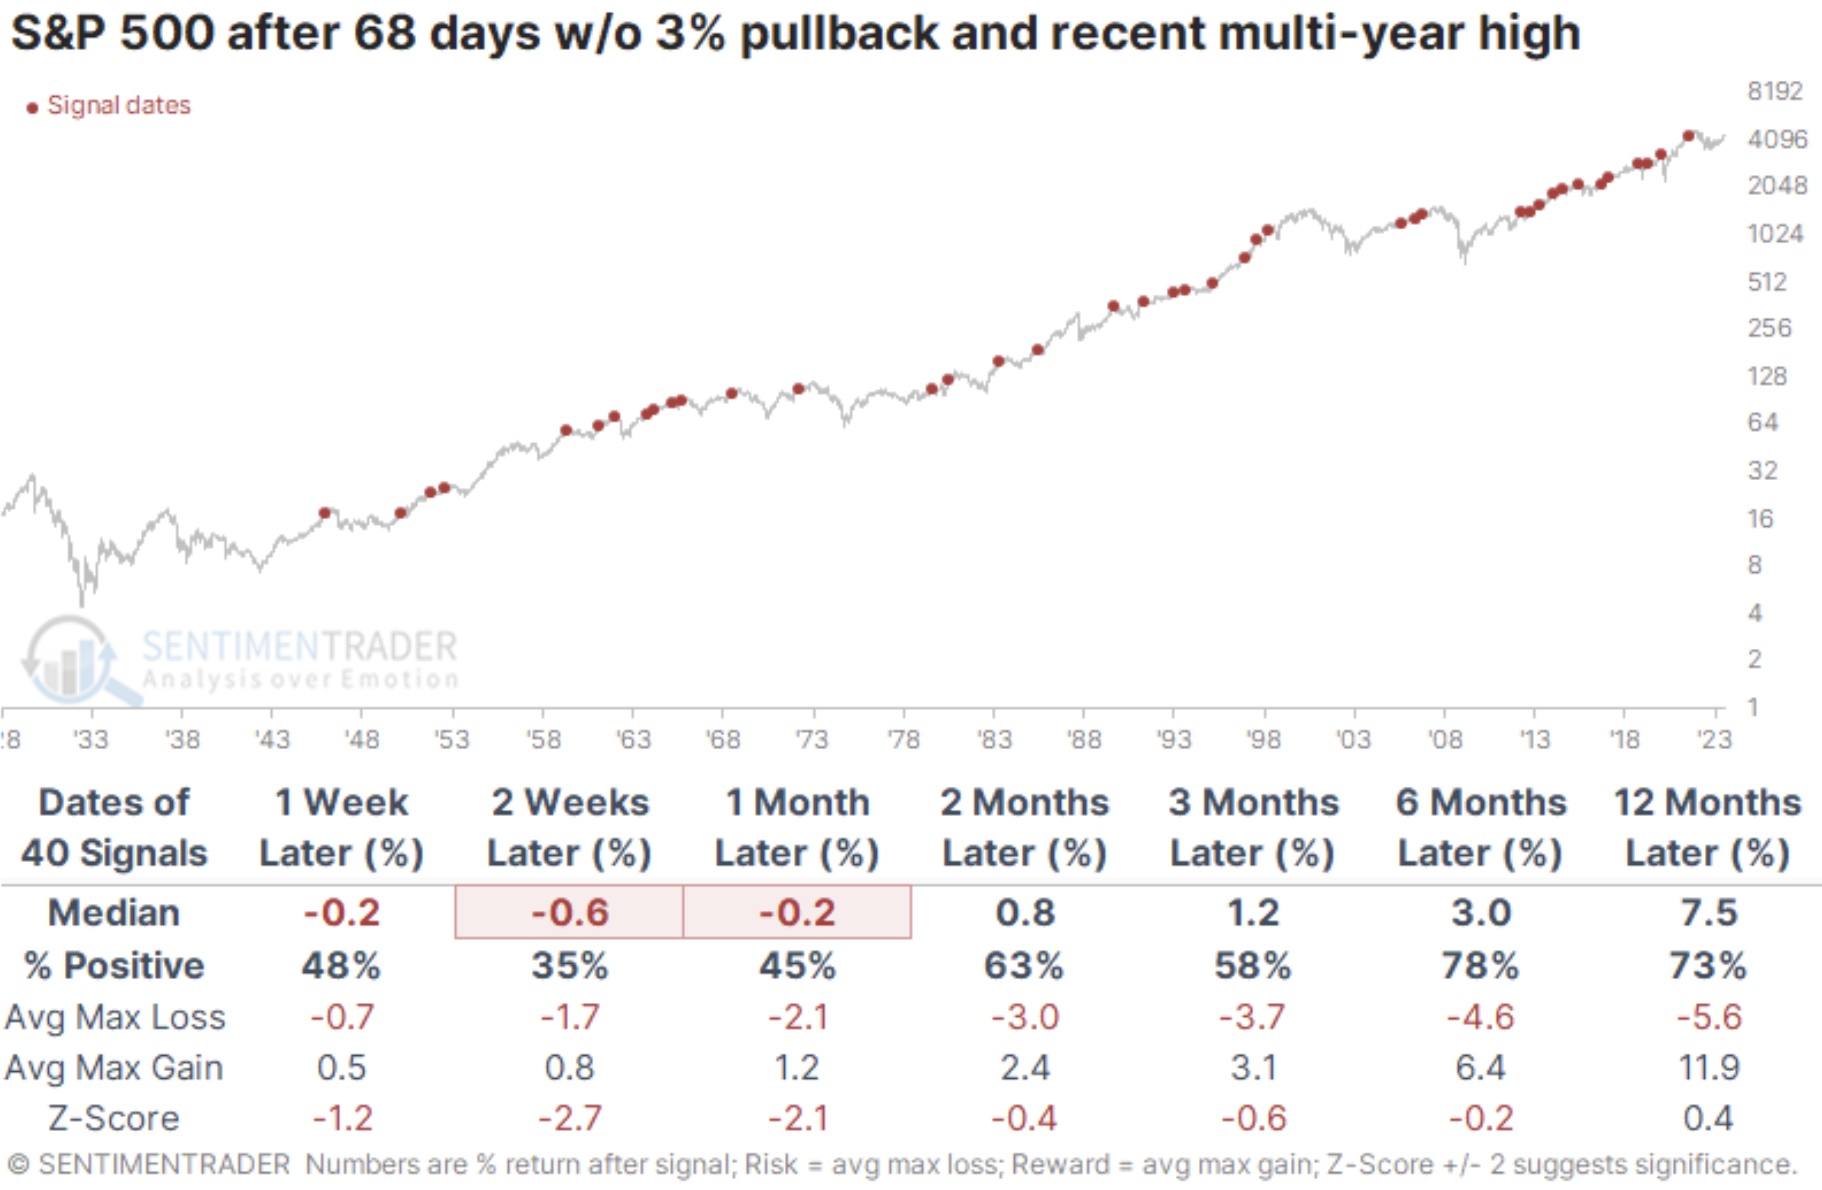
But that doesn’t apply now because the index has traded at a one-year but not multi-year high. This is similar to what we’ve witnessed when coming out of protracted declines, like after the last two great bear markets. And it also means the sample size constricts significantly, with only a handful of precedents since 1928…
ALERT:
Powerhouse merger caught Rio Tinto’s attention and created a huge opportunity in the junior gold & silver space CLICK HERE OR ON THE IMAGE BELOW TO LEARN MORE.

Because of the tiny sample size, we have to be more cautious of a conclusion, but at least they were pretty consistent in their message. The S&P had a compelling record of rising after this behavior, with relatively limited risk compared to potential reward in the months ahead. The only one that showed more risk than reward occurred in 2011.
The lack of a 3% pullback is a tough hurdle to cross, but the sample size doesn’t increase too much, even if we expand it to a 5% pullback. There were still only ten precedents since 1928, with essentially the same conclusion. Over the next 6-12 months, only a single signal witnessed a loss, though that loss was fairly significant.
What the research tells us…
Calm conditions always make contrarians nervous. When those calm conditions exist for months at a time, with stocks continually hitting new highs, that anxiety is often rewarded, as stocks tend to become more volatile soon afterward. But when markets have not been hitting multi-year highs, it has more often occurred as markets move from a period of high volatility to lower volatility, and those conditions have a better record of continuing for months as opposed to ending imminently. This is another example of why Jason Goepfert is the best in the world at what he does – providing actionable market data. To subscribe to the internationally acclaimed work Goepfert produces at SentimenTrader CLICK HERE.
ALSO JUST RELEASED: Calm Markets But Here Is The Big Surprise Of The Day CLICK HERE.
ALSO JUST RELEASED: BRICS Countries Continue Massive Gold Buying Spree CLICK HERE.
ALSO JUST RELEASED: Interview With The Man Who Correctly Predicted Russia & BRICS Would Launch Gold-Backed Currency CLICK HERE.
To listen to the man who correctly predicted the BRICS would launch a gold-backed currency CLICK HERE OR ON THE IMAGE BELOW.

© 2023 by King World News®. All Rights Reserved. This material may not be published, broadcast, rewritten, or redistributed. However, linking directly to the articles is permitted and encouraged.


