

Sprott just warned that the price of gold is likely to gap higher as physical demand increases and available supply dwindles.
King World News has just released Gerald Celente’s latest audio interview discussing the gold market as well as major world events (linked at the bottom of this article). But first…
Gold’s Record-Setting Quarter and Silver’s Resurgence
July 21 (King World News) – Paul Wong, Market Strategist at Sprott Asset Management: Gold’s record-setting quarter and silver’s resurgence.
Key Takeaways
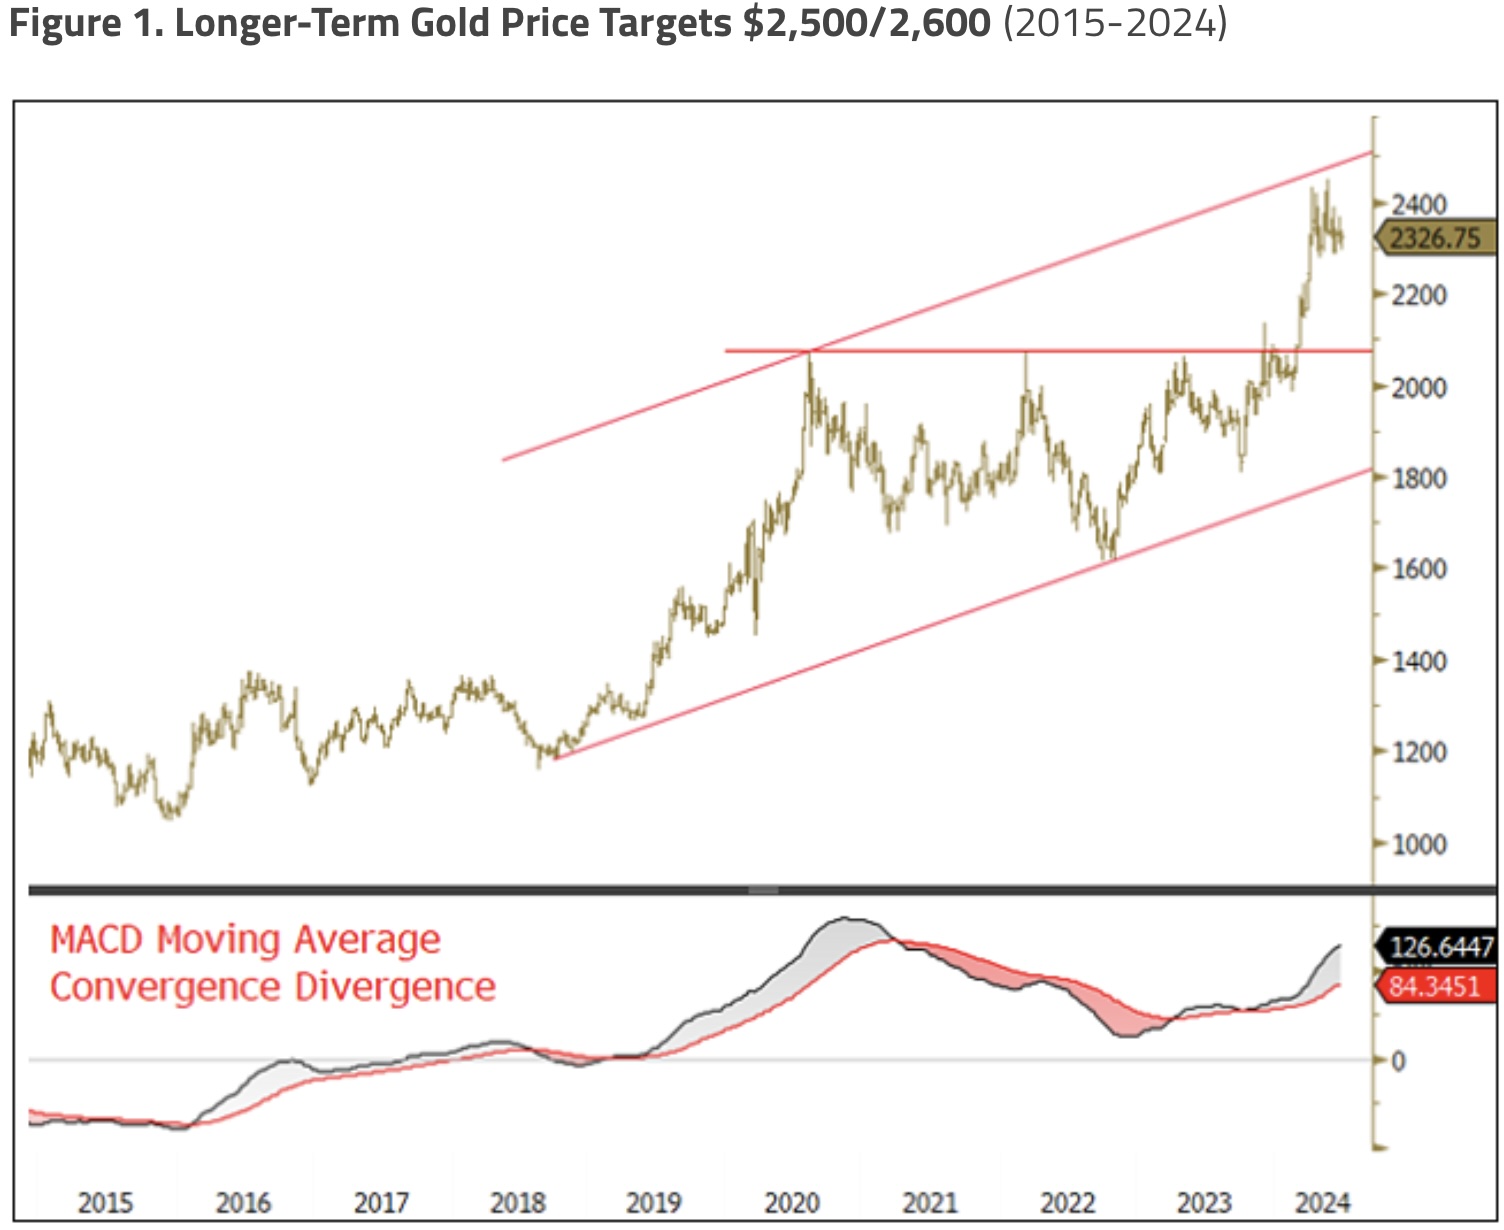
- Gold is up 12.79% year-to-date as of June 30, its best six-month start since 2020. In Q2, gold bullion posted new all-time highs and closed at $2,326.75 as of June 30. Buying from central banks continues to pace gold higher. (As of this writing, gold has topped $2,450.)
- A significant shift in central bank reserves is continuing, with anticipation of further increases in gold reserves along with a reduction in USD reserves is expected. A majority of central banks now view gold as a strategic asset.
- Silver closed Q2 at $29.14, its highest quarterly close since Q3 2012. The rise in silver was supported by the gold breakout and global monetary expansion policies, with a notable breakout above the $29-$30 resistance level.
- Growth estimates in photovoltaic panel usage have been markedly revised higher, resulting in silver demand draws far exceeding supply. A price squeeze within a few years is becoming more likely.
Market Review
Gold bullion increased $96.88 (or 4.34%) to close at $2,326.75 for the second quarter ending June 30, 2024. On massive central bank and sovereign buying, gold reached an intraday all-time high of $2,450.07 ($2,425.31 closing price) in Q2. Year to date, gold is up 12.79%, its best six-month start since 2020. Despite reaching very overbought short-term readings, the longer-term technical chart improved dramatically (see Figure 1). (As of this writing, gold has moved above $2,450 and is up 19.69% YTD as of 7/16/2024.)
After a solid start to the quarter, gold began to trade sideways after the People’s Bank of China (PBoC) reported a pause in gold purchases for May and June following 18 consecutive months of buying. Though China is by far the largest buyer of gold among central banks, from Q3 2022 to Q1 2024, China accounted for an estimated 33% of all central bank net purchases, according to World Gold Council (WGC) data. While China may have paused its purchases, other central banks were buying (notably India, Poland, and the Czech Republic), indicating that the official sector’s buying remains broad-based, likely providing a floor price on gold.
Investment funds increased their holdings in the second quarter as Commodity Future Trading Commission (CFTC) net non-commercial gold positions increased by 16.5% (or 3.4 million equivalent ounces) despite prices mainly moving sideways for the quarter and high interest rates maintaining high carry and opportunity costs. Gold held in ETFs fell again in the quarter by 1.5%, or 1.12 million, ounces despite higher gold prices, a trend that began in the second half of 2022, when central banks started their gold-buying drive. Rather than a sign of weakness, we believe it is a sign that central banks are buying gold, which we will discuss later.
Silver had a better second quarter than gold, rising $4.18/oz (or 16.74%) to close at $29.14, its highest quarterly close since Q3 2012. Silver staged a major technical chart break of the $29-$30 resistance during the quarter. Silver benefitted from the gold breakout and a resumption of global monetary expansionary policy as the central bank rate-cutting cycle commenced, along with the accompanying breakout of industrial metals (notably the major copper price breakdown).
World Gold Council 2024 Central Bank Gold Reserves Survey
The 2024 Central Bank Gold Reserves Survey by the World Gold Council (WGC)7 provides significant insight into the buying intentions and perspectives of central banks, which have been the primary price setters of gold bullion since the third quarter of 2022. The WGC Survey reaffirms that central bank reserve managers plan to increase their gold holdings further. They cite gold’s role as a long-term store of value and inflation hedge, its strong performance during times of crisis, its function as a portfolio diversifier and its immunity to default risk. The WGC Survey indicates that these results occur against a backdrop of geopolitical tensions (including the Middle East, the Russia-Ukraine war and U.S.-China trade tensions) and macroeconomic stress factors, including high inflation and uneven global growth. These combined geopolitical and macroeconomic concerns are reflected in interest rate levels, inflation concerns and geopolitical instability within the WGC Survey.
Strategic Considerations in Reserves Management
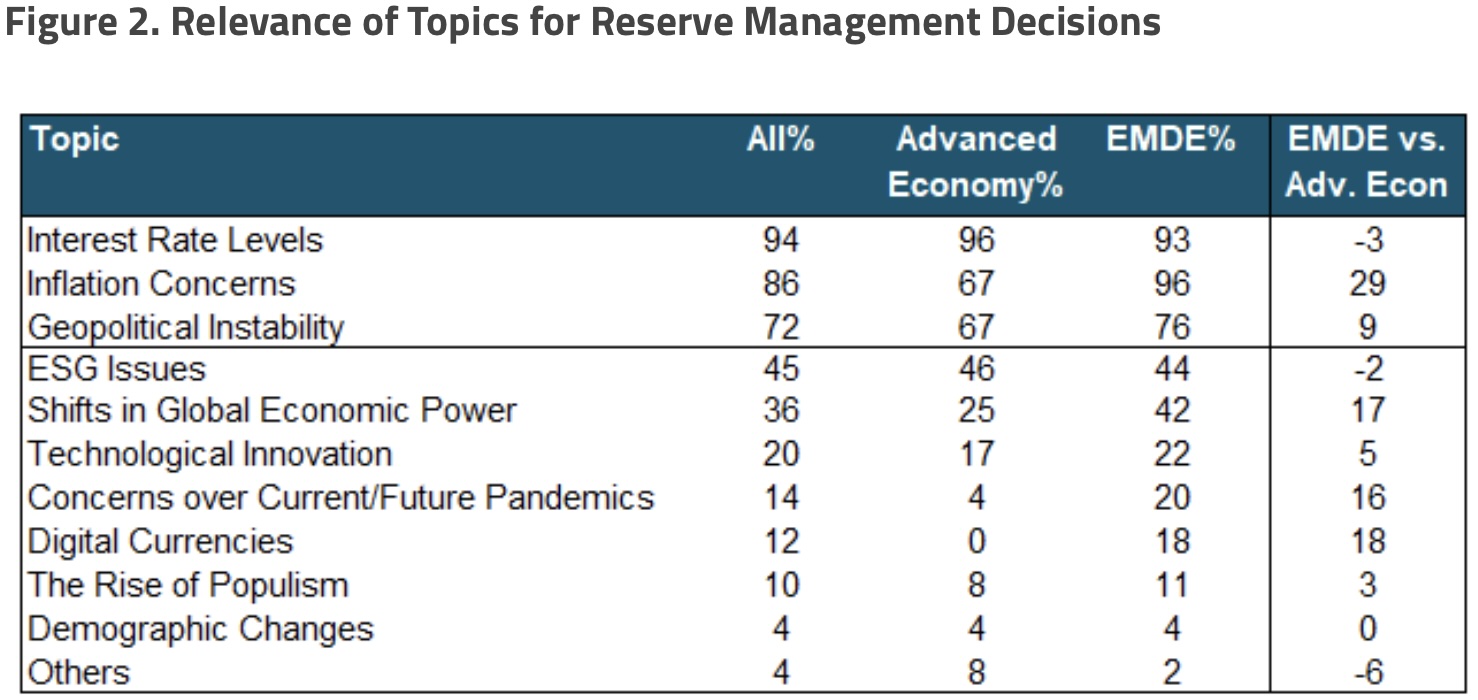
The WGC Survey identified several factors influencing reserve management decisions. The WGC Survey highlighted that the top three considerations were interest rate levels, inflation concerns and geopolitical instability (see Figure 2), continuing the primary concerns from 2023. However, there is a notable difference in relevance. EMDE (emerging market and developing economy) central banks are far more concerned about inflation, geopolitical instability and shifts in global economic power — conditions generally beyond their control. Additionally, EMDE central banks consider factors such as systematic financial risk, political risk, sanctions and potential changes in the international monetary system to be more relevant than those of advanced economies. Both groups highly value factors like effective portfolio diversification, performance during times of crisis and gold being a highly liquid asset. Where EMDE and advanced economies are converging is in recognizing gold’s increasing role as a reserve asset.
Lower Levels for USD and Higher Levels for Gold
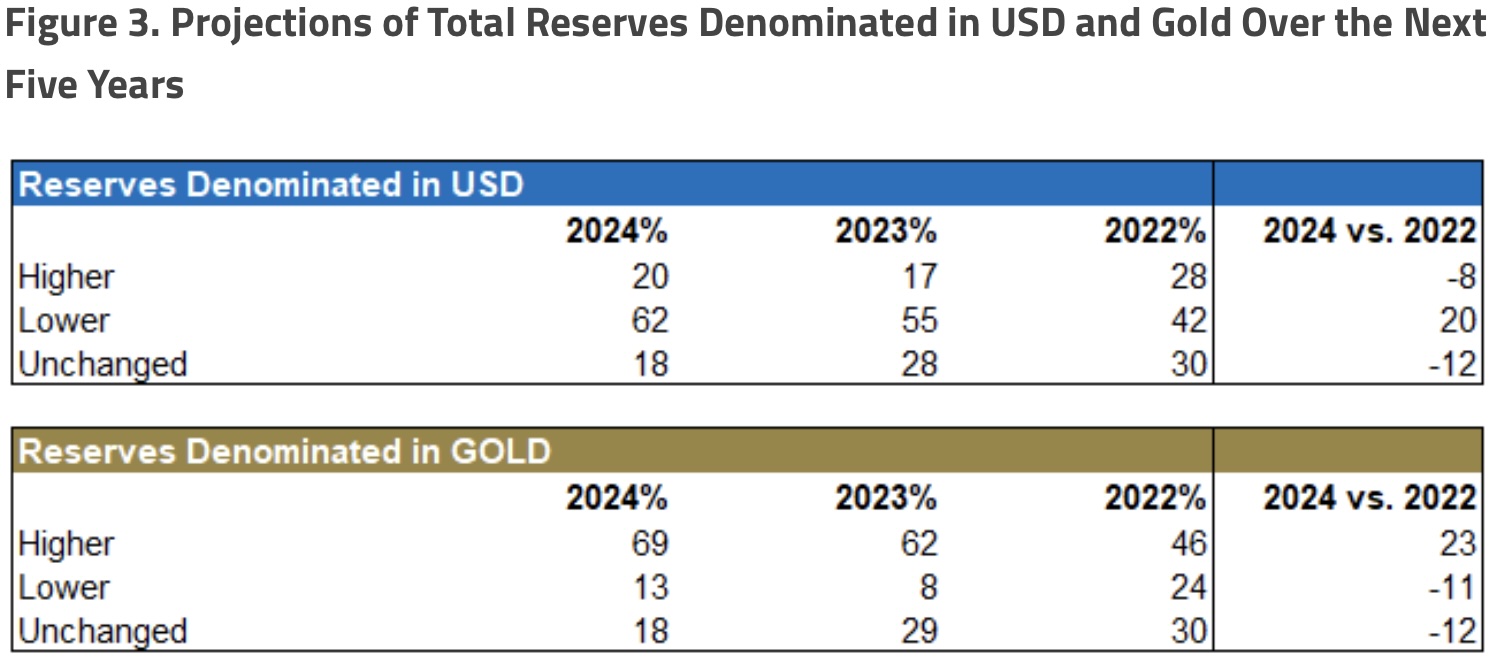
Another critical theme related to gold-buying intentions is the continuation of the view that the U.S. dollar (USD) will decline as a proportion of total reserves over the next five years (see Figure 3). In the WGC Survey, 62% of respondents indicated that USD reserves would likely decline, while 69% stated a higher gold reserve component. These positioning intentions have significantly changed since 2022, when respondents had a 42% lower USD reserve intention and a 46% higher gold reserve outlook.
Emerging Market and Developing Economies Driving Gold Buying
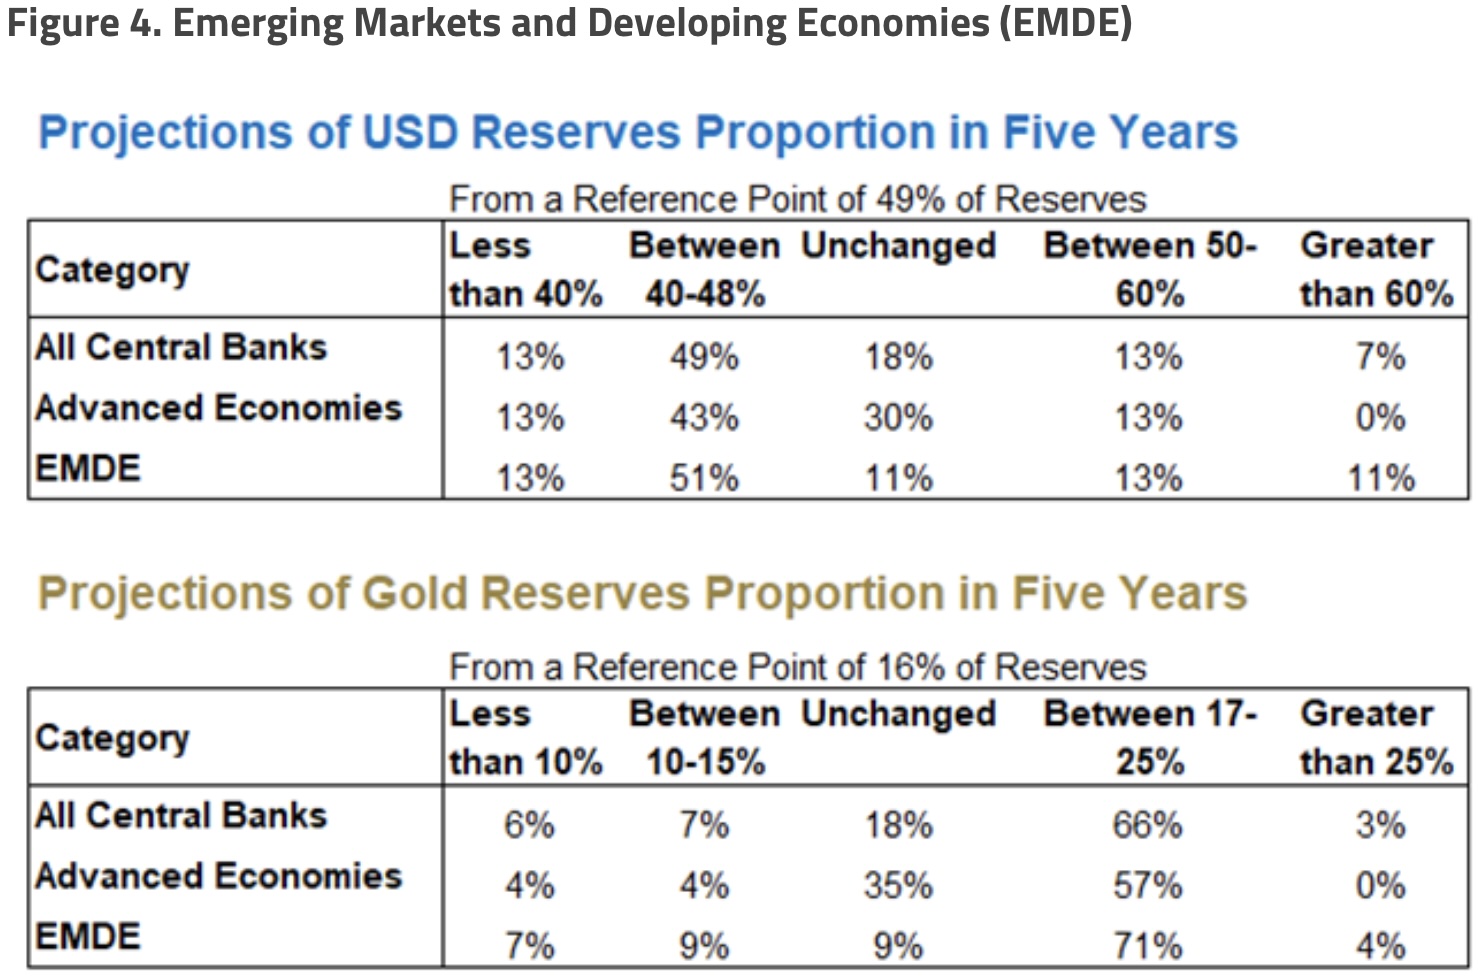
The WGC Survey also compares the buying intentions of advanced economies versus EMDE economies. Using a reference point of 16% gold as a percentage of total reserves in Q3 2023, respondents were asked to project the level of gold reserves in five years. The results, summarized in Figure 4, indicate that all central banks expect a higher percentage of gold in their reserves, with EMDE countries projecting a notably higher increase (75%) than advanced economies (57%). Some respondents highlighted gold’s longstanding reputation as a reliable store of value and a hedge against economic uncertainties. These perspectives underscore gold’s enduring appeal amidst various global financial challenges, including inflationary pressures and geopolitical instability. Respondents noted that gold plays a crucial role in stabilizing and safeguarding national reserve portfolios against market volatility and currency.
Even Advanced Economies Are Lowering USD Reserve Levels
While 62% of respondents expect to reduce USD reserves as a proportion of total reserves over the next five years, even advanced economies (56%) anticipate lower USD reserve levels (see Figure 4). Although the USD is expected to remain the primary reserve currency due to its dominant role in international trade and finance, its influence is anticipated to diminish gradually. This projected decline is attributed to the rise of alternative currencies like the renminbi (RMB) and an increase in bilateral trade agreements and swap lines between countries. Additionally, concerns about the “weaponization” of the U.S. dollar were highlighted, noting that U.S. policies can sometimes restrict access to dollar reserves during sanctions. Despite these challenges, the U.S. dollar’s centrality to many countries’ reserve strategies is reinforced by the advantages of interest rate differentials and its predominant role in international trade baskets.
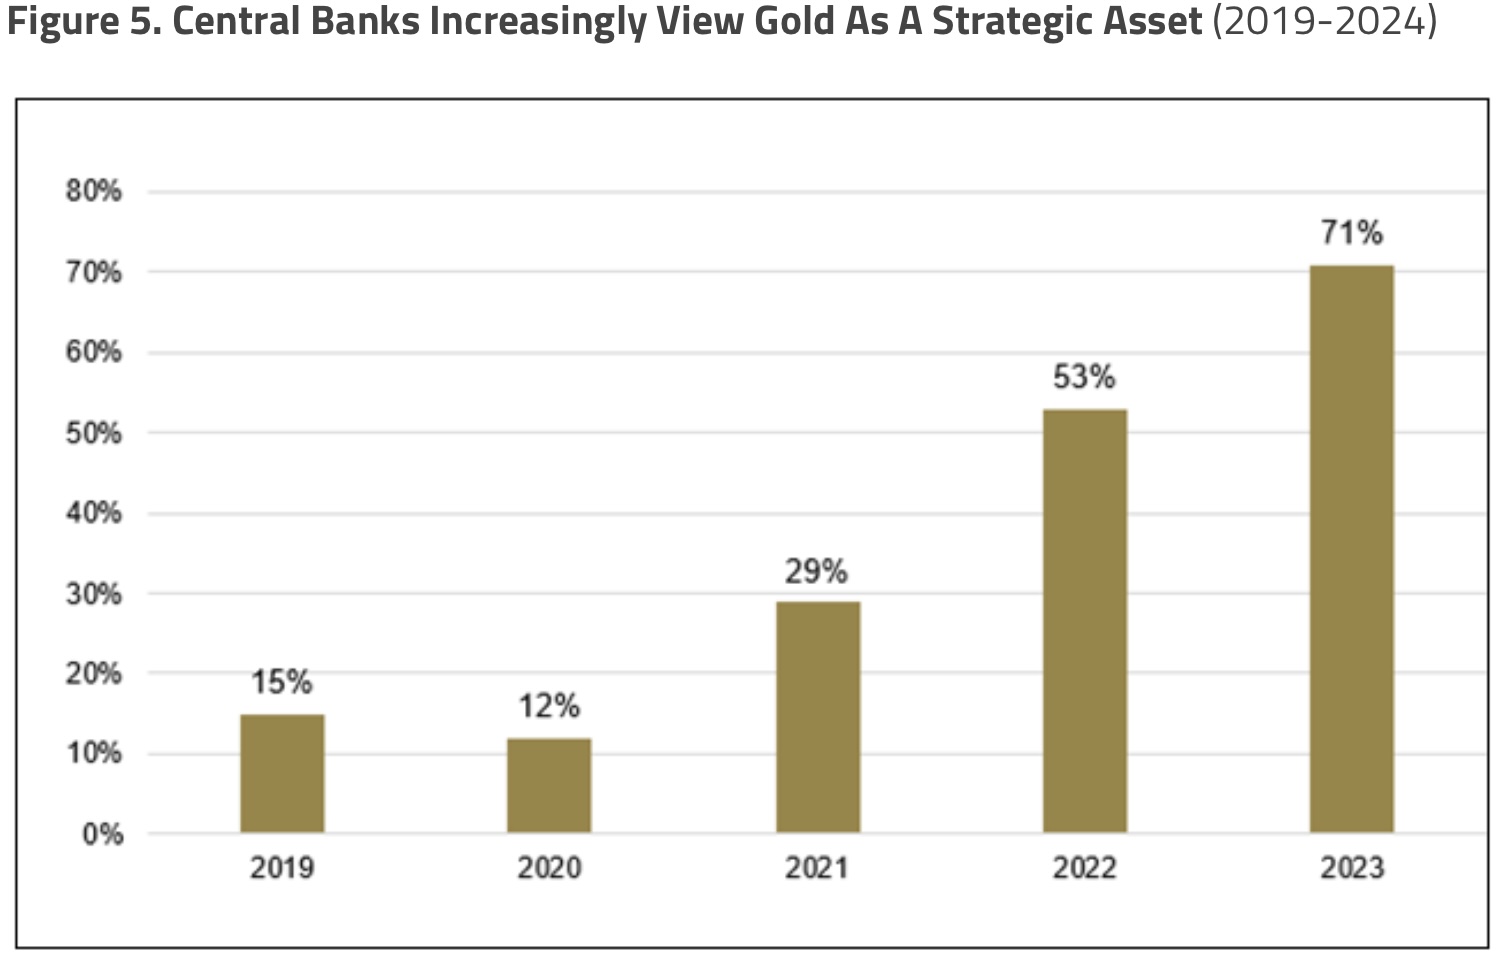
Central Banks View Gold as a Strategic Asset
The WGC Survey since 2019 shows that central banks continue to manage their gold reserves separately from other reserve assets. From 2019 to 2024, an average of 78% of respondents managed gold reserves separately. However, the rationale for doing so has changed considerably, with gold reserves increasingly regarded as a “strategic asset” (see Figure 5). In 2019, only 15% of central banks considered their gold reserves a strategic asset. By the 2024 Survey, this number had risen to 71%. Both advanced and EMDE economies face growing concerns about managing their reserve assets, including geopolitical uncertainty, financial stability, default risk, long-term store of value, portfolio diversification, performance during times of crisis and liquidity. Consequently, both groups now regard gold as a strategic asset.
Other Notables From the WGC Survey
The WGC Survey provides an in-depth view of central bank activity and perspectives on gold. Here are some additional observations that are both interesting and insightful:
- Central banks’ preferred method of buying gold remains the global OTC market (40%), where there is a layer of discretion between buyer and seller to avoid influencing or disrupting market prices or attracting speculators. Large transactions are still subject to regulatory reporting requirements, but details around deal terms will likely remain confidential.
- EMDE central banks procure a significantly larger portion of their gold from domestic production (41%) than advanced economies (6%).
- Off-market transactions with other central banks or international organizations have increased from 7% in 2020 to 18% in 2024.
- Most central banks (78%) take physical gold in the form of “Good Delivery Bars,” which meet the standards set by the LBMA (London Bullion Market Association). The Bank of England remains the preferred location for central banks to vault their gold reserves (55% in 2024), but domestic storage has increased significantly from 28% in 2019 to 41% by 2024.
- Only 37% of respondents actively manage their gold reserves, with yield enhancement being the primary reason.
High Central Banks Gold Buying Continued in Q1 2024
Central bank gold purchases continued at an elevated level for Q1 2024 with 289.72 tonnes, bringing the trailing seven-quarter average to 309.67 tonnes vs. the prior decade’s quarterly average of 126.71 tonnes, or 2.44x increase. From Q1 2013 to Q2 2022, central banks bought, on average, 507 tonnes of gold annually, or about 15% of mine production. From Q3 2022 to Q1 2024, central banks are purchasing gold at an annual rate of 1,239 tonnes or 34% of mine production.
Gold Continues to Significantly Outperform Other Reserve Holdings
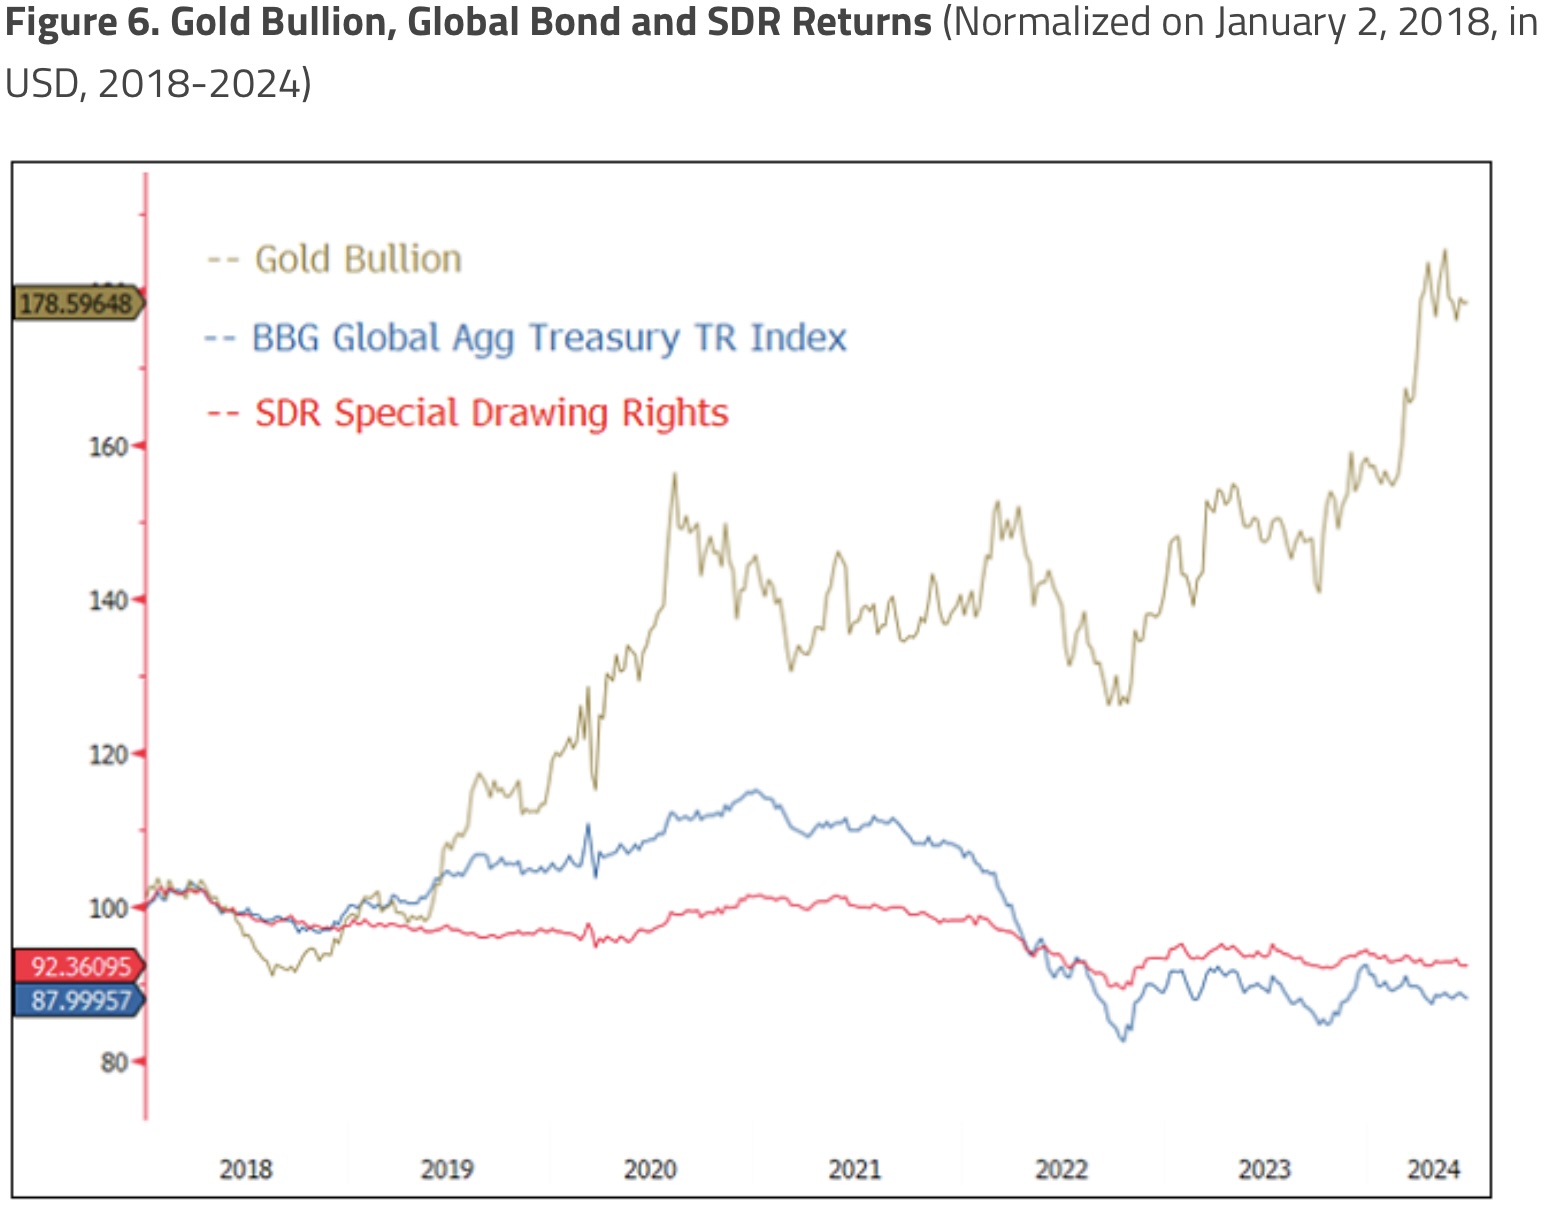
On average, central banks’ reserve holdings include FX reserves (~59% USD, 20% EUR), gold (15-20%), sovereign bonds and SDRs (an international reserve asset created by the IMF and comprised of USD, EUR, JPY, GBP and RMB). Figure 6 below illustrates that since January 2018 (the start of the trade wars and deglobalization trend), gold has significantly outperformed all major currencies and sovereign bonds. From January 2018 to June 2024, gold delivered a 9.33% compounded annual rate of return, compared to losses of -1.95% for global bonds and -1.21% for SDRs (a proxy for global FX). During this period, gold had a low R-squared of 0.22 with SDRs and 0.29 with global bonds, indicating strong diversification benefits alongside its significant outperformance.
According to the WGC Survey, gold has met reserve management objectives by serving as an effective inflation hedge or store of value (especially during high inflation in 2021 and 2022), performing well in times of crisis (such as during COVID-19 and the Russia-Ukraine War), providing portfolio diversification and acting as a buffer against geopolitical risks.
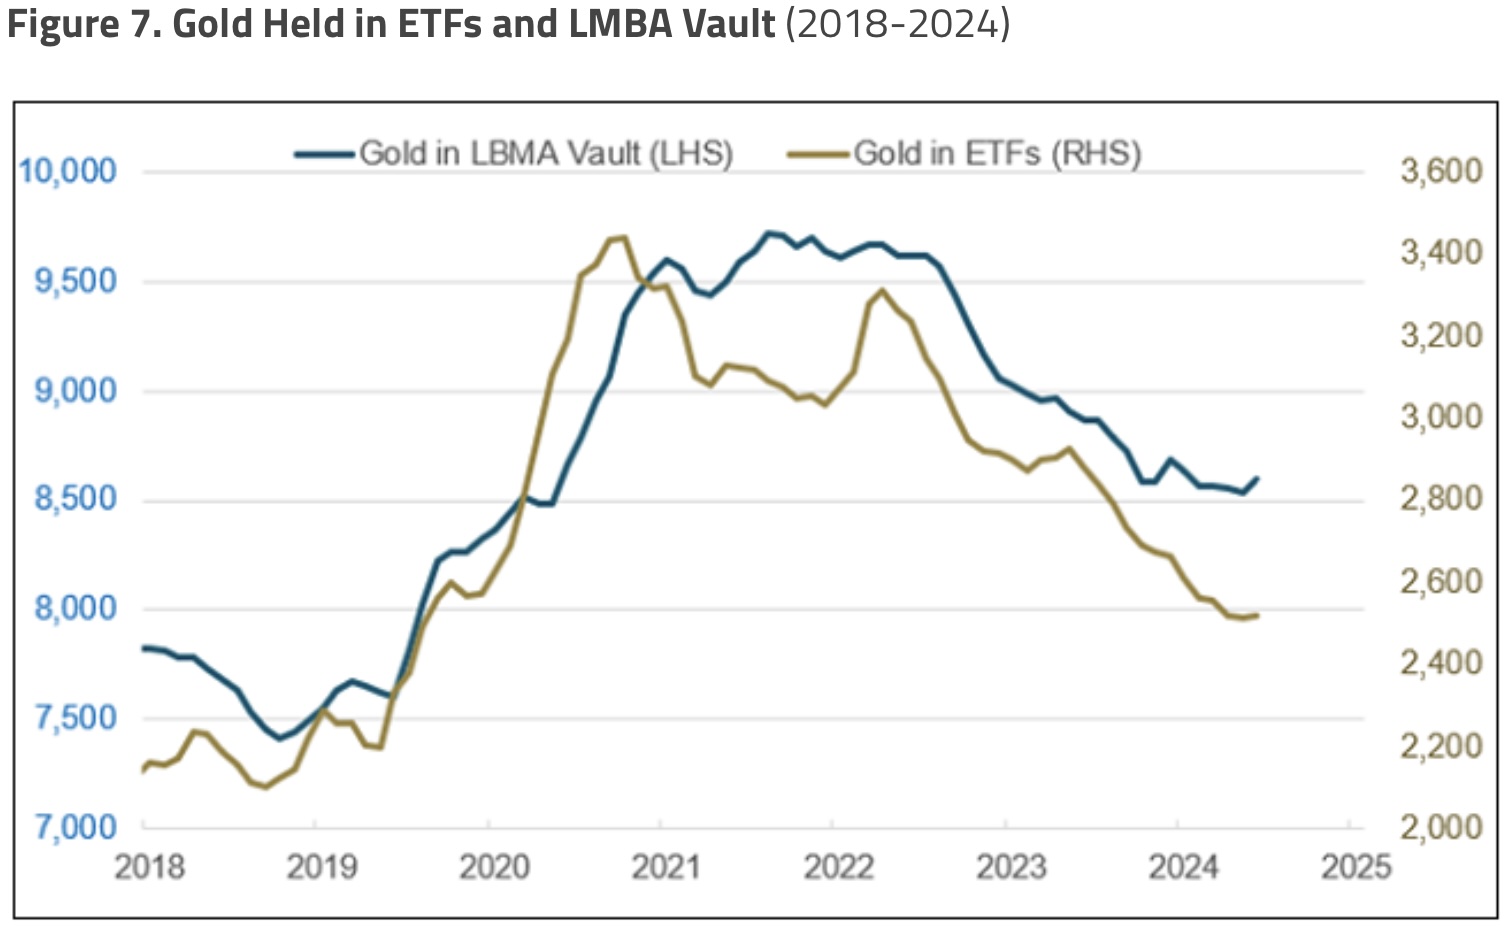
Gold Is Likely Being Drained From LBMA Vaults and ETFs by Central Banks
A surge in central bank gold purchases began in Q3 2022, coinciding with a divergence between falling gold holdings in ETFs and rising gold prices. This period also marked the beginning of a drawdown in gold held in the LBMA vaults (see Figure 7).
From Q3 2022 to Q2 2024:
- Gold held in ETFs decreased by 16.2%, equivalent to 15.70 million ounces (488 tonnes).
- Gold held in the LBMA vaults decreased by 8.9%, equivalent to 27.13 million ounces (844 tonnes).
These combined outflows since Q3 2022 total 42.83 million ounces (1,332 tonnes), approximately the same as the estimated additional gold that central banks have purchased above their historical rate (~1,280 tonnes). Although we lack confirmation data on the sources of central bank buying, Occam’s Razor suggests that central banks are draining gold from the LBMA vaults and ETFs. Prior to mid-2022, gold levels held in ETFs and LBMA vaults were highly correlated with the gold price (R-squared of 88% for LBMA and 96% for ETFs from July 2016 to June 2022), but since Q3 2022, they have become inversely correlated. A caveat to this analysis is that not all LBMA vaults provide thorough reports on their gold holdings, and some ETF gold holdings are vaulted at the LBMA. Overall, we believe the direction and implications are accurate.
King World News note: The paragraph below discusses a likely gap higher in the price of gold due to reduced physical availability as investment funds and individuals begin to enter the gold market.
It is unknown whether the gold coming out of the LBMA vaults and ETFs is being redomiciled to sovereign vaults for strategic asset reasons or if the gold exiting is “free-trading mobile gold.” If it is the latter, the amount of free-trading mobile gold is declining quickly as central banks and sovereigns lock up gold as a strategic asset. Our correlation-type models indicate that since mid-2022, gold has been losing its historical correlation pattern with currency effects, yield effects (particularly real yields), and other market effects such as volatility. Gold is becoming less of a financial asset and more of a strategic asset, as defined by central banks. In the future, there may be a significant risk-off event. When investment funds and individuals attempt to buy gold as a hedge, prices will likely gap higher due to the reduced availability of mobile free-trading gold.
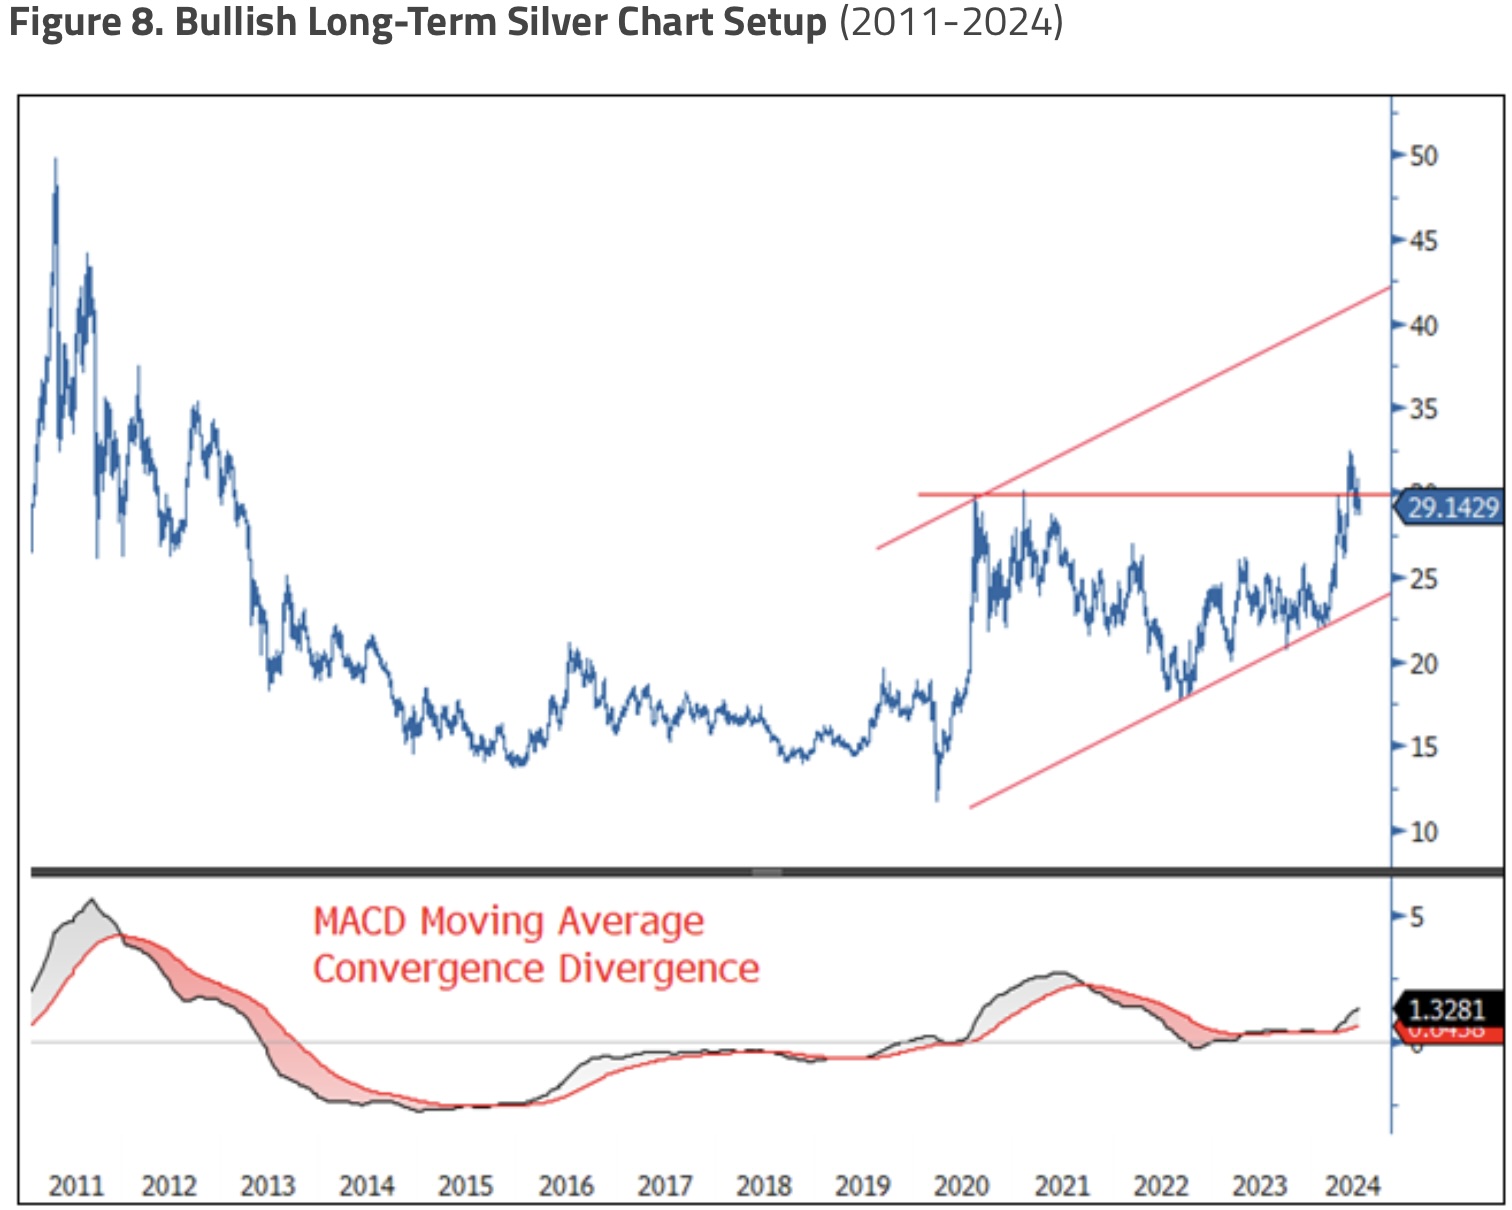
Silver Bullion Breaks Out, Price Squeeze Coming Into Sight
After consolidating within a price range for the past four years, silver decisively broke above the $29/30 resistance level in May, surging to $32.50 before consolidating this latest price move (see Figure 8). From a chart perspective, several bullish embedded patterns are evident. Technically, there is a short-term price target of $35, followed by a longer-term target of $42. Below, we highlight and update our bullish chart pattern interpretation on silver.
Silver Is Maintaining Its Monetary Reserve Characteristics
In our prior quarterly precious metals update (Q1 2024, Gold Is on the Rise and Reaches All-Time High), we highlighted that despite central banks and sovereigns purchasing massive amounts of gold but not silver, the correlation between silver and gold remained unchanged compared to the prior decade. The rolling 30-week correlation of silver prices to gold has now climbed to the upper end of the 10-year range at 0.94 (highly correlated) at quarter end.
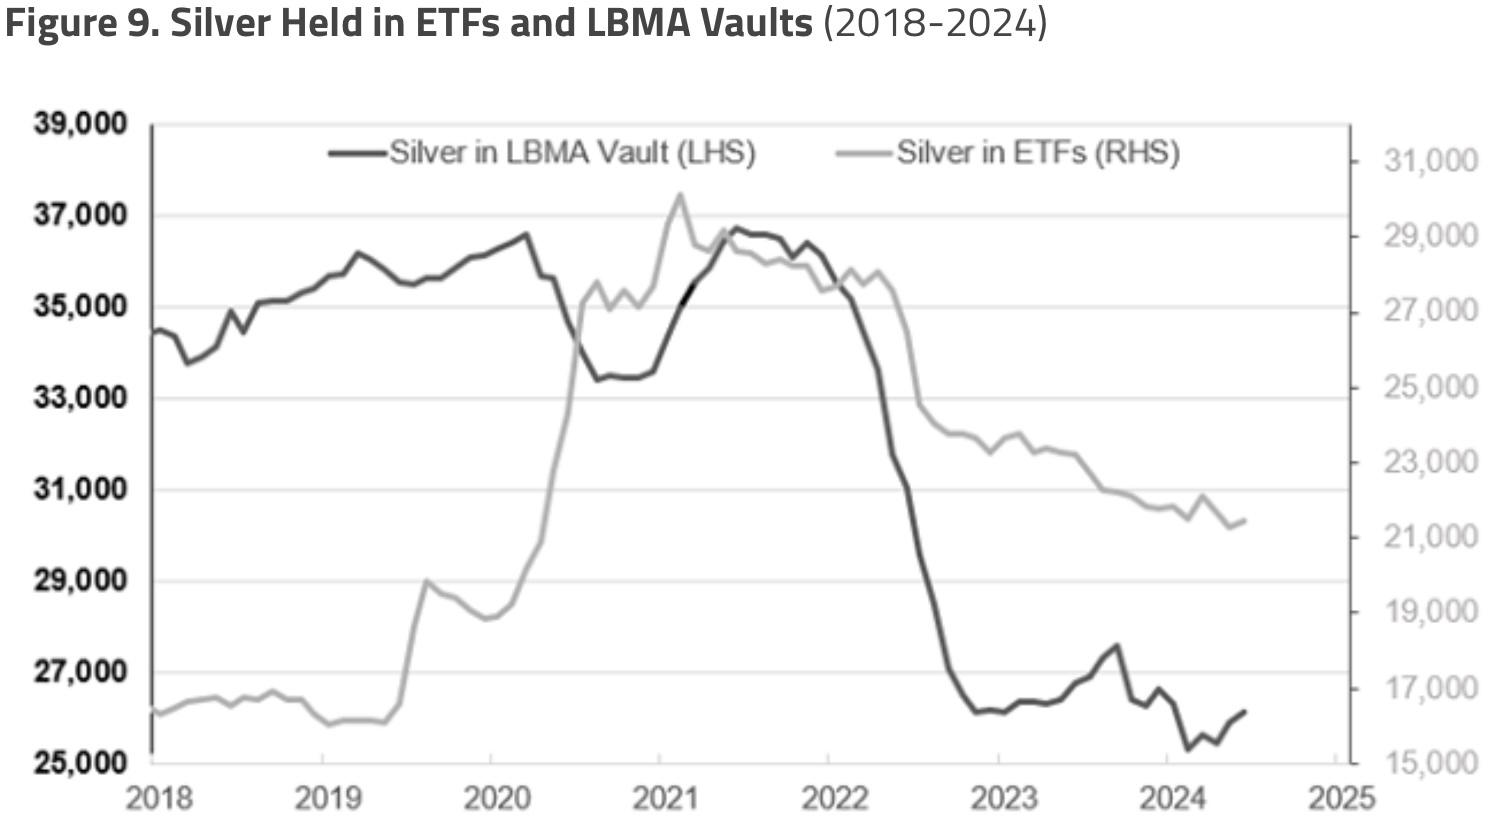
Unfortunately, there is limited data available on central banks actively purchasing silver. While central banks have been increasingly buying gold, silver purchases by central banks are not well-documented or prevalent, as the focus has been predominantly on gold. However, using data from the LBMA on silver held in their vaults and silver held in ETFs, we observe a similar pattern to that of gold held in LBMA vaults and ETFs (see Figure 9). While the buying may not be central bank-related, it is likely connected to China’s state-owned enterprises procuring silver for its photovoltaic industry, a vital economic focus of the Chinese government to boost export growth and help offset its weak domestic economy.
Shanghai Silver Premium Rising
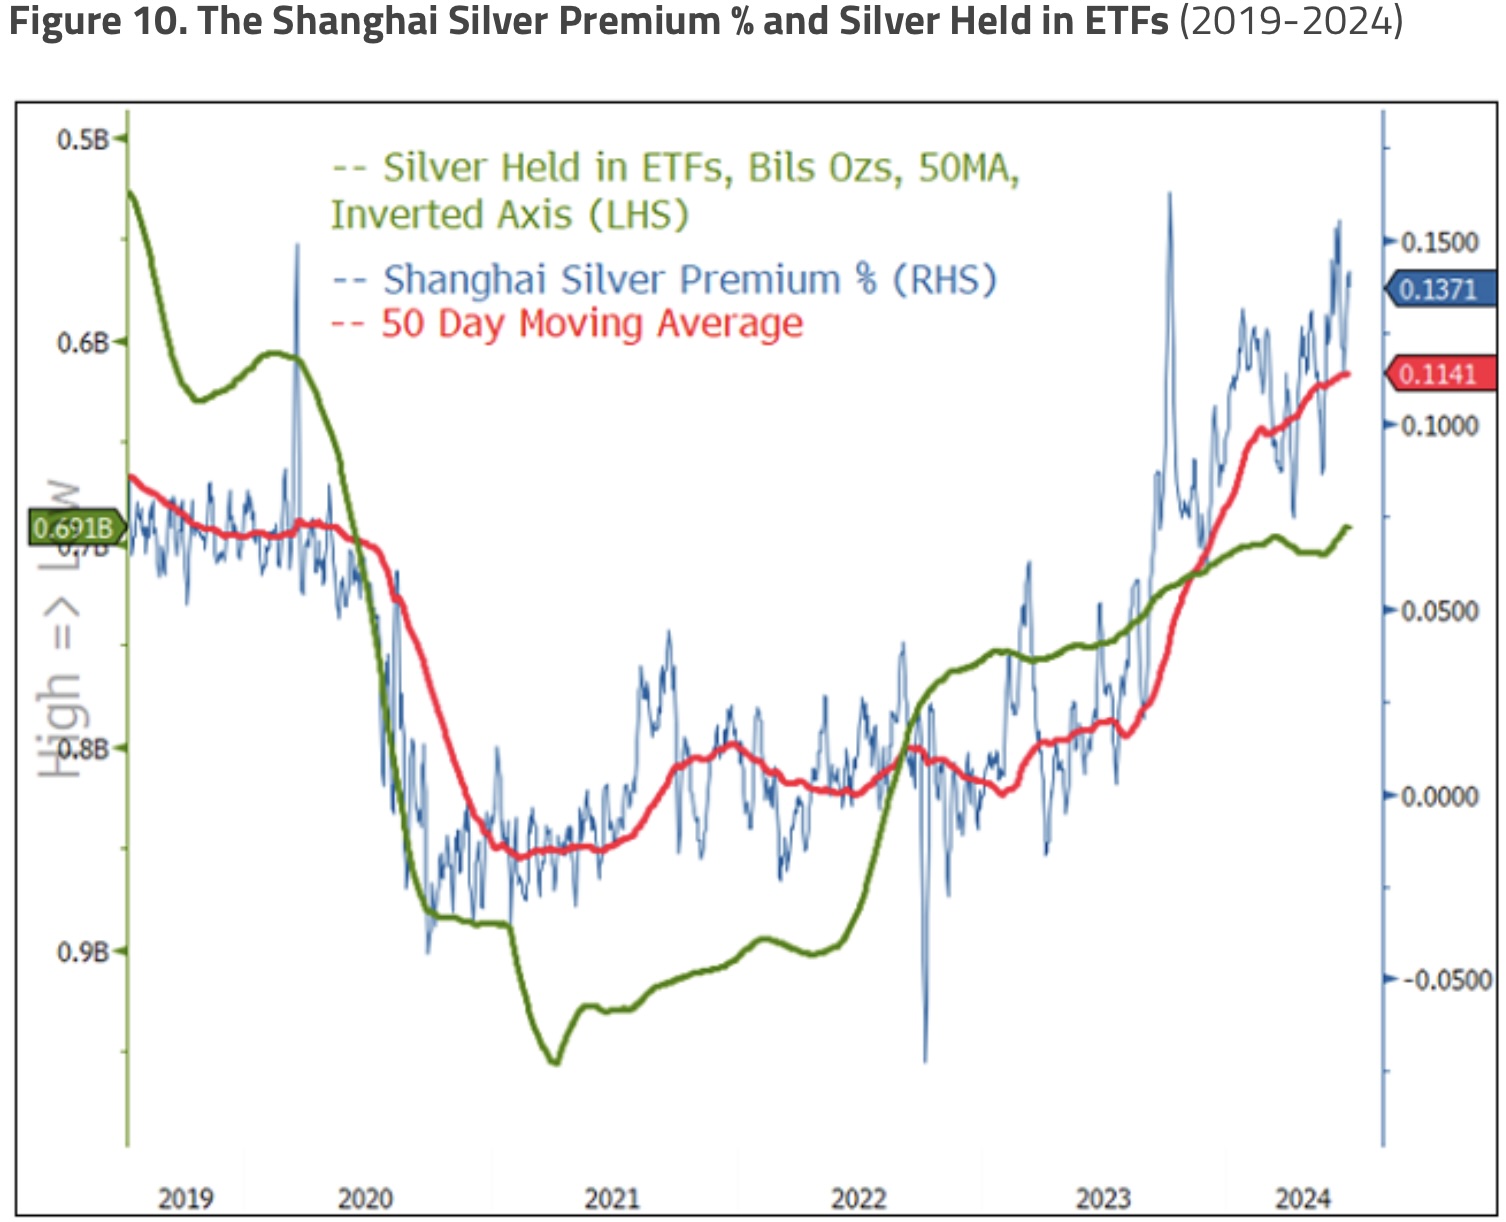
Similar to the Shanghai gold premium (the price difference between gold traded on the Shanghai exchange and international markets, typically London), the Shanghai silver premium has soared over the past year from approximately 2% to 13.7% (see Figure 10). This dramatic surge in the silver premium corresponds with the significant increase in photovoltaic production from China in 2023. We also overlaid silver held in ETFs, which shows that the rise in Shanghai silver premiums aligns with the reduction in silver held in ETFs. Whether central banks or state-owned enterprises are draining silver from ETFs and LBMA vaults is likely a distinction without a difference.
Photovoltaic Growth Continues to Exceed Expectations
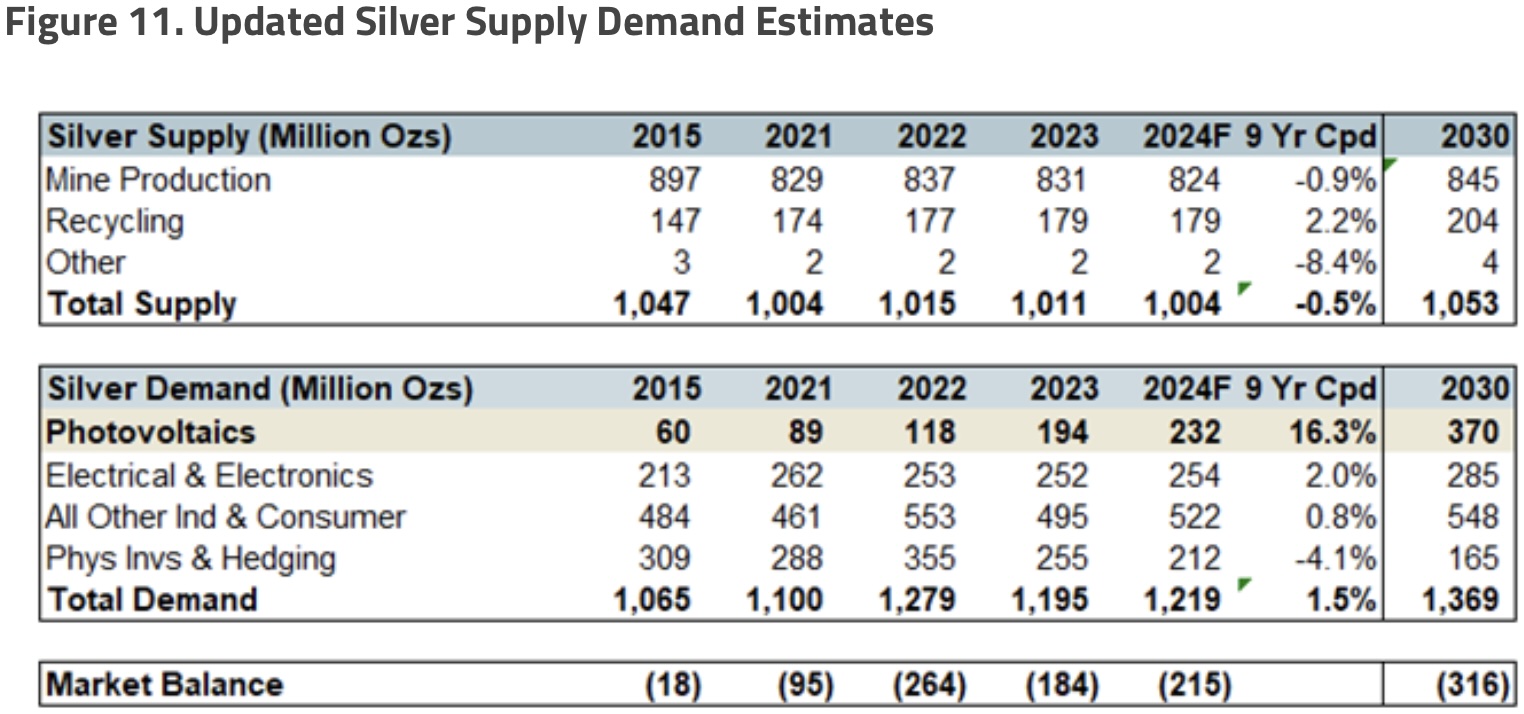
Since our last update on the silver supply and demand outlook (Oct 2023, Silver Demand Grows as Solar Leads Renewables), we have revised and updated our estimated silver demand for photovoltaics from approximately 270 million ounces (around 8,500 tonnes) to approximately 370 million ounces (around 11,500 tonnes) by 2030. Updated silver estimates from the Silver Institute, BNEF, and higher adoption rates of TopCon and HJT solar technologies (which have higher silver loadings) have all contributed to the increase in our silver demand estimates (see Figure 11). For over a decade, new solar additions have exceeded expectations each year, and we expect this trend to continue as solar costs decline, power efficiency becomes more critical (requiring higher silver loadings), and 4IR technology adoption expands exponentially (June 2024, Fourth Industrial Revolution Fuels Global Competition for Critical Minerals).
The last line of Figure 11 shows the estimated market balance, the amount of silver required to be pulled out of held inventory to balance the market. From 2015 to 2021, the average market draw was flat at about 1 million ounces. From 2022 to 2024, the average market draw was approximately 220 million ounces (around 6,800 tonnes), a remarkable change likely not yet fully appreciated by the market. By 2030, our updated estimated market balance will exceed 300 million ounces (around 8,500 tonnes), meaning that from 2024 to 2030, over 200 million ounces of demand will need to be drawn from inventory each year. Furthermore, we extrapolated the decline in the physical investment trend to 2030. If physical investment were to increase, the market draw on silver would be even more dramatic, given the potential delta.
Combined silver in LBMA vaults and ETFs can be thought of as the above-ground, free-floating inventory of silver, currently about 1.5 billion ounces, which may actually be lower due to possible double counting. According to our estimates, the cumulative demand draw to balance the silver market by 2030 will exceed 2 billion ounces. Within a few years, we will be heading toward a silver squeeze, and we can expect prices to rise. During the silver squeeze, we will likely see demand destruction in low-value end-use sectors (i.e., consumer end-use) and prices set by higher value-added end-uses (i.e., powering 4IR).
Just Released!
Gerald Celente’s King World News audio interview has just been released discussing the gold market and much more and you can listen to it by CLICKING HERE OR ON THE IMAGE BELOW.

To listen to Alasdair Macleod discuss the wild trading in the gold and silver markets CLICK HERE OR ON THE IMAGE BELOW.

© 2024 by King World News®. All Rights Reserved. This material may not be published, broadcast, rewritten, or redistributed. However, linking directly to the articles is permitted and encouraged.


