
Higher inflation is coming as commodity prices continue to push higher. Take a look…

We Have A Long Road: Commodity Prices Continue Push Higher
September 3 (King World News) – The Kobeissi Letter: Commodity markets are saying everything you need to know.
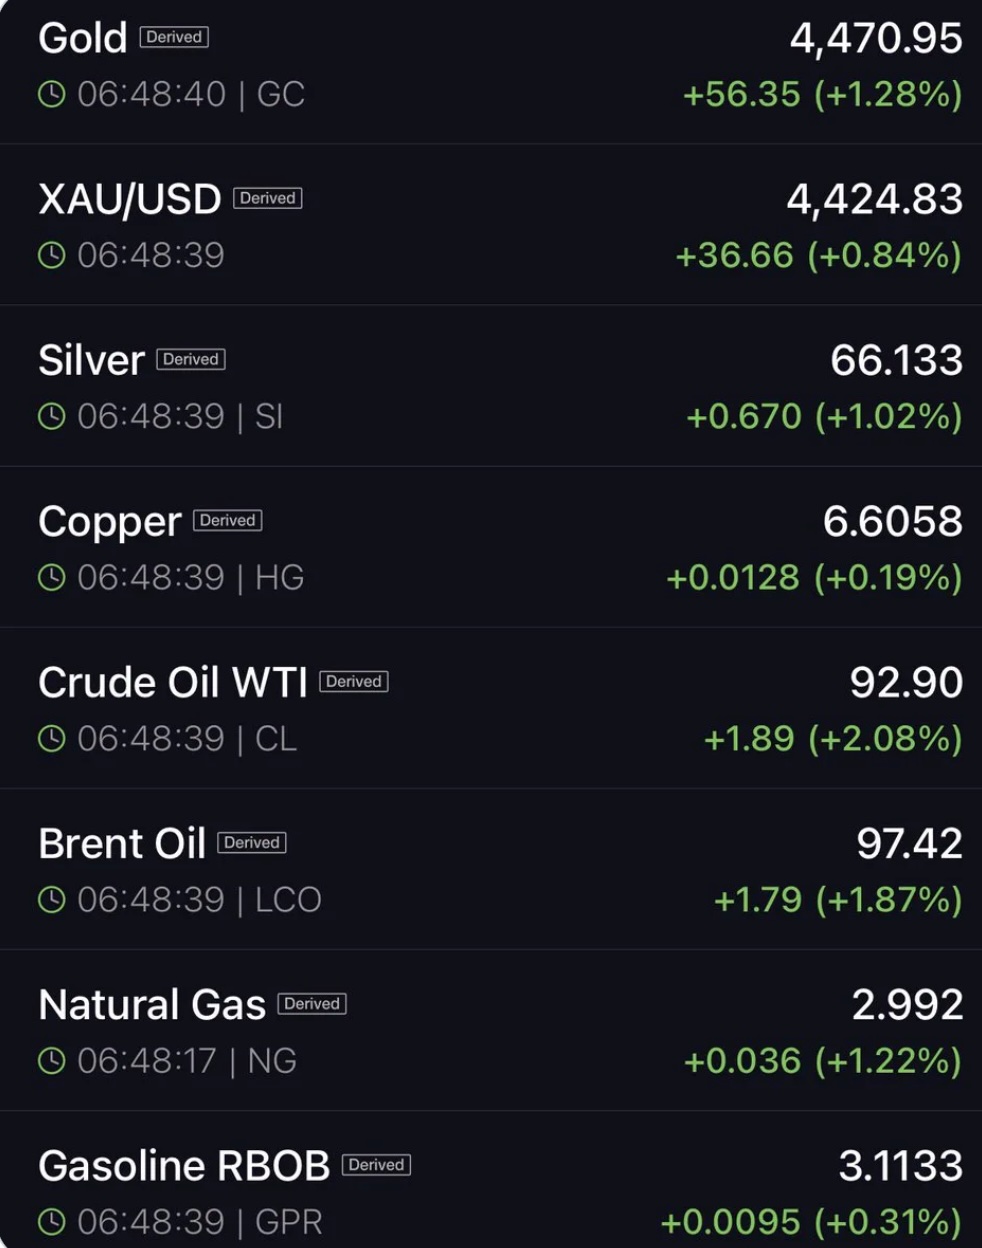
Even as rate hike expectations and Treasury yields rise, commodities continue push higher across the board.
Inflation has now been above the Fed’s 2% target for 65 consecutive months.
And, the Fed’s 2% target appears to be distant at best as oil prices near $100/barrel again.
The reality is that the denominator of these assets, the US Dollar, is undergoing a historic loss of purchasing power.
Prices are not just rising; the currency they are priced in is losing value.
We have a long road ahead…
Listen to the greatest Egon von Greyerz audio interview ever
by CLICKING HERE OR ON THE IMAGE BELOW.

Crude Oil
MSA Research: Based on quarterly momentum (not shown here), MSA issued a buy signal at the January close of $65. Also, at that point this annual momentum chart cleared resistance. Some modest upside followed through February, and then the war headlines hit and began the sharp upside on the first day of trading in March. MSA argued during that headline-chasing rally that longs who didn’t enter properly and instead chased the news and the upside prices would likely be hurt badly. And they were.
In fact, there was a pullback low in July to $67, just $2 above our original long-term buy signal. Now price is living up in the mid $80s. In sum, the pullback held at levels that made sense on quarterly and this annual momentum chart. Action has rebounded since. Hence the trend is positive despite the dumping of the headline-chasers and the downside which that cleansing inflicted.
We expect this upturn, lagged to BCOM, to lead to a couple years of price gain for oil (in sync with the commodity complex, not unique to oil). The same primary fundamental reason exists: the ongoing year-by-year, decade-by-decade monetary expansion (true inflation) that moves into various asset categories, but unevenly. The stock market has gained much since 2009 thanks to cheap money flow, while commodities haven’t benefitted from it. But these flows always shift as investors adjust their preferences due to perceived risk vs. gain.
Oil Is Cheap
Oil, like most commodities, is historically cheap, and especially if you measure oil vs. the real value of the fiat currency. (An M2 chart shows the massive inflationary trend of what people call “money.”) And even just referencing this price chart of oil, which isn’t adjusted for true monetary value, $85 is only in the middle of the past twenty years of price. That’s hardly high-priced at all. A price chart comment. As we showed on page one, BCOM’s price developed a sixteen-year gradual parallel downtrend channel that was finally overcome in January. (Parallel channels, properly plotted, are one of few price chart tools we respect.)
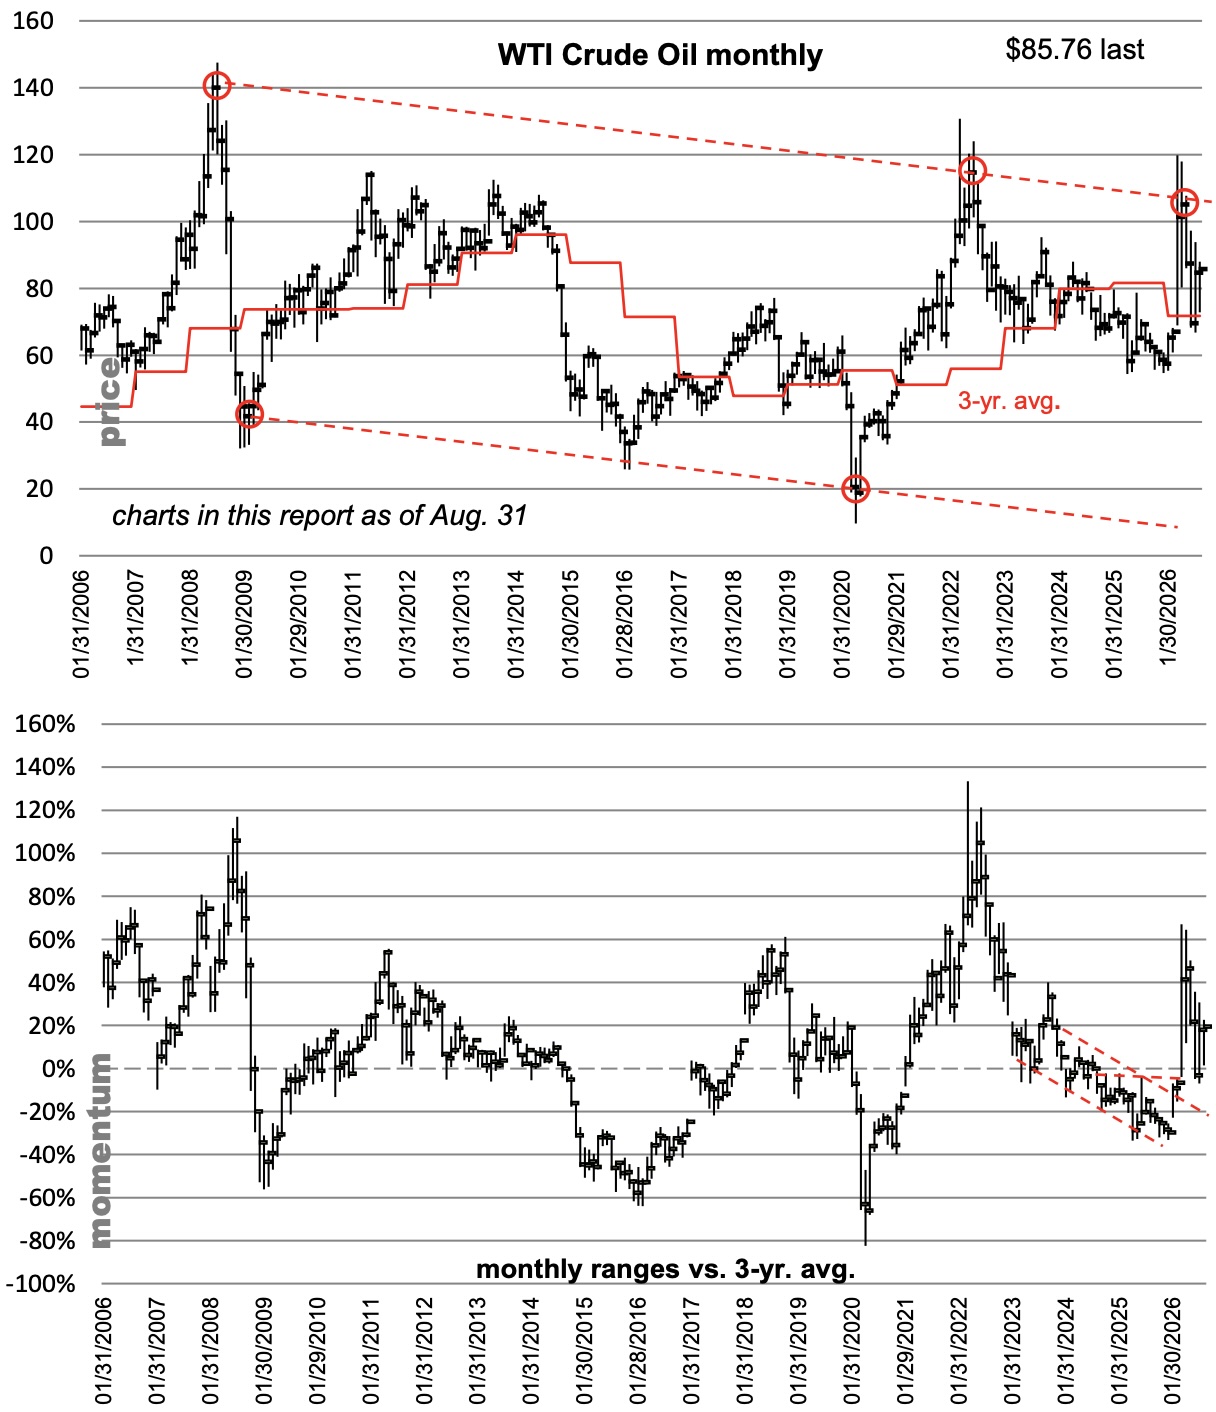
We can also plot a parallel channel on oil’s price going back eighteen years that’s defined by peak and low monthly price chart closes. Note the peak monthly close during the war headline surge. It closed at the channel top and turned down again. Now it’s an even more impressive three-point parallel channel top on price (with three peak closes and two parallel low closes during those eighteen years). When oil closes a month out over $105.70 (April’s peak monthly close), that breakout will be a statement event and hopefully without any specific headlines.
ALSO RELEASED!
Rising Oil Prices Are Wildly Bullish For Gold & Silver CLICK HERE.
Demand For Gold & Silver Likely To Reemerge, Plus This Just Hit Highest Level Since 2008 CLICK HERE.
This Jaw-Dropping Chart Is One For The History Books CLICK HERE.
Gold Surged Last Time This Happened CLICK HERE.
OWN GOLD: US Annual Interest Expense Highest Since 1991! CLICK HERE.
Celente – US Total Debt Is Really $126 Trillion, Gold Is Headed A Lot Higher CLICK HERE.
SILVER SKYROCKET? Ignore Pullback, Almost Nobody Long The Silver Futures Market CLICK HERE.
Despite Fed Babble, $15,000 Gold And $300-$500 Silver Targets Intact CLICK HERE.
The Great Rebalancing Will Fuel The Gold Bull Market For Years To Come CLICK HERE.
A Look At Real World Inflation As M2 Money Supply Grows At A Rapid Rate CLICK HERE.
GOLD: This Stock Has Been On A Tear, Plus Look At What Just Hit Highest Level In A Decade CLICK HERE.
Gold Close Back Above $4,700 For The First Time In 3 1/2 Years CLICK HERE.
US May Go On A Massive Gold Buying Spree Sending Price To $20,000 CLICK HERE.
This Is Why Analysts Are Now Predicting $10,000-$20,000 Gold CLICK HERE.
US Now Desperate To Manipulate Gold Price To $17,000-$20,000 Or Higher CLICK HERE.
Legend Rob Arnott Just Issued This Warning To The US Government CLICK HERE.
WHAT A WEEK: Gold Futures Hit $4,660, Silver Futures $70! CLICK HERE.
© 2026 by King World News®. All Rights Reserved. This material may not be published, broadcast, rewritten, or redistributed. However, linking directly to the articles is permitted and encouraged.