Gold and silver prices stabilized as the stock market pulled back, but take a look at this…
November 12 (King World News) – Peter Boockvar: As we all analyze what happens now with markets and the economy in light of the return of DJT and the Fed continues on with rate cuts, there is another player in the room that we have to listen and pay attention to and that is the US Treasury market. It has certainly expressed its thoughts, via higher yields, both in response to the initial 50 bps September Fed rate cut and the Trump victory. It now has a seat at the table, though Powell heard last week hasn’t yet acknowledged this uninvited guest and the new administration will get to sit down with early next year.
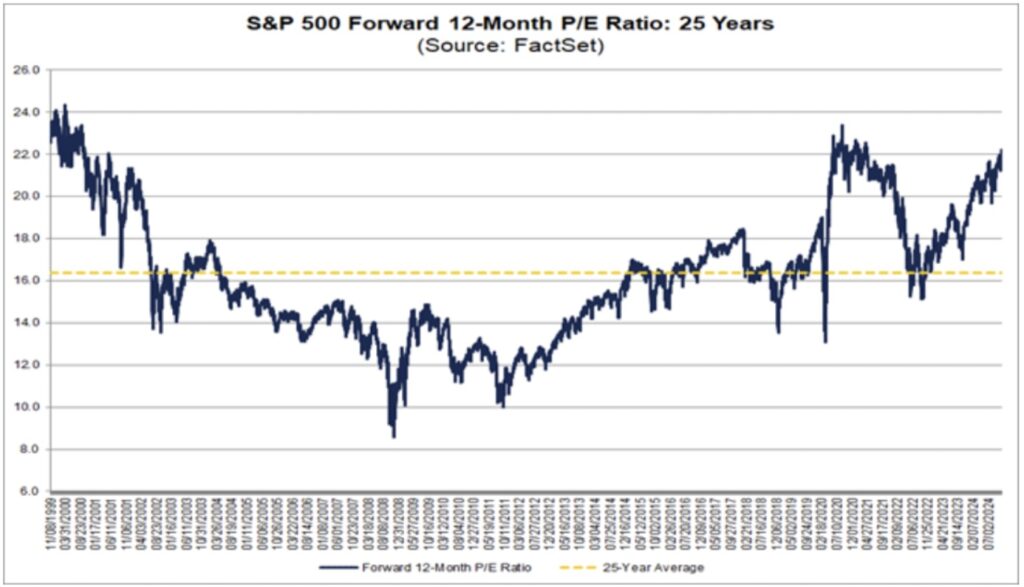
Valuations don’t matter until they do I always say and I have no idea when they will again. That said, we should always acknowledge the valuation surroundings as investors as it is a big factor in the expected future returns when looking out longer term. FactSet yesterday spoke on this topic in a piece. They said, “On November 7, the forward 12 month P/E ratio for the S&P 500 was 22.2, which marked the 2nd straight day the P/E ratio for the index was above 22.” This by the way was as of the 5973.10 closing price on that day last week.
“How does this 22.2 P/E ratio compare to historical averages?” they ask. “The forward 12 month P/E ratio of 22.2 on November 7 was above the five most recent historical averages for the S&P 500: 5 year (19.6), 10 year (18.1), 15 year (16.4), 20 year (15.8), and 25 year (16.4). In fact, prior to the past two days, the last time the forward 12 month P/E ratio was above 22 was April 27, 2021 (22.2).”
For reference, this compares to the peak P/E ratio of 24.4, “recorded on March 23, 2000.” The Covid jump in the P/E ratio was due to the collapse of the E by the way. https://insight.factset.com/highest-forward-12-month-p/e-ratio-for-the-sp-500-in-more-than-3-years?utm_source=Direct&utm_medium=Email&utm_campaign=FO-11-11-2024&utm_content=httpsinsightfactsetcomhighestforward12monthperatioforthesp500inmorethan3years
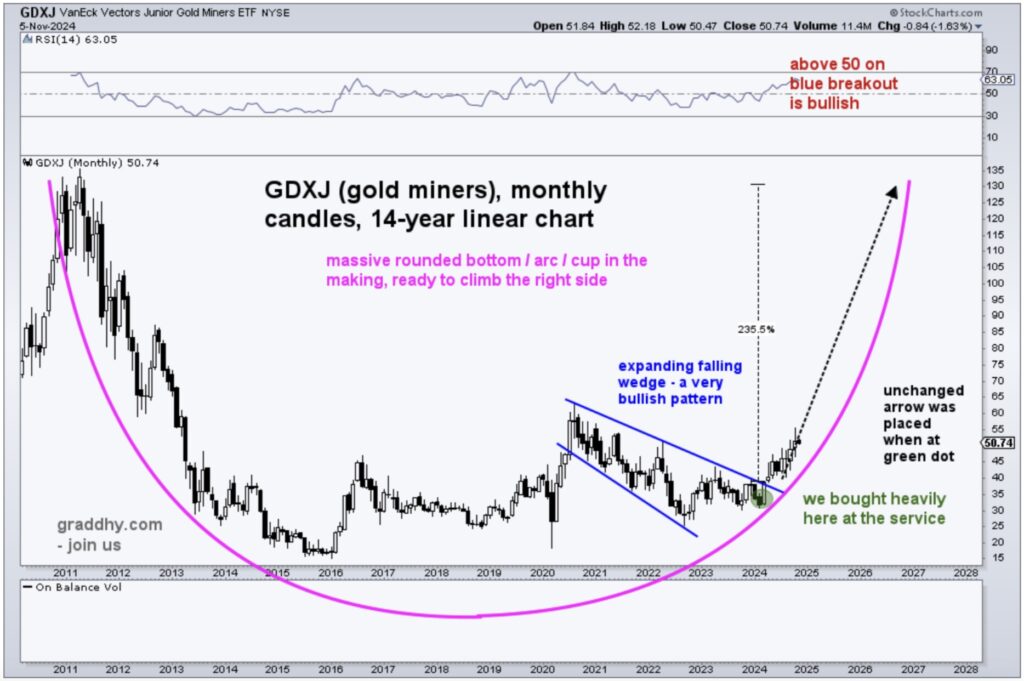
It’s Still A Bull, Despite Shakeout
Graddhy out of Sweden: Always know the very big picture.
Remain Focused On Big Picture During Volatility
Silver & Gold
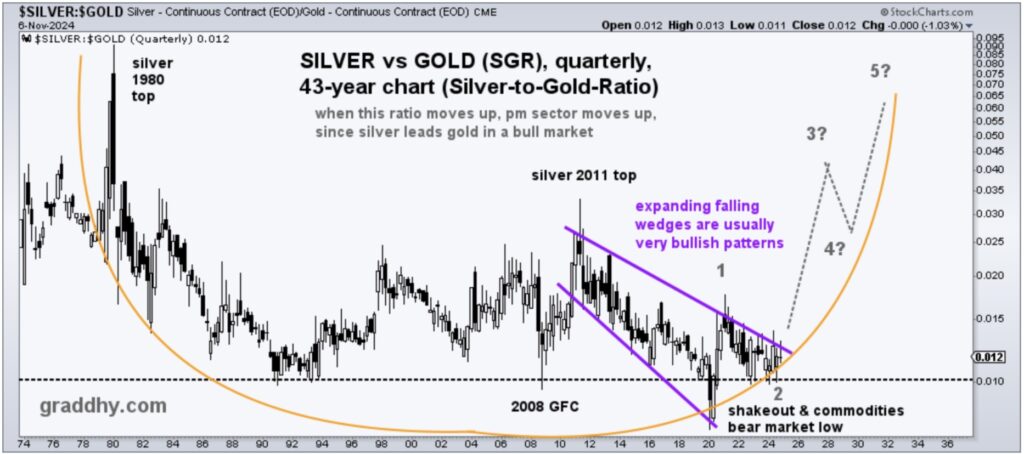
Graddhy out of Sweden: I really like this chart. The Silver-to-Gold-Ratio (SGR) is the inverse GSR, and has a cleaner pattern than GSR. This chart now looks ready to deliver a historical up-move and lifetime opportunity for precious metals.
Silver To Move Violently Higher vs Gold
Note that a shakeout, plus a lower low undercut during the backtest, is already done.
Awesome chart. I think the historical moment is soon here.
Gold vs Bonds
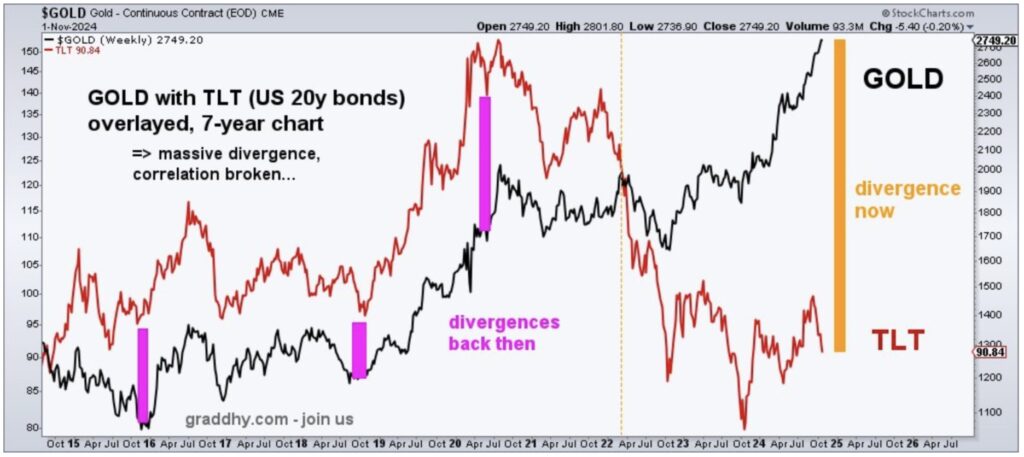
Graddhy out of Sweden: The big picture massive divergence between $GOLD and $TLT (US bonds) is just widening. Either something has got to give here…Or US bonds are broken.
Historic Gap Gold vs Bonds
It is hard to argue that US bonds are still a safe-haven looking at this.
JUST RELEASED!
To listen to Rob Arnott discuss how investors around the world can prepare themselves for the turbulence in global markets that lies ahead CLICK HERE OR ON THE IMAGE BELOW.
To listen to the jaw-dropping gold and silver price predictions that Nomi Prins just made CLICK HERE OR ON THE IMAGE BELOW.
© 2024 by King World News®. All Rights Reserved. This material may not be published, broadcast, rewritten, or redistributed. However, linking directly to the articles is permitted and encouraged.

