

On the heels of a wild trading week, stunning charts illustrate a bullish big picture for gold and silver.
Alasdair Macleod’s King World News audio interview has just been released! (LINK AT THE BOTTOM)
A New Wave Of Gold & Silver Demand
June 22 (King World News) – Alasdair Macleod: A new wave of Asian demand could be beginning to drive gold and silver. Traders will be watching for signs of overnight demand returning ahead of London’s morning fix.
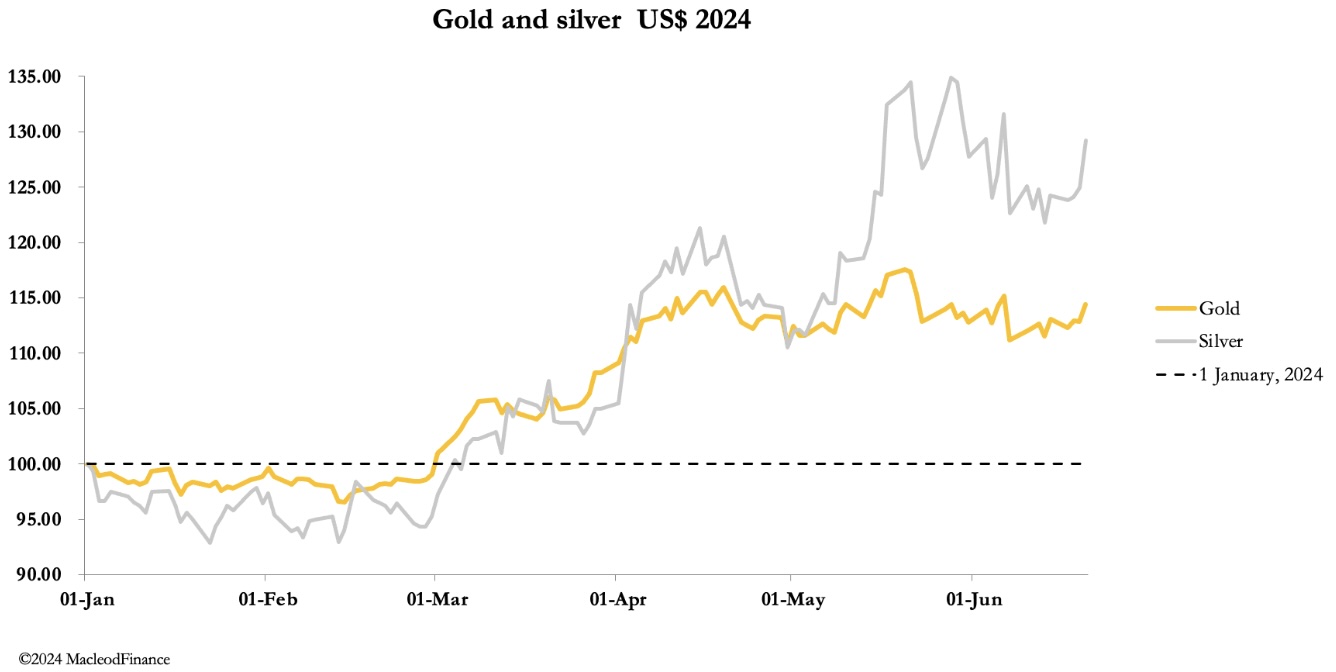
Gold and silver had a better week, with gold at $2366 in European trade this morning, up $33, and silver $30.45, up 93 cents. US markets were shut on Wednesday for the mid-month holiday, and when trading resumed yesterday (Thursday) gold and silver both rose strongly.
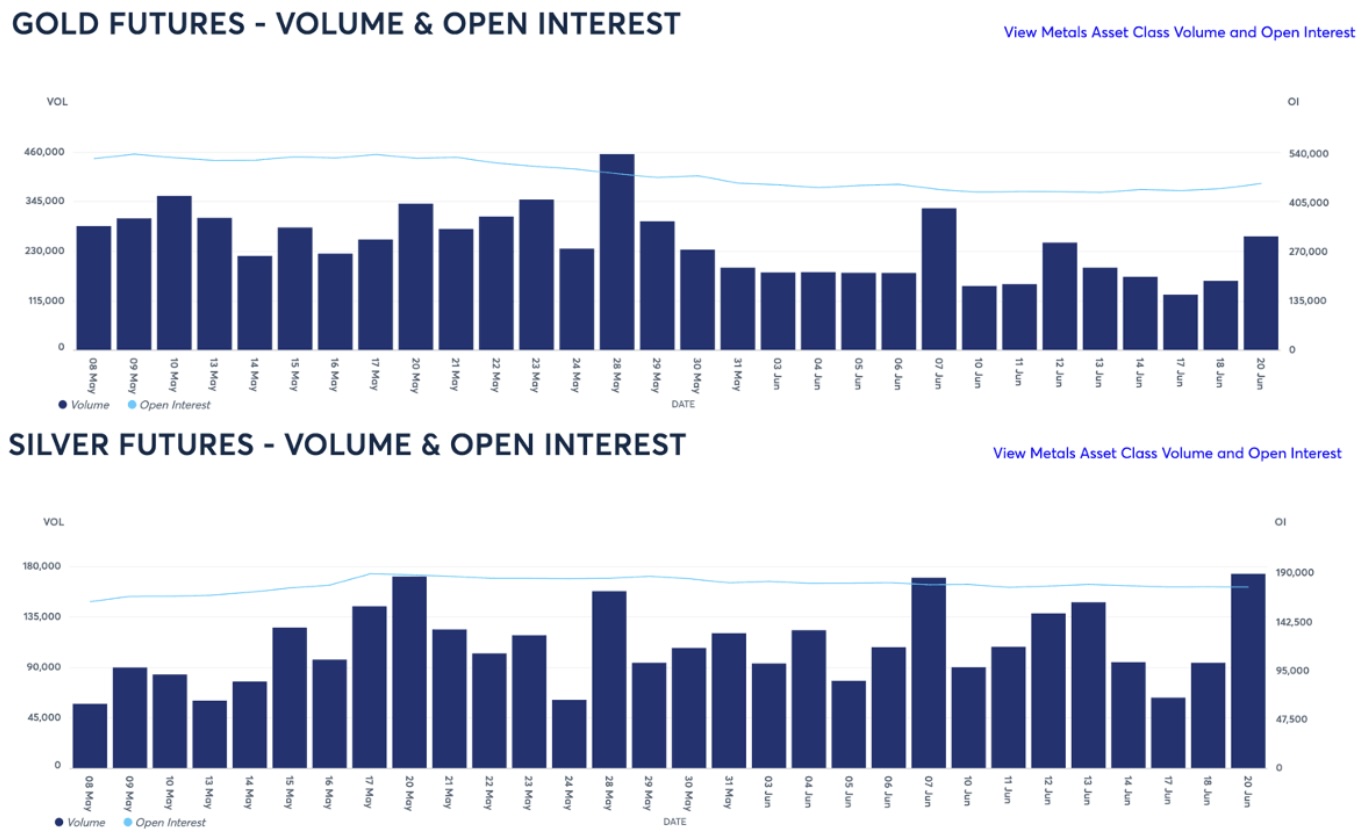
From the outset on Thursday, a bear squeeze seemed to be driving market values. Overnight trading led to a strong opening in London, perhaps an indication of overnight Chinese and/or Indian physical demand reviving. There was a moderate pickup in Comex gold volume, but silver’s volume soared on the back of obviously good demand. These are shown in the charts below:
Recently, a sharp rise in silver has often led the gold price. This is consistent with real demand for silver triggering a squeeze on gold. But there’s another factor in play: a sharp rally in oil:
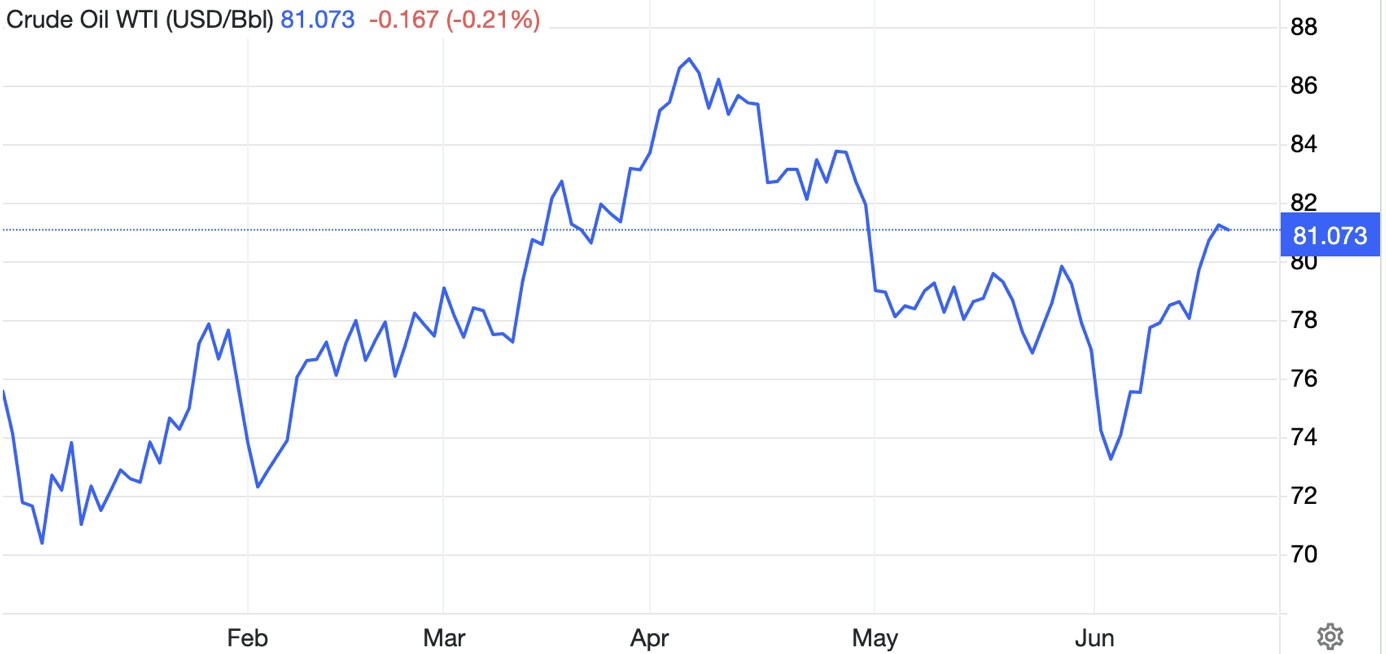
Since 4 June, WTI has rallied 11%. Metals such as copper have stopped falling. It is early days, but it seems the commodity complex might be resuming the bull tack, starting with oil. The relevance to gold is that gold can be regarded as a proxy for commodity values, reflected in one of my favourite charts, originally put together by colleague James Turk:
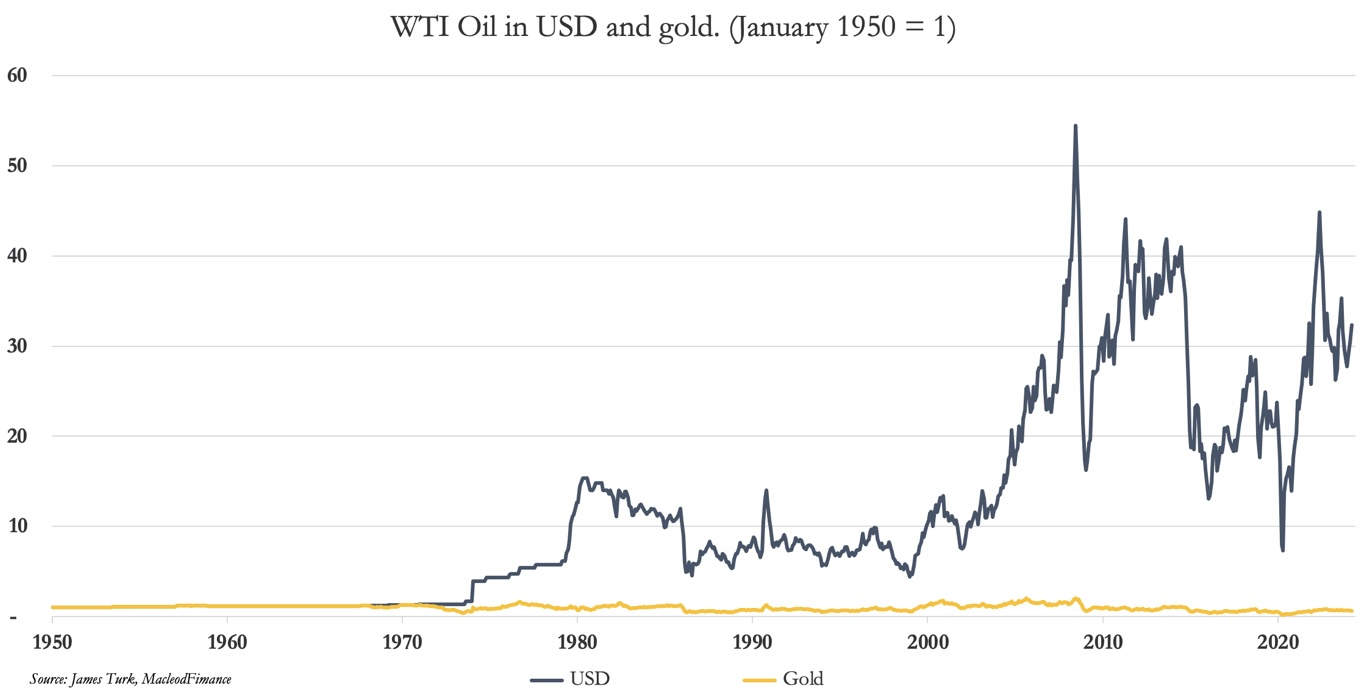
I have run the price comparison between dollars and gold in a number of other commodities with similar results. The price volatility is always in dollars and not gold, which correlates much more with the commodity complex. It follows that if energy and commodity prices are rising, the most important factor is the dollar declining, which is good for gold.
The reason for mentioning this is the signal we are getting from the oil price. More specifically, what is likely to drive dollars and associated currencies down in terms of their purchasing power and therefore gold?
Conventional analysis points the finger at interest rates. Softer US economic data, the ECB having cut its deposit rate, and UK inflation falling to the 2% target are convincing bond markets that cuts in interest rates have started and will continue. And lower rates are believed to be good for gold. Presumably, it is this thinking which is leading to a slight recovery in Open Interest on Comex:
Gold’s Open Interest Remains Collapsed!
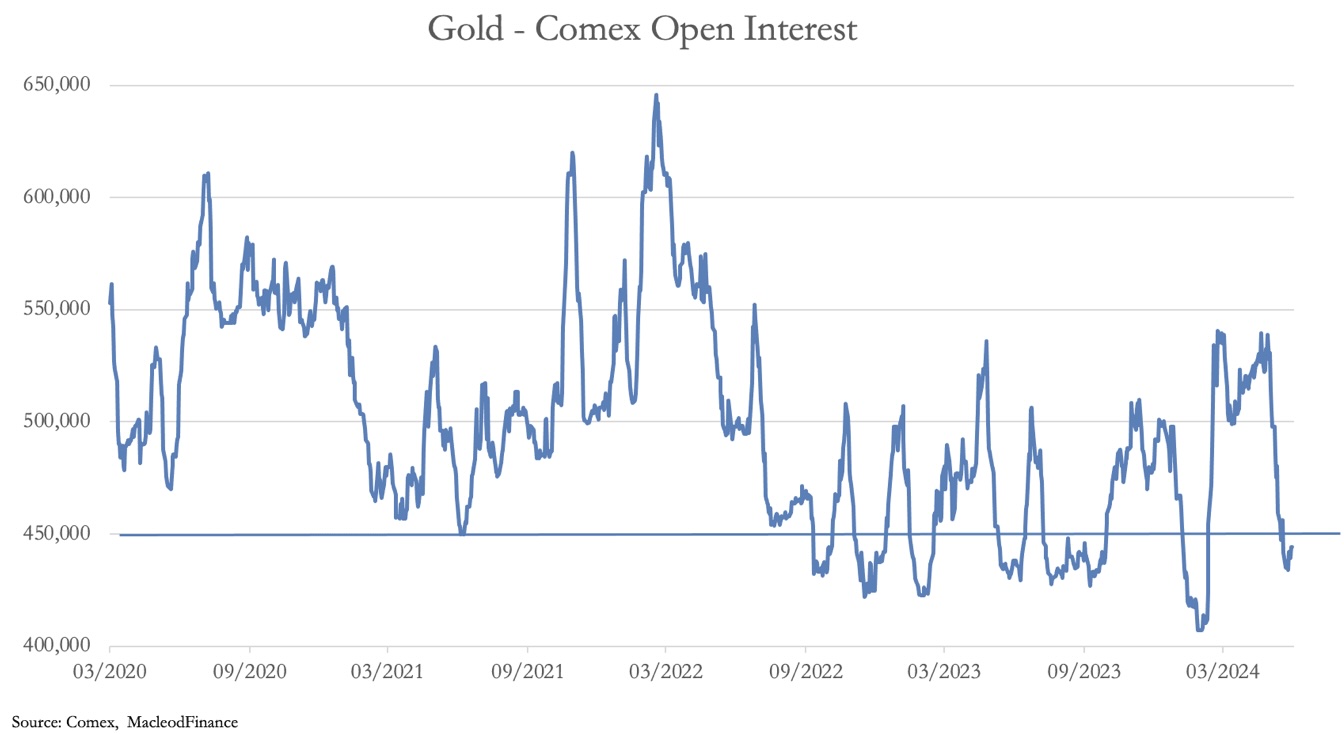
It is still below the oversold line at 450,000 contracts. But the speculative Managed Money category (hedge funds) is marginally overbought on a net basis:
Managed Money Starting To Chase The Golden Dragon…Again
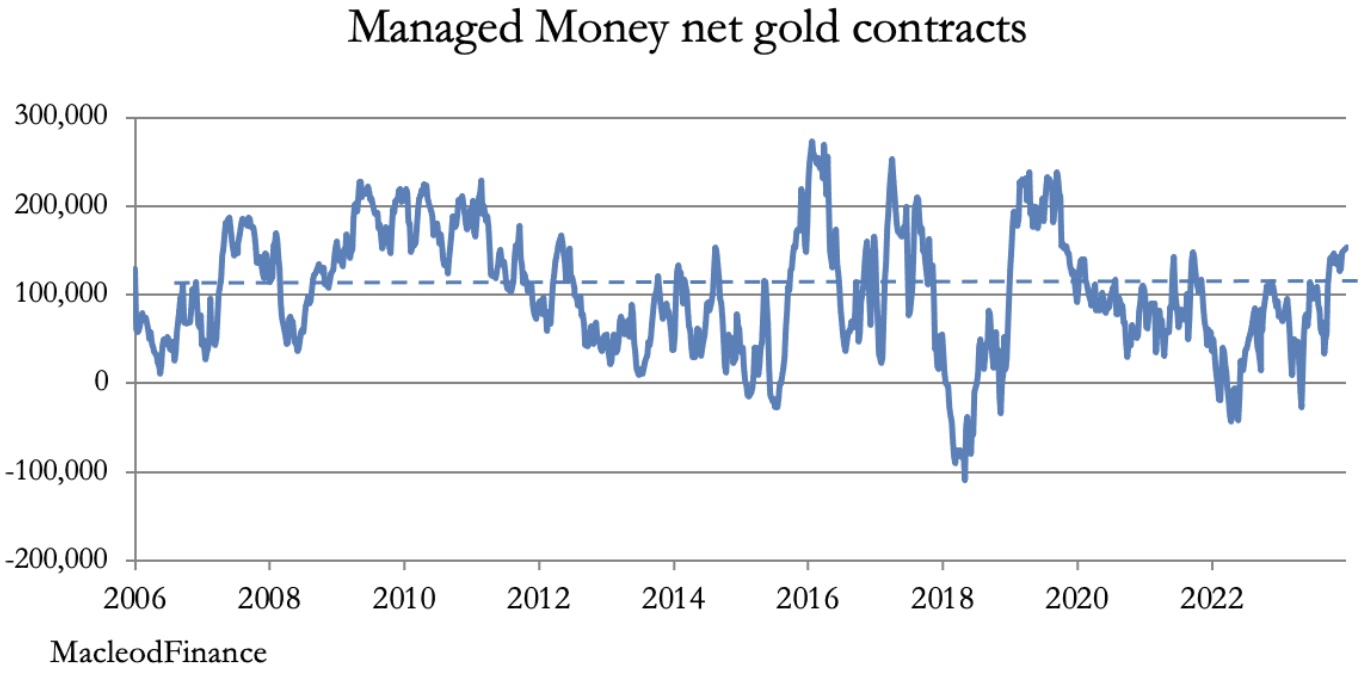
The long-term average net long exposure is about 110,000 contracts, shown by the pecked line. But being a net figure, the current position reflects a low level of short positions which in the last month have declined by nearly 27,000 contracts, rather than bullish longs.
The liquidation of ETF bullion supplies is grinding to a halt, which combined with a renewed wave of Far Eastern demand leaves western capital markets short of bullion. These are obviously difficult markets for the Swaps, made up in the majority by bullion bank trading desks whose dealers are jobbing against a background of increasingly limited physical availability.
Clues for next week’s price performance will be found in trading patterns ahead of London’s morning fix. If they begin to reflect Asian overnight demand, then we could be embarking on the next bull run. To listen to Alasdair Macleod discuss the wild trading in the gold and silver markets this week and much more CLICK HERE OR ON THE IMAGE BELOW.

© 2024 by King World News®. All Rights Reserved. This material may not be published, broadcast, rewritten, or redistributed. However, linking directly to the articles is permitted and encouraged.


