

Here is a critical update on gold, copper and oil futures.
UPDATE: Copper, Gold, Oil
July 23 (King World News) – Naveen Nair at Citi: Commodities charts remain interesting. Copper futures have dipped for 6 days in a row and look likely to continue in the near term. Brent is testing support at the 200w MA, which has held relatively well. Gold failed to close above a double bottom neckline on a weekly basis, but medium term techs continue to suggest a bullish picture. We detail more:
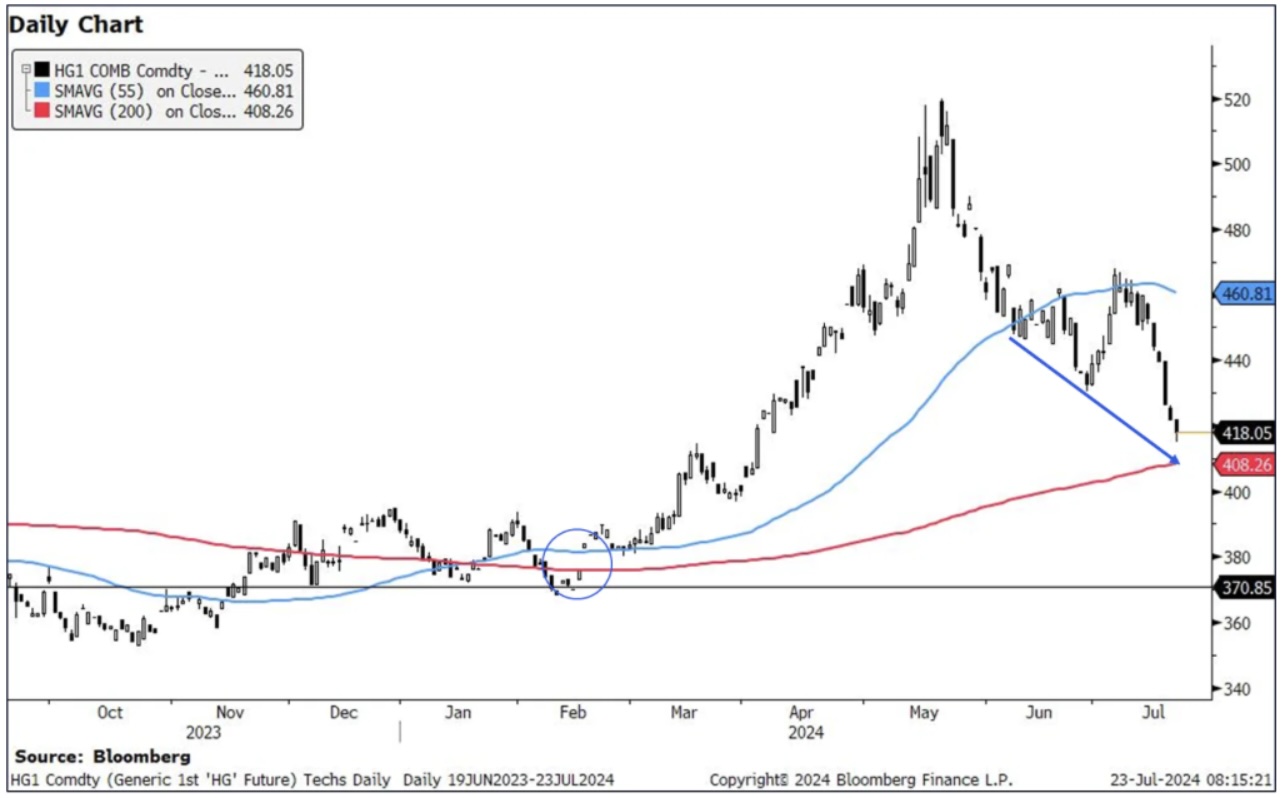
Copper futures (HG1)
Copper futures have slid for 6 days I n a row after testing the 55d MA earlier in July. With the 55-200d MA setup still in play, we expect prices to continue to dip in the near term towards the 200d MA at 408.26.
That said, we expect very strong support at 401.53-408.26 (55w MA, 200w MA, 200d MA). We also keep a close eye on weekly slow stochastics after it entered oversold territory. In the last three occasions we have seen a cross higher from oversold territory, it has suggested near term bounce in prices.
Daily Chart Of Copper Futures
Weekly Chart Of Copper Futures Now Oversold

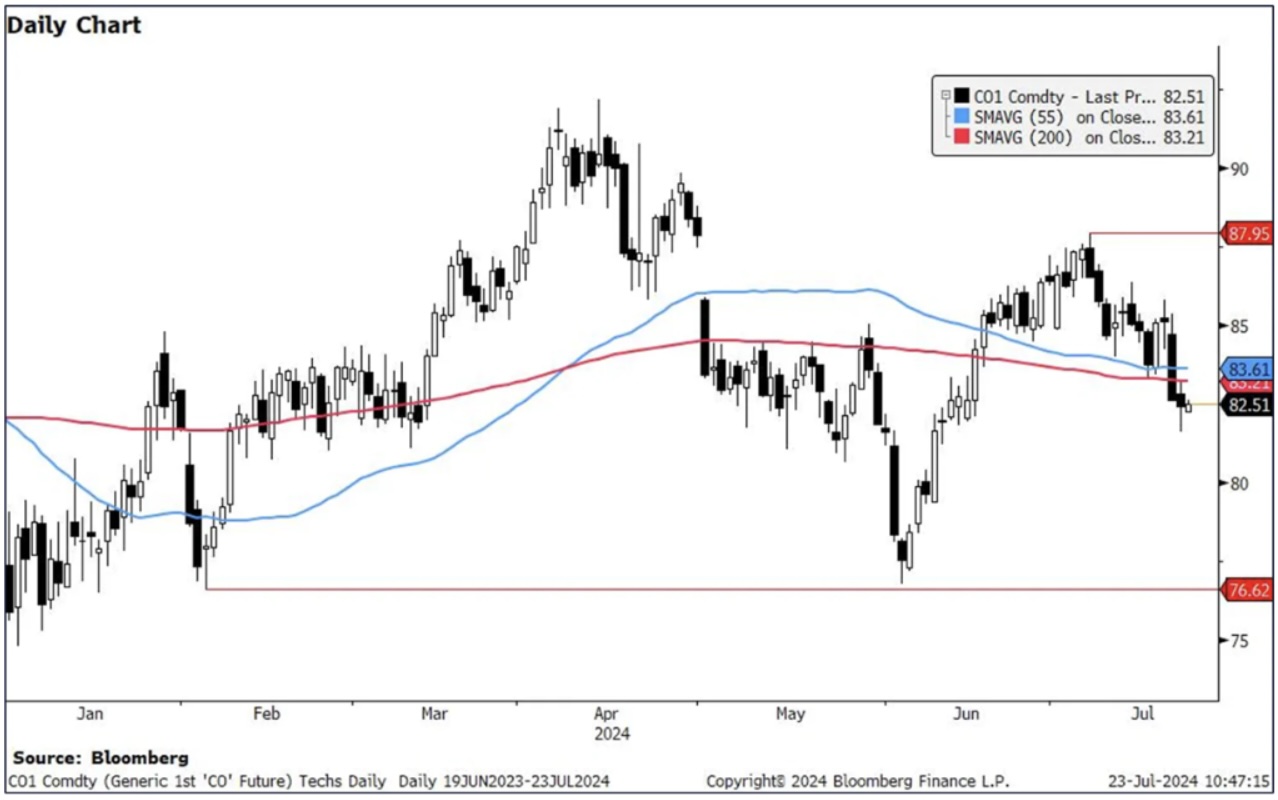
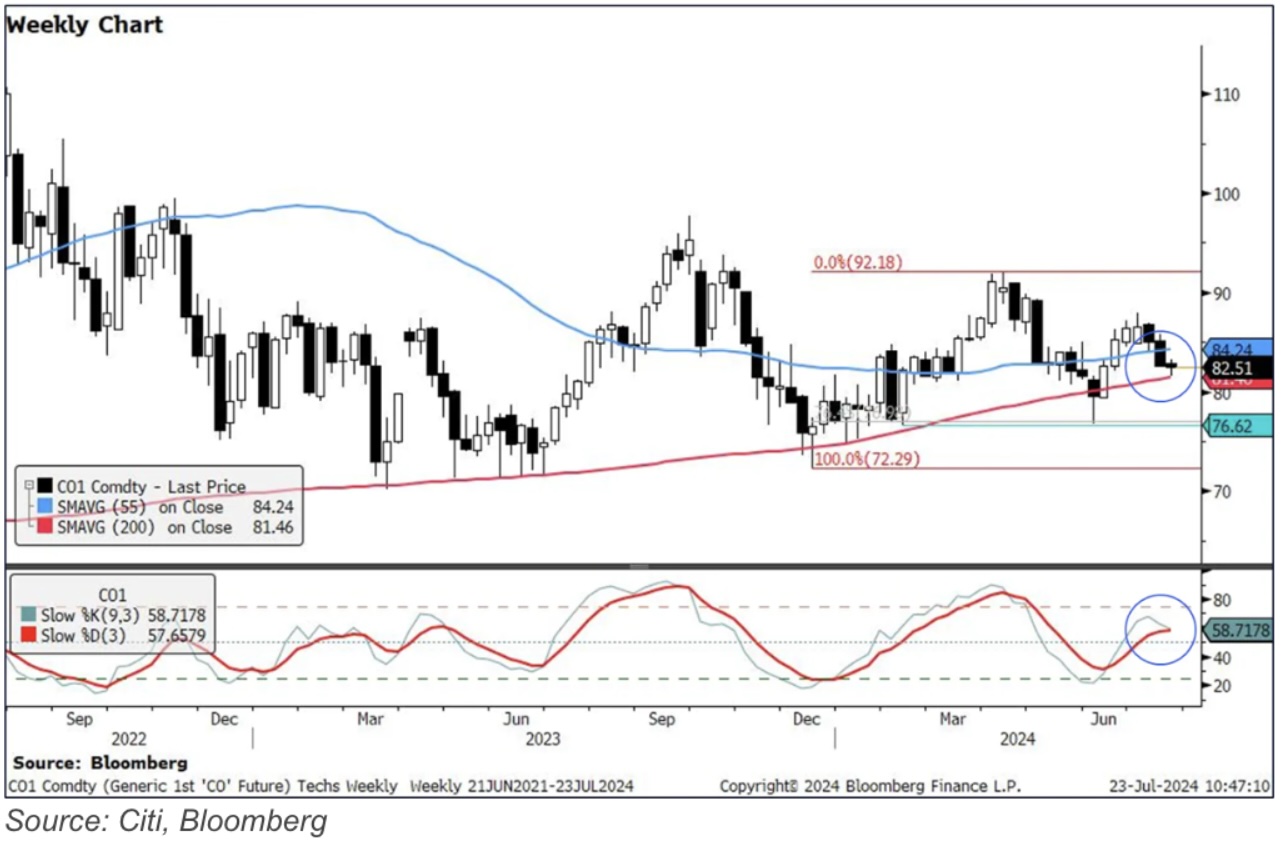
(Crude Oil) Brent futures (CO1)
Nearby brent futures have broken below support at 82.21-83.61 (200d MA, 55d MA). However, we have found support at the 200w MA at 81.46. This level is reasonably strong, having held well since 2023, with the only exception being a short break below in early June.
Keep a watch on weekly slow stochastics as well, which looks likely to cross lower. IF we close below the 200w MA, next support is at 76.62-76.76 (Feb and June 2024 lows).
Daily Chart Of Brent Oil Futures
Weekly Chart Of Brent Oil Futures
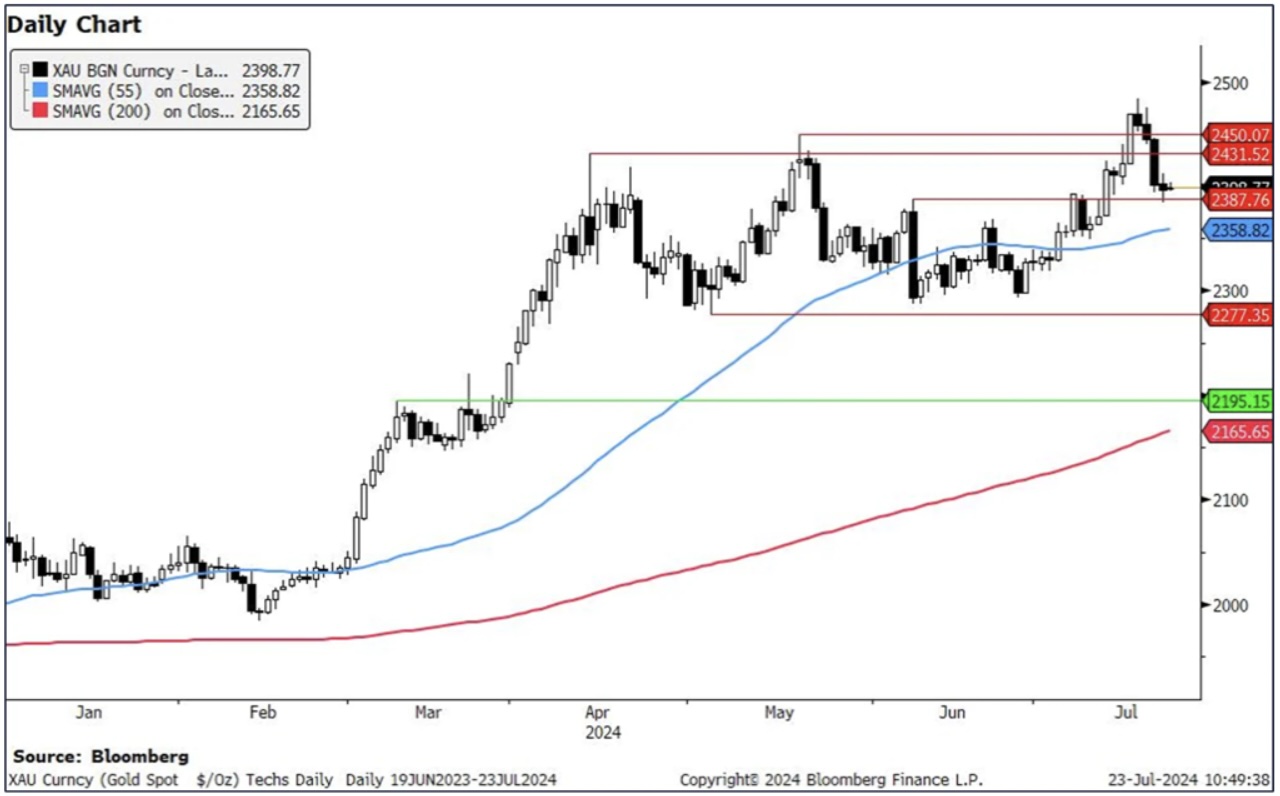
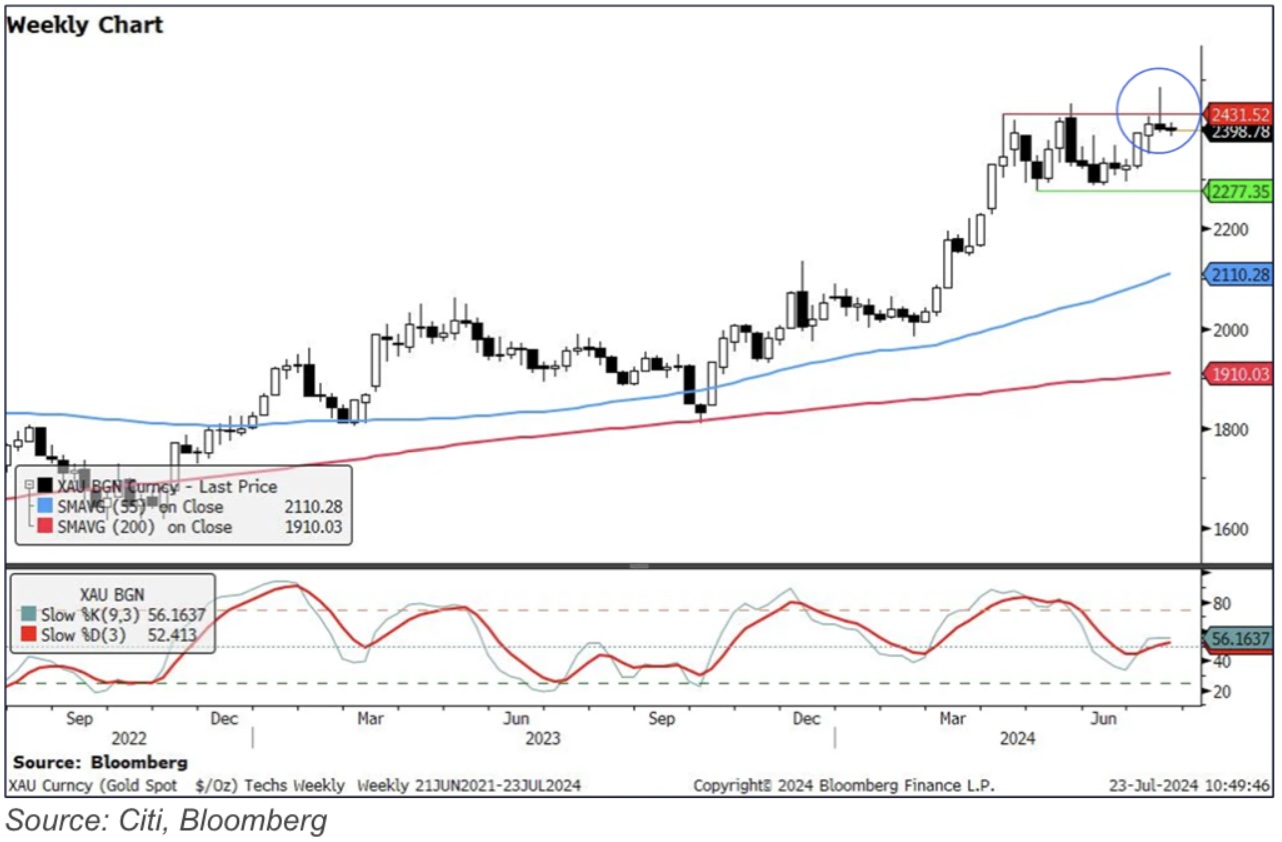
Gold
Last week, we wrote about why the techs picture for gold was bullish. Despite that, we did not see a weekly close above $2450 (May high and double bottom neckline). This puts a damper on short term bullishness, with support first at $2385.80 (55d MA)…
ALERT:
To learn about one of the greatest gold & silver royalty companies in the world CLICK HERE OR ON THE IMAGE BELOW.

Nevertheless, we flag the medium term picture remains bullish, with the inverted head and shoulders still at play. We still expect strong resistance at $2500-2523 (psychological level and inverted head and shoulders indicated target).
Daily Chart Of Gold Futures
Weekly Chart Of Gold Futures
Just Released!
Gerald Celente’s King World News audio interview has just been released discussing the gold market and much more and you can listen to it by CLICKING HERE OR ON THE IMAGE BELOW.

Released!
To listen to Alasdair Macleod discuss the wild trading in the gold and silver markets CLICK HERE OR ON THE IMAGE BELOW.

© 2024 by King World News®. All Rights Reserved. This material may not be published, broadcast, rewritten, or redistributed. However, linking directly to the articles is permitted and encouraged.


