Money flowing into gold breaks all-time record as the inflation nightmare continues.
Gold Takes In Record $11.3 Billion In March
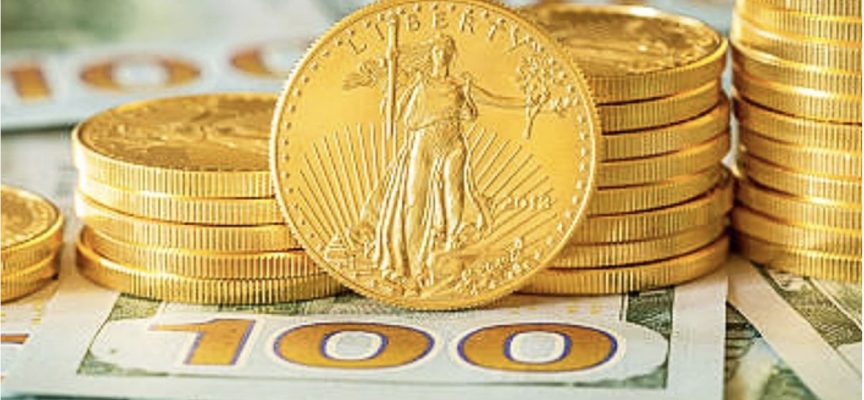
April 13 (King World News) – Gerald Celente: Last month, gold exchange-traded products (ETPs) took in a record $11.3 billion, according to Blackrock, as investors fled European equities while Russia’s Ukraine war raged on.
Investments grew fivefold from February’s amount, eclipsing July 2020’s record monthly inflow of $9.4 billion.
The surge drove gold’s price to $1,947 on 10 April, nearing the neighborhood of its all-time high of $2,074 in August 2020.
Total assets in gold are now worth just 1.8 percent less than the record total struck in October 2020, the Financial Times reported.
In contrast, outflows from European stocks set a record of $5.5 billion in March, subtracting almost the entire $6 billion invested in January, which was the strongest wave of buying in the market since 2015…
ALERT:
Billionaire and mining legend Ross Beaty, Chairman of Pan American Silver, just spoke about what he expects to see in the gold and silver markets and also shared one of his top stock picks in the mining sector CLICK HERE OR ON THE IMAGE BELOW TO HEAR BEATY’S INTERVIEW.

“We have now had eight consecutive weeks of European equity selling, the longest period since October 2020,” Karim Chedid, chief strategist for Blackrock’s iShares operations in Africa, Europe, and the Middle East, told the FT.
As a result, “Europe is at a bigger risk of stagflation than other developed market regions,” he said. “It’s more vulnerable to the energy shock” created by the Ukraine war.
Inflation and slowing growth are appearing in the price of European stocks, he noted.
“We need to see a peak in inflation so investors can know what they’re dealing with,” he said. “Before we reach that peak, it’s hard to see sentiment significantly turning around in Europe.”
In contrast, U.K. stocks took in a net $607 million in March, the most since last April.
“The FTSE 100 [Britain’s key stock index] is the only developed market country index that is up on the year,” Chedid said. The FTSE had gained 2.5 percent as of 8 April.
“This is driven by its tilt toward cyclicals, especially energy stocks,” he said, adding that valuations are “looking even more attractive than at the beginning of the year.”
Globally, exchange-traded funds focused on the financial industry witnessed a $7-billion net outflow of cash in March, following January’s record $11-billion inflow.
“We see a structural upturn in the intake of gold ETPs,” Chedid said.
When inflation rises to or beyond 7 percent, there is a close correlation between equities’ outflows and increased investment in gold, he noted.
More “Transitory” Inflation
Peter Boockvar: The March PPI rose 1.4% m/o/m, 3 tenths more than expected and the core rate was up 1%, double the estimate and that is even after a 2 tenths upward revision to February. Versus last year, the headline print was up 11.2% and the core rate by 9.2%.
Fake Inflation Numbers Show Core Producer Price
Inflation Up Only 9.2%. Real Inflation Higher
Energy certainly drove a lot of the headline increase but food and other commodities did as well. Goods prices headline rose 2.3% in the month alone and ex this, up by 1.1%. On a y/o/y basis, goods prices are up 15.7% and by 10% ex food and energy.
Service prices rose .9% m/o/m and 8.7% y/o/y. Higher transportation and warehousing prices drove the service side, along with airline and ‘traveler accommodation services.’ The price of ‘truck transportation of freight’ jumped 6.6% m/o/m in March and by 24% y/o/y. Now there are signs that these rate of increases are peaking but this is a major cost pressure point for many manufacturers as we know.
There is really little respite with respect to inflation in the pipeline. At the ‘processed’ stage, prices fell 1.4% from February but only after spiking by 13% in February. They are up 22% y/o/y. For unprocessed goods, prices jumped 9.5% m/o/m and 41% y/o/y. These are astonishing prints.
Bottom line, yea, the rate of change in consumer prices might top out because of the tough comps and growing signs of demand destruction but today’s PPI is a reminder that it will be a drawn out process because wholesale prices keep spiking. The end result is likely a big oncoming squeeze in profit margins. It’s a good thing earnings season is upon us so we can measure to what extent.
ALSO RELEASED: Silver And Gold Set Up Extremely Bullish, Plus That Giant Sucking Sound All-Time Records And Collapses! CLICK HERE.
ALSO RELEASED: GOLD BREAKOUT: Next Stop For Gold $2,035-$2,070 Then Higher, Plus Look What Crashed To Lowest Level In History CLICK HERE.
ALSO RELEASED: James Turk – The Surprise Leading The Gold & Silver Markets Higher, Mining Stocks Ready To Fly CLICK HERE.
ALSO RELEASED: The Financial Doomsday Clock Is Close To Midnight CLICK HERE.
ALSO RELEASED: $35,000 GOLD: But Gold’s Initial Surge Will Be A Wakeup Call CLICK HERE.
To listen to one of Gerald Celente’s greatest interviews ever discussing the BIS giving marching orders to central banks around the world to raise interest rates and end QE CLICK HERE OR ON THE IMAGE BELOW.
To listen to Alasdair Macleod discuss Russia setting up the gold market for a massive short squeeze CLICK HERE OR ON THE IMAGE BELOW.
© 2022 by King World News®. All Rights Reserved. This material may not be published, broadcast, rewritten, or redistributed. However, linking directly to the articles is permitted and encouraged.


