

Is this $800+ target for silver possible? Plus an important update on the gold market.
Gold
April 28 (King World News) – Naveen Nair from Citi: Gold prices have posted an evening star formation, and weekly momentum looks weak. This also comes as we rejected the 3500 handle earlier this week. Overall, while techs do not look bearish, they support the case that we could stay rather flat in the short term. We remind our Research team’s base case is for $3250 in Q2.
KING WORLD NEWS NOTE: Citi Says Technicals Also Support Their Base Case For $3,250 Gold In Q2 2025
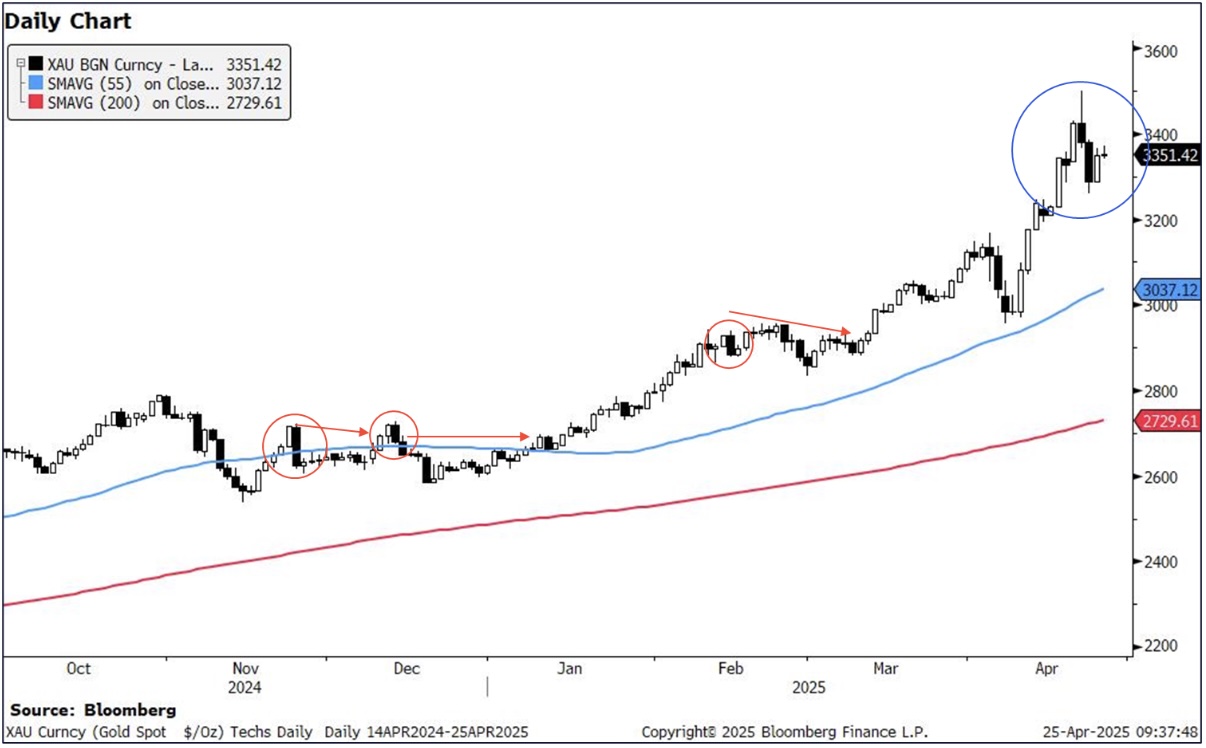
Gold spot has tested and rejected the 3500 handle, posting a clear evening star formation off that level. While this is typically a reversal indicator, and suggestive of downside, we think gold is more likely to hold in a short term range here.
Gold reversal indicators in the daily chart in the last two years have not been very indicative of large downside over 1-2months.
KING WORLD NEWS NOTE: Citi’s Naveen Nair Notes Reversal Indicators In Gold (BLUE ARROWS) Have Previously Only Suggested Modest Declines
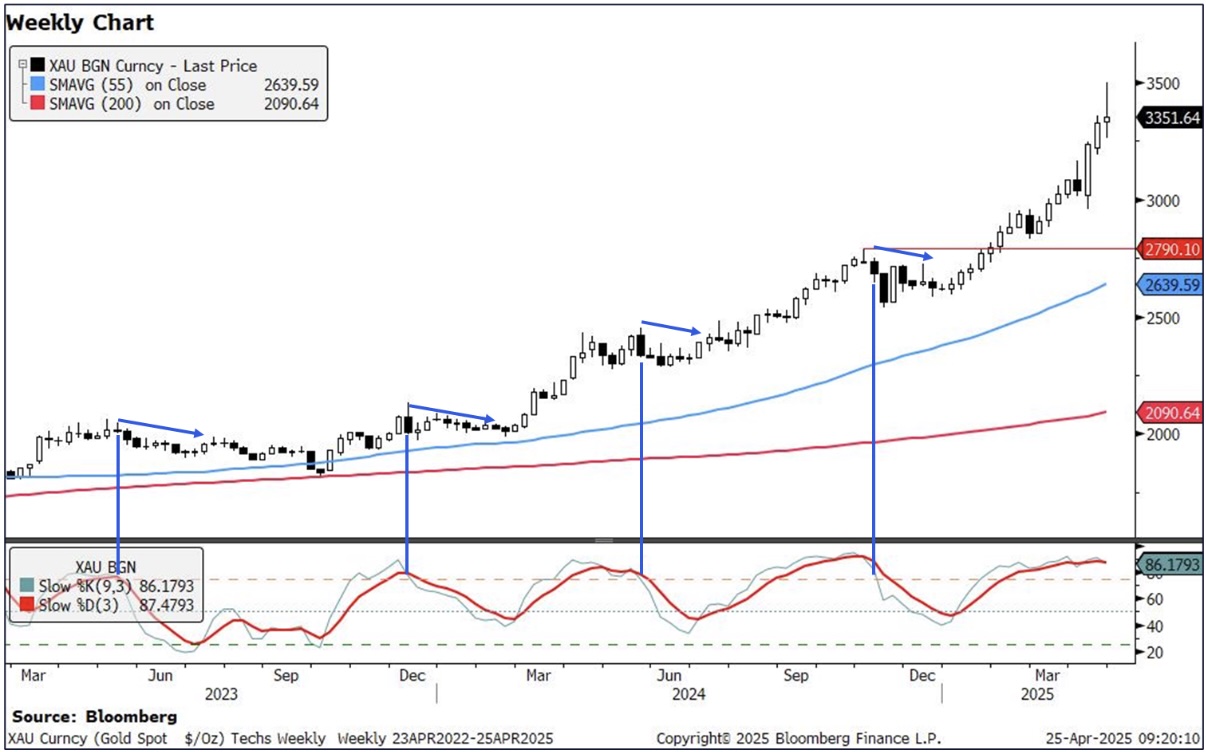
Momentum crossovers in the weekly chart, while more suggestive, also only suggests modest declines.
Nevertheless, the resistance indicators are also clear, with an evening star on the daily chart and with markets likely to post an inverted hammer candlestick in the weekly chart. As a result, we think we could see gold prices range in the 3260 (April 23 low) to 3500 (April 22 high, psychological level). Subsequent support is at 3037 (55d MA), though we note with the bullish markets, the risk is tilted towards a break higher.
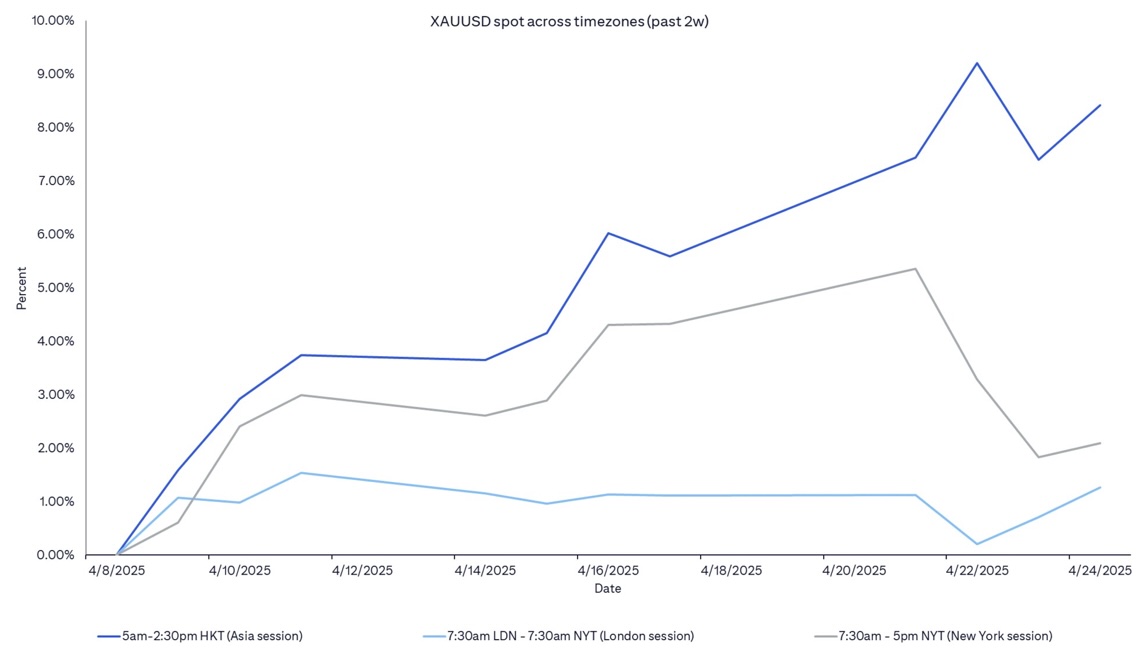
Strange Trading On US COMEX Market
Gold moves by timezones: Asia session continues to be strong for gold. London timezone has been more tepid for gold.
KING WORLD NEWS NOTE: Gold Rises During Asian Trading (TOP LINE), And Is Then Sold In The US On COMEX (BOTTOM LINE). This Pattern Has Been In Place For Decades
Silver’s Real All-Time High
Graddhy out of Sweden: Silver’s all-time high is not $50, it is $806 in 1998 US dollar value…
Silver had been in decline for 500+ years when it bottomed around the year 2000.
KING WORLD NEWS NOTE: Silver’s Real All-Time High (Priced In US Dollars In 1998 When This Chart Was Created) Was $806 In The Year 1480…It Is Even Higher Today!
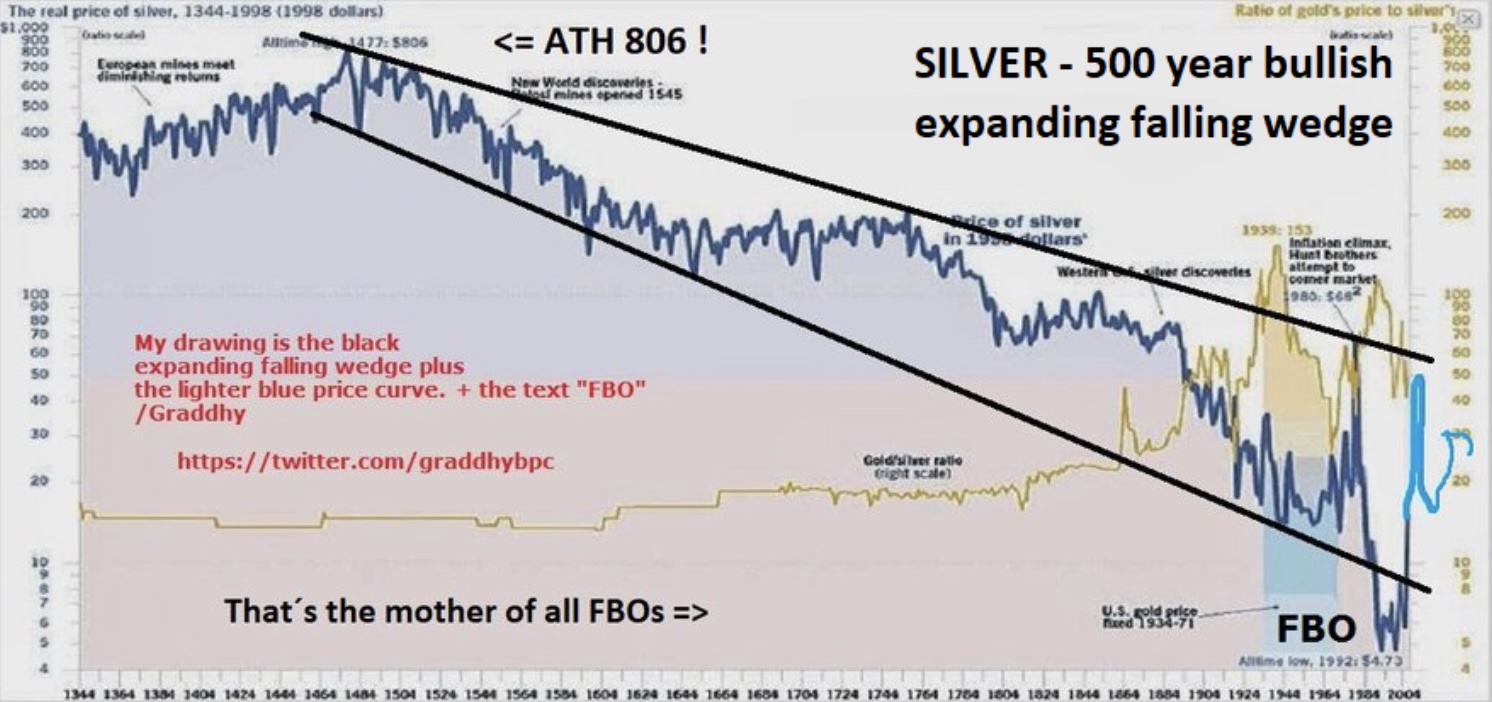
Could $800 happen briefly again when silver goes ballistic at the end of the commodities bull?
Absolutely.
The Next Bull Market
Graddhy out of Sweden: The chart below means that this lifetime commodities opportunity is about to once again go into overdrive.
KING WORLD NEWS NOTE: Commodities Coiling To Soar Higher!
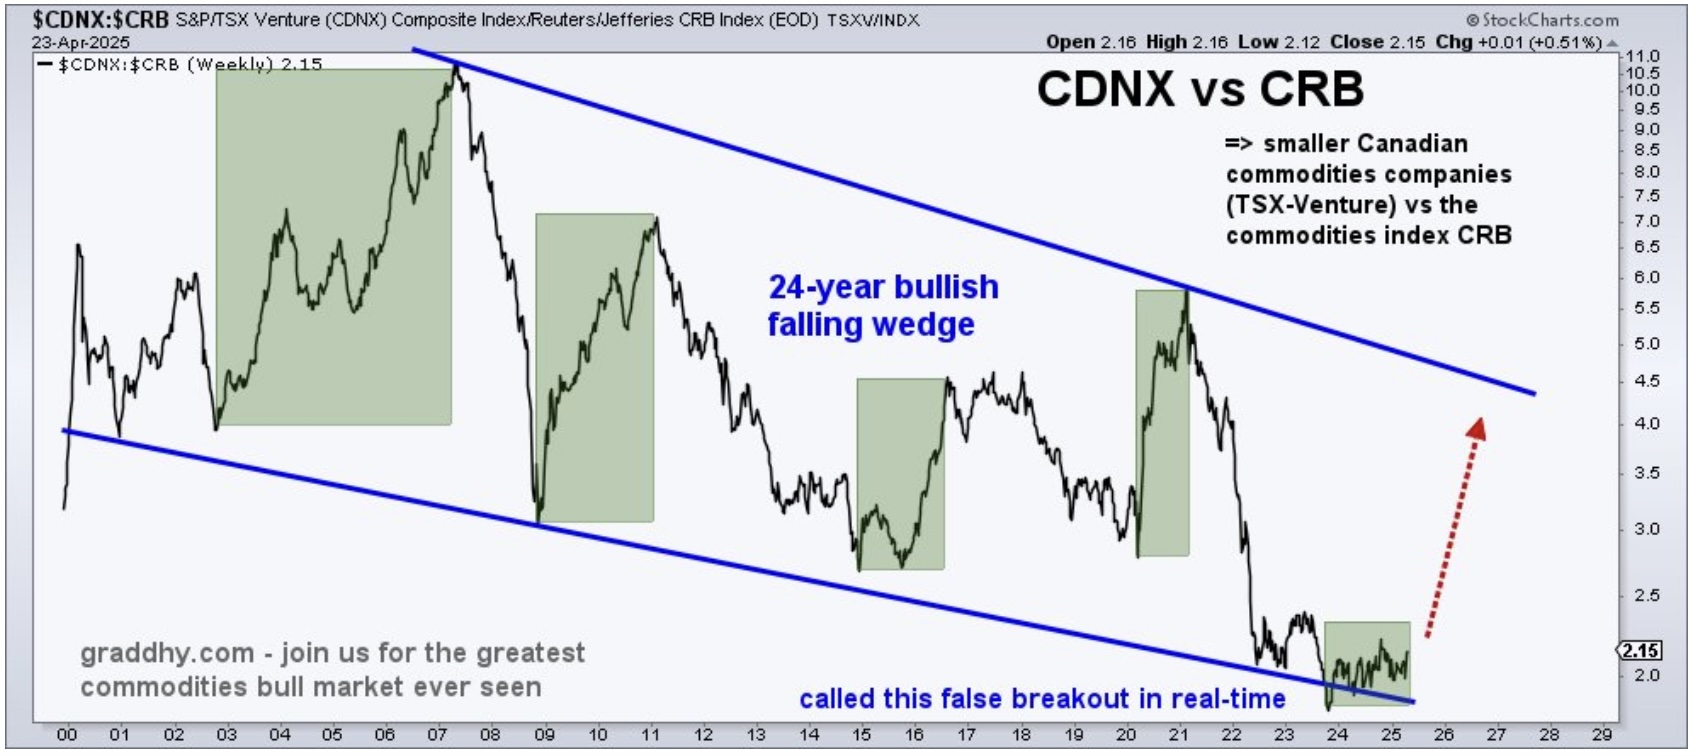
This ratio chart caught all previous big up-moves. And now it is backtesting, preparing to launch. This chart also shows how historically undervalued small/mid sized commodities companies are vs the commodities index CRB. For example, GDXJ vs gold, SILJ vs silver, and URNJ vs SPUT.
One Of Greyerz’s Greatest Interviews Ever
To listen to one of Egon von Greyerz’s greatest and most important interviews ever CLICK HERE OR ON THE IMAGE BELOW.

JUST RELEASED!
To listen to Alasdair Macleod discuss the pullback in the gold market as well as the advance in the silver and much more CLICK HERE OR ON THE IMAGE BELOW.

© 2025 by King World News®. All Rights Reserved. This material may not be published, broadcast, rewritten, or redistributed. However, linking directly to the articles is permitted and encouraged.


