

Here are two absolutely shocking gold charts that illustrate why prices are headed far higher long-term.
Gold
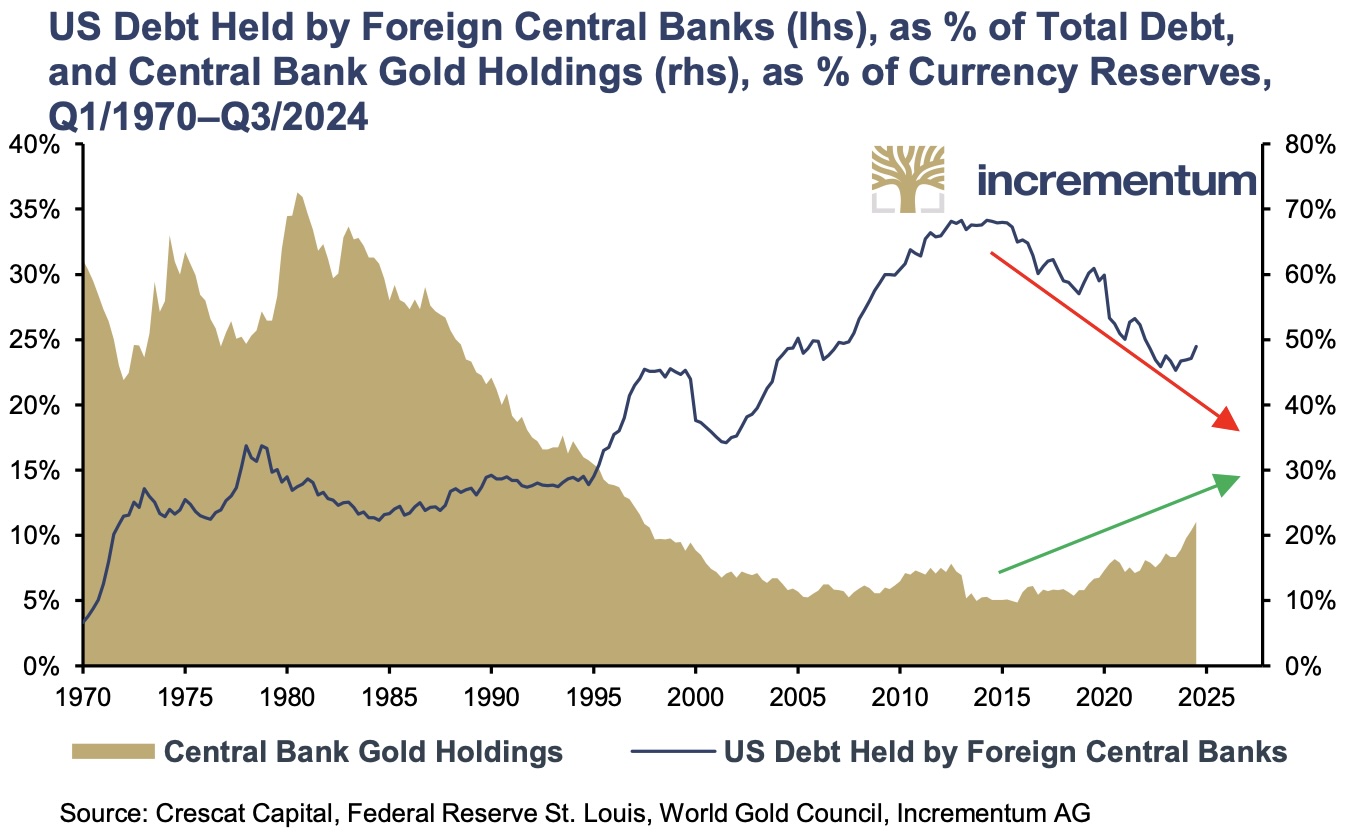
July 22 (King World News) – As you can see from the fantastic chart below from Ronnie Stoeferle at Incrementum, Central Bank Gold Holdings (shown in gold) vs US Debt Held by Foreign Central Banks (blue line) will eventually mirror what it looked like in the 1970-1980 time frame. Meaning, the price of gold has a long way to go to fully express this bull market.
KING WORLD NEWS NOTE: Central Bank Net Gold Holdings Set To Radically Increase vs US Treasury Holdings
What is also fascinating is how remarkably strong the price of gold performs during bear markets in stocks. Look at the astonishing gains for gold shown in the far right hand column below vs the S&P 500 during bear markets in stocks.
KING WORLD NEWS NOTE: Gold’s Shocking Performance vs the S&P 500 During Bear Markets (Sea Of Green On The Right)
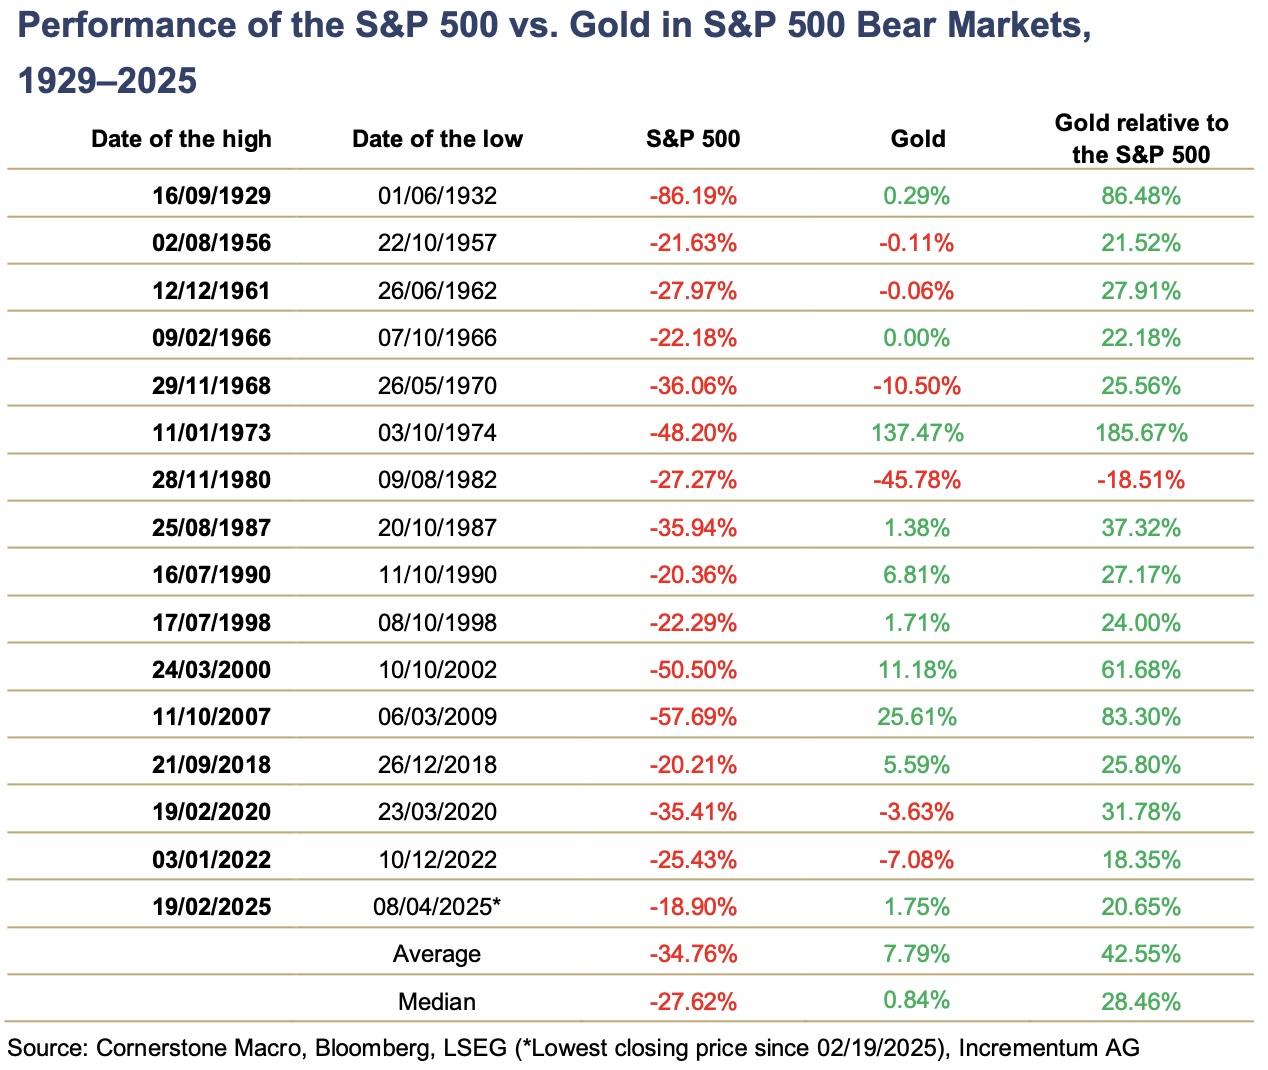
King World News continues: What the first chart reveals is that we will see a far higher gold price than what is being quoted today in order to dramatically increase central bank gold holdings vs US Treasury holdings. The second chart reveals how astonishing the performance of the price of gold is vs stocks during bear markets. All of this bodes very well for gold but badly for the general stock market.
US May Begin Stockpiling Silver As Strategic Reserve
To continue listening to Nomi Prins discuss why this would make the price of silver skyrocket as well as her thoughts on gold, uranium, and the mining stocks CLICK HERE OR ON THE IMAGE BELOW.

JUST RELEASED!
To listen to Alasdair Macleod discuss what to expect next in the gold, silver and mining share markets and much more CLICK HERE OR ON THE IMAGE BELOW.

© 2025 by King World News®. All Rights Reserved. This material may not be published, broadcast, rewritten, or redistributed. However, linking directly to the articles is permitted and encouraged.


