

The price of gold continues to surge to new all-time highs above $2,300. The price of silver has also begun to advance toward the $30 level, currently trading at $27.25.
Gold Is on the Rise and Reaches All-Time High
April 3 (King World News) – Paul Wong, Market Strategist at Sprott Asset Management: Gold is on the rise and reaches all-time high.
Key Takeaways
- Gold reached an all-time closing high of $2,230 at quarter end and is up 8.09% YTD after rising 13.10% in 2023.
- We believe several fundamental factors are in place for gold to potentially move higher, particularly strong central bank buying.
- Central banks’ strategic shift toward gold creates a new dynamic in gold pricing, breaking historical correlations. Their motivations and needs differ significantly from investment funds.
- Low options trading on gold (GLD calls and puts, CFTC futures) suggests muted price expectations despite strong central bank buying. There is potential for increased options activity to boost the gold price.
- We see three primary drivers for a higher silver price: 1) silver tracks rising gold due to central bank buying, 2) reflation trade and 3) increased solar panel demand.
First Quarter in Review
For the quarter ending March 31, 2024, gold bullion rose $166.89 (or 8.09%) to close at $2,229.87, an all-time closing high. After testing the $2,000 gold level several times in 2023, gold closed above that level in December and has not looked back. Several factors are pressing gold to new highs. Simplistically, a massive, relatively price-insensitive buyer (central banks and sovereigns) is providing persistent support. At the same time, another large cohort (investment funds as represented by CFTC and ETF positioning) is essentially caught in a short squeeze. Aiding the gold price are signs that the U.S. dollar (USD) is making a significant top, and yields are peaking as global central banks are set to begin a synchronized easing cycle.
The broad stock market has been moving higher as the Federal Reserve (Fed) maintains its outlook for three interest rate cuts in 2024, the U.S. economic growth outlook improves, inflation (though bumpy) continues to track lower, and the U.S. Treasury continues to place more issuances into the shorter maturity end of the yield curve. A phenomenal AI (Artificial Intelligence)-driven growth outlook has sparked higher earnings revisions while financial conditions remain highly accommodative, allowing equities ample scope for price multiple expansions. A soft landing, moderating inflation, accommodative central banks, ample system liquidity, a secular growth engine (AI) and easy financial conditions have fueled this “everything rally”.
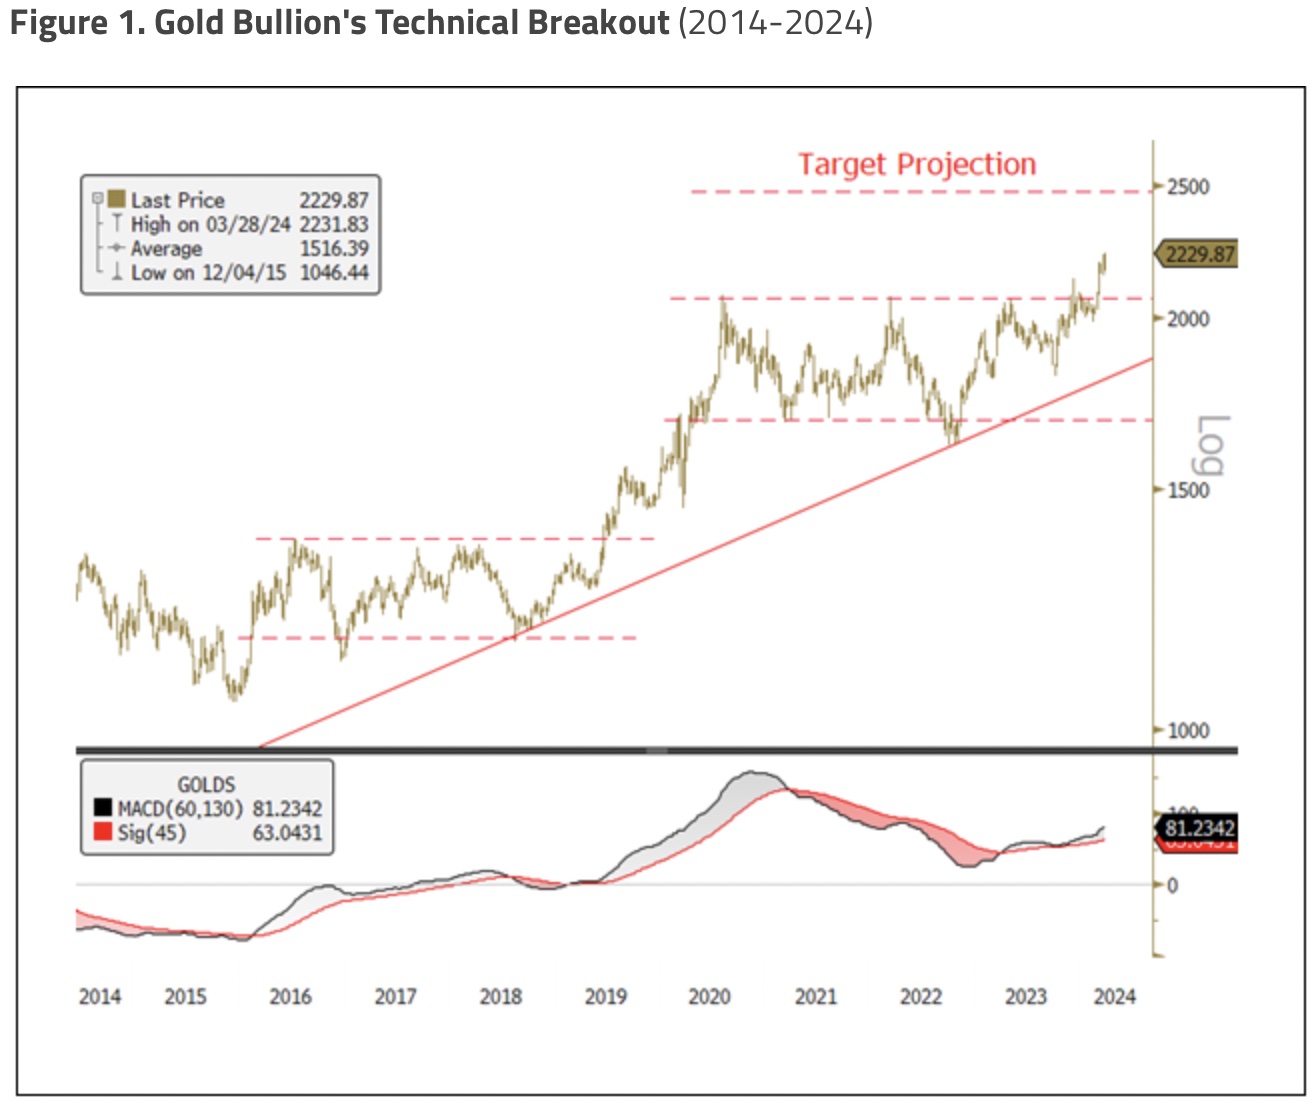
Gold Bullion Breakout
Figure 1 highlights the bullish gold chart progression over the past 10 years. After the 2016-2019 consolidation breakout, gold surged to $2,064 in August 2020 and went into a three-year consolidation trading pattern before breaking to new highs in March. In a familiar recurrence, the 2016-2019 gold price consolidation was driven by the Fed attempting to normalize its balance sheet (QT or quantitative tightening), and the breakout triggered by the Fed pivoting (the “Powell Pivot”) to easing and ending balance sheet normalization as the Repo market (a systematic important source of market function liquidity) became dysfunctional. The final thrust to $2,064 in August 2020 was due to the massive monetary response to the COVID-induced recession and financial system crisis. In the current situation, parallel to 2016-2019, the Fed has pivoted with pending interest rate cuts, the end of QT is in sight, and during Q4 2023, the U.S. Treasury market showed signs of extreme liquidity impairment, much like the Repo market experienced in the prior cycle.
Past extended bullish gold trends typically follow this pattern (although due to different causes): higher price thrust, consolidation and thrust. We believe several fundamental factors are in place for gold to potentially go higher, which we highlight in Figure 1.
Central Bank Buying Overwhelms Investment Funds Flow
Figure 2 highlights a comparative analysis of the two large cohorts of gold buyers: Central banks and CFTC plus ETFs combined (investment flows). The chart calibrated to zero starting December 31, 2015, the low of the current gold cycle. Initially, until mid-2020, central banks and investment funds were accumulating gold at the same pace on a net basis. Since Q3 2020, the buying pattern has diverged dramatically, with central banks adding a net 2,630 metric tons (MT) while CFTC and ETFs sold a net 854 MT to the end of 2023. Notably, around mid-2022, the buying of central banks intensified during the Russia-Ukraine war and the subsequent seizure/freezing of Russia’s FX (foreign exchange) reserves. As of December 2023 (last reported central bank positioning), the delta has widened to over 2,980 MT (or 95.8 million ounces).
We have discussed the motivations for aggressive central bank buying in past commentaries, especially our February 2023 posting (First Gold Dip Since Central Bank Buying Spree). Factors influencing their decisions include the pressing need to diversify reserves in light of potential sanctions and the risk of foreign exchange reserve seizures. There is also a growing preference for “outside money” (assets not linked to any specific country) in central bank reserves, a reaction to the trend of USD weaponization and moves toward de-dollarization, a strategy to hedge against inflation and the impact of relaxed monetary policy on global currencies and sovereign bonds, and a means of insuring against the escalating geopolitical tensions associated with deglobalization.
The critical point is that over the past one and a half years, central banks have increased their average quarterly gold purchases to 313 metric tons versus the pre-2022 decade of 127 metric tons (2.5x greater), altering their strategic rationale. Central banks’ objectives and purchasing logic have diverged significantly from those of investment funds. This change is a crucial driver for the current departure of gold bullion pricing from the correlations and patterns observed in the last 20 years. Also, note that the size of central banks (and sovereigns) dwarfs any investment flow, and their definition of a “store of value” for sovereign reserves vastly differs from an investment fund’s definition of a “store of value”, both in meaning and size.

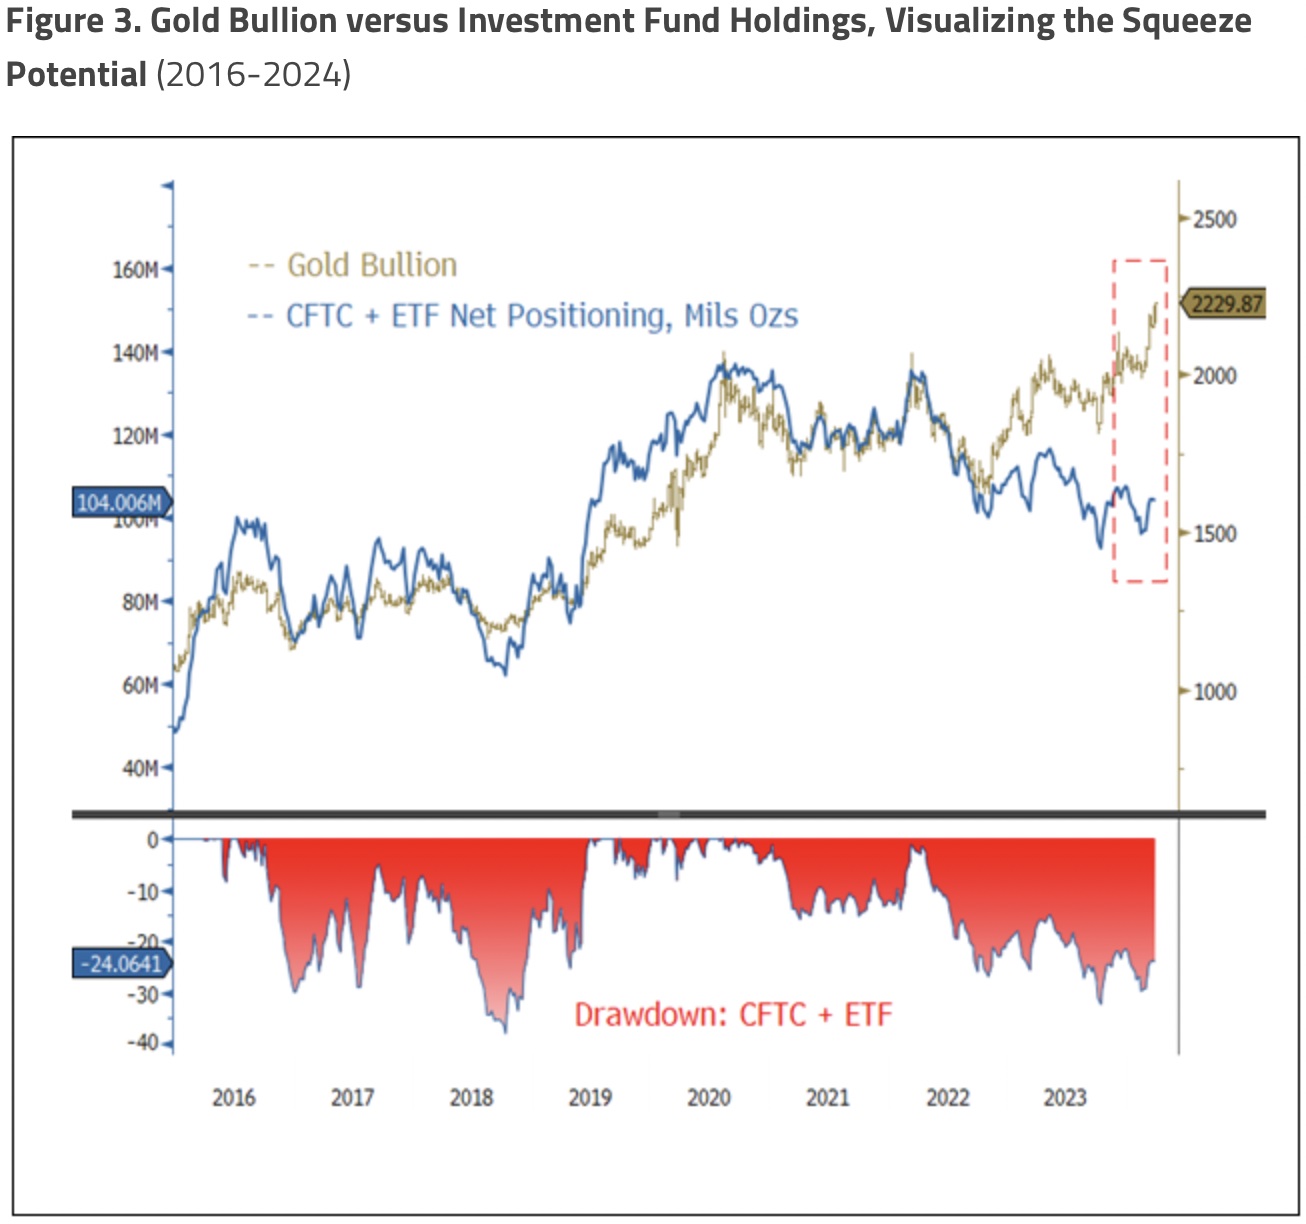
Investment Funds, CFTC and ETFs, Are “Effectively Short Gold”
Figure 3 illustrates a significant divergence in the gold market. While central banks and sovereign purchases have driven gold prices to record highs, the gold holdings by CFTC and ETFs have decreased, falling back to levels last seen in mid-2019 when gold was at the $1,375 resistance. This trend has continued into the year-to-date (YTD) 2024, with further reductions in their gold positions. The lower panel of Figure 3 shows that the current scale of drawdown in CFTC and ETF positions would typically be associated with a sharp gold price correction or even a bear market, yet gold prices are at all-time highs.
Despite no significant news events or market catalysts on Friday, March 1—particularly with Asian markets closed—gold prices broke out from a multi-year consolidation pattern. The breakout was not driven by any clear external trigger, suggesting that it may have resulted from forced short-covering. Unlike spikes caused by specific risk events, which tend to reverse as traders take profits quickly, this sustained breakout suggests the market has more enduring strength. Investment funds, including CFTC and ETFs, appear to be “effectively short gold,” given their very low gold exposure. Our previous commentaries have pointed out that the widening gap between gold prices and CFTC and ETF positions was unsustainable and may likely to lead to a price squeeze, which the market is now witnessing unfolding. The purchasing behavior of central banks and sovereigns is creating a rising price floor for gold, acting as a de facto “gold put”.
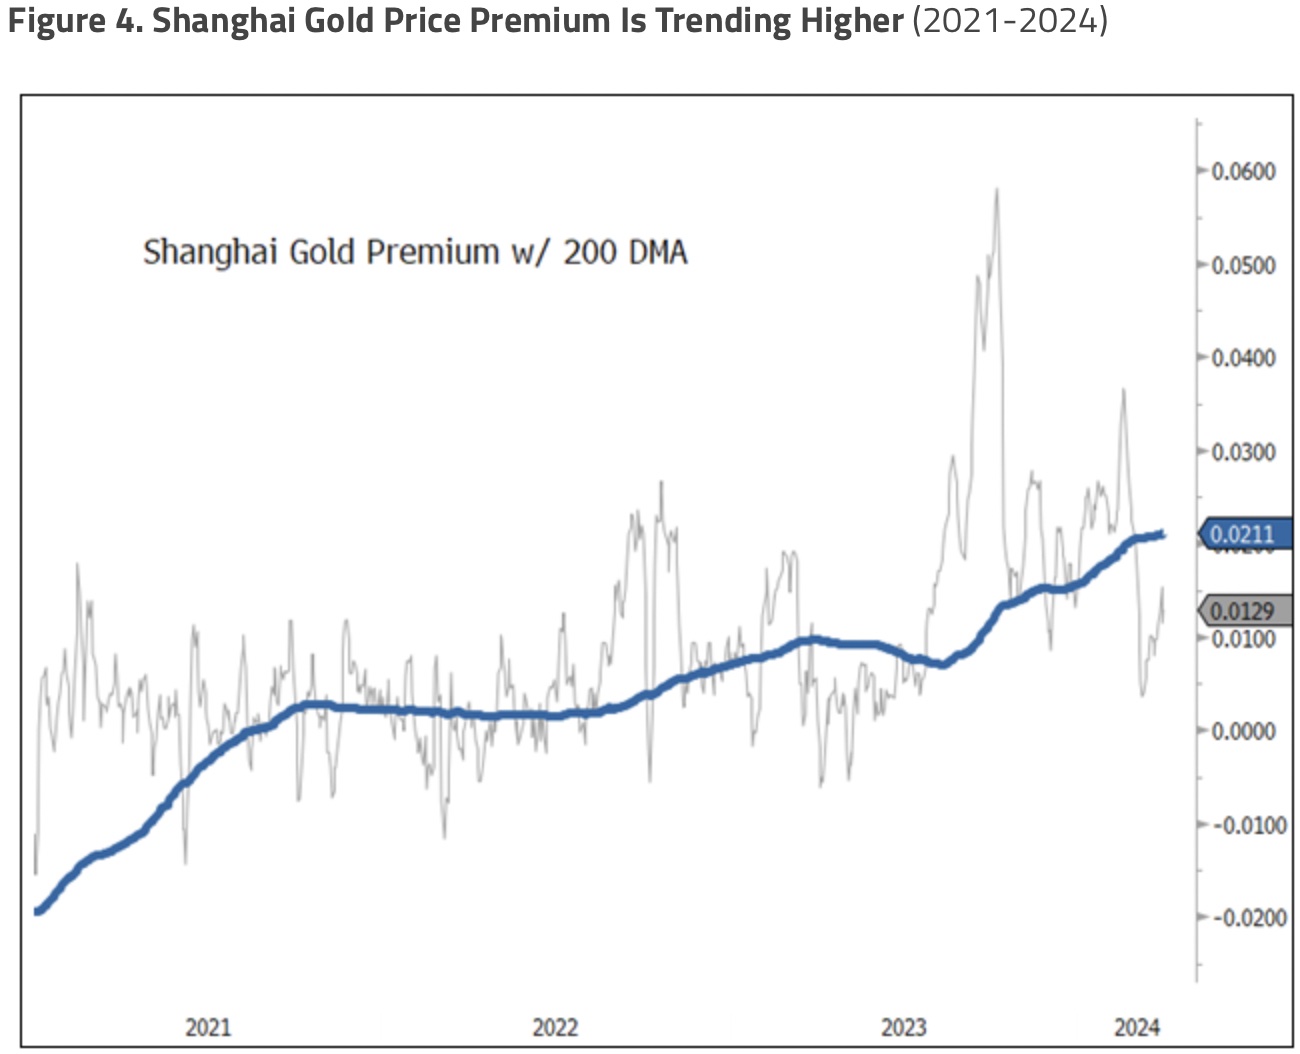
The Shanghai Gold Price Premium
The Shanghai gold price premium is the difference in price for an ounce of gold between the Shanghai Gold Exchange (SGE) and the global gold price, typically benchmarked against the London Bullion Market Association (LBMA) or New York COMEX. The higher the premium, the more willing buyers in China are to pay for gold over the international price, providing a live implied demand indicator (see Figure 4). The blue line in Figure 4 is the 200-day moving average of the gold premium, indicating a growing demand trend. The spike in Q3 2023 was related to the turmoil in China’s real estate market as prices fell amid negative credit headlines, and the recent pullback is associated with the recent price spike. There is clear evidence—although difficult to fully quantify—that the general population is buying gold as a hedge to protect against their high wealth exposure to the fragile property market.
There is no live data on central banks and sovereign buying, but typically, they do not chase higher prices but resume buying on pullbacks. For example, the Shanghai gold price premium fell from a +1.8 standard deviation reading to a -2 standard deviation level (two-year range), meaning gold buying from China faded as prices spiked. In the longer term, the question will be what the new floor price is likely to be for gold from central banks and sovereigns. Assuming global tensions persist and the trend toward deglobalization continues, central banks and sovereigns may likely maintain a supportive influence on gold prices, similar to the “Fed put” in financial markets.
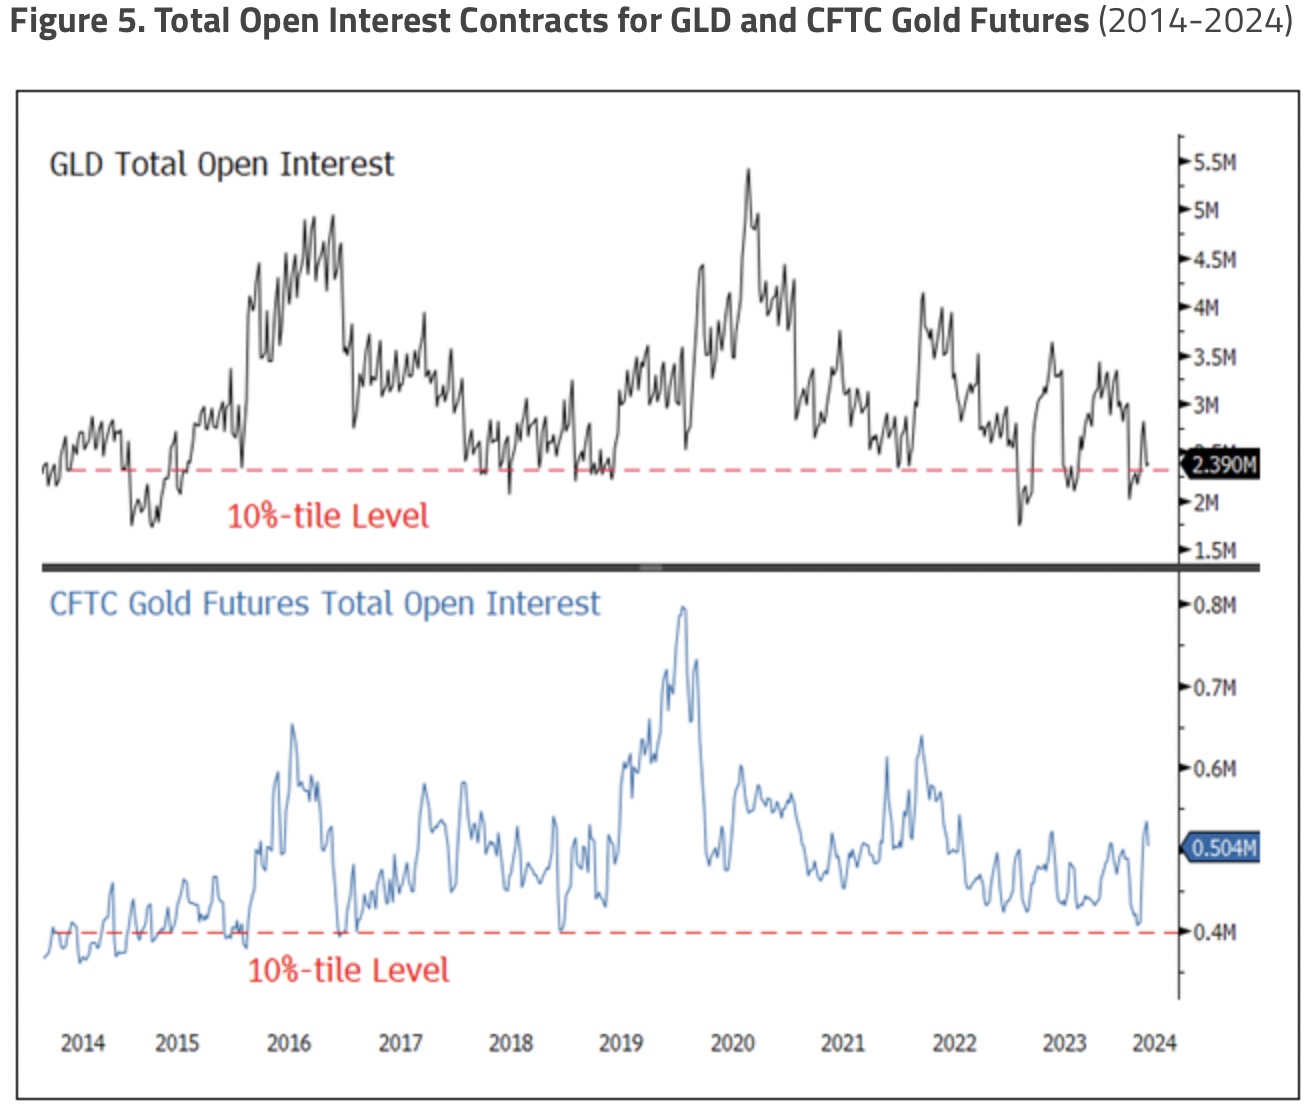
Options Are Another Potential Gold Market Mover
Options trading has a historical precedent for affecting gold prices. Figure 5 shows the total open interest on GLD and CFTC gold futures contracts. Both show that low multi-year readings were reached (the red dashed marks the 10% percentile level over the past 10 years). If options activity picks up (especially if implied volatility increases), there could be another significant source of bullish market influence for gold. The low open interest readings suggested that price expectations were muted for gold despite the enormous central bank and sovereign buying.
The first panel of Figure 5 shows that GLD’s total open interest (calls plus puts) is at the low end of its 10-year range, near the 10%-tile 10-year range. The notional value of the GLD total open interest is about $49.2 billion at quarter end. The second panel highlights the total open interest in CFTC gold futures over the past 10 years, reaching the 10%-tile level in February. The notional value of the CFTC gold total open interest is about $112 billion and has picked up in March. Relative to historical positioning levels, there is considerable potential for GLD and gold futures to increase open interest levels and serve as a potent bullish force on the gold market.
Silver Update
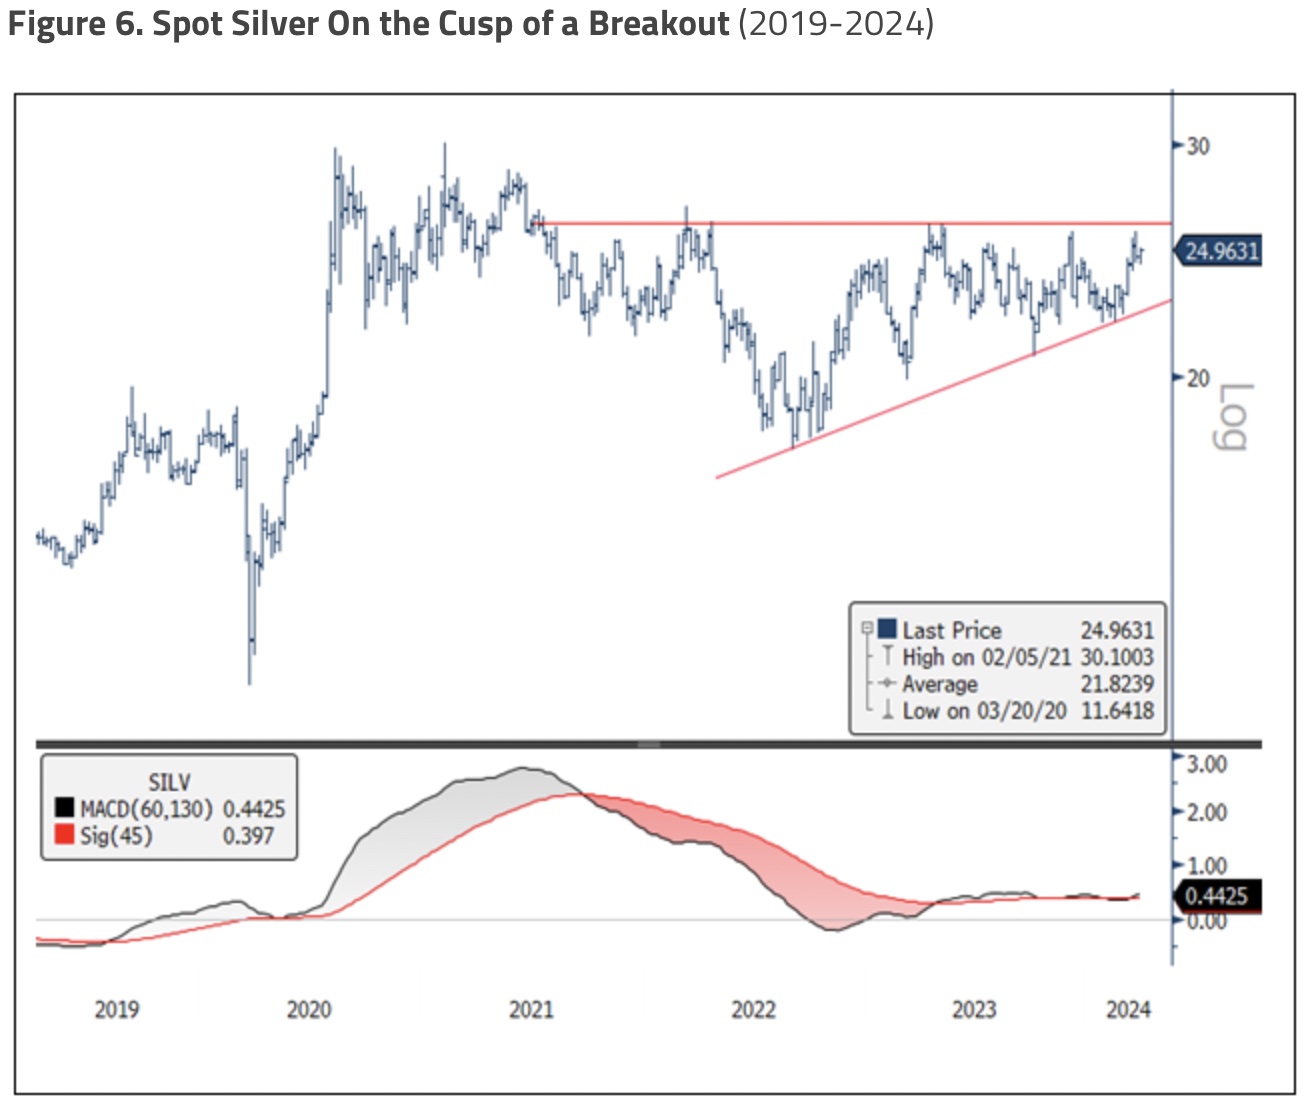
For the March 31, 2024 quarter, silver bullion rose $1.17 (or 4.91%) to close at $24.96, just below some critical technical price levels. Figure 6 highlights silver sitting just below a significant breakout level of a bullish triangle. There are several possible bullish patterns (fractal iterations), with the differences mainly related to the timing and pattern progression of the price trend. The main point is that multiple bullish configurations (market psychological imprinting) are not typical and reinforce the bullish narrative. All the potential chart patterns on silver bullion project a price of at least $30, the breakout level required to set multi-decade-long chart patterns into motion.
The Main Drivers for a Silver Price Breakout
We see three primary drivers for a higher silver price: 1) silver maintaining its monetary value as gold prices go higher from central bank and sovereign buying, 2) silver’s correlation to the reflation trade and 3) the massive consumption of silver for photovoltaic panels due to the new growth phase for U.S. electricity demand.
1. Monetary Value of Silver Holding
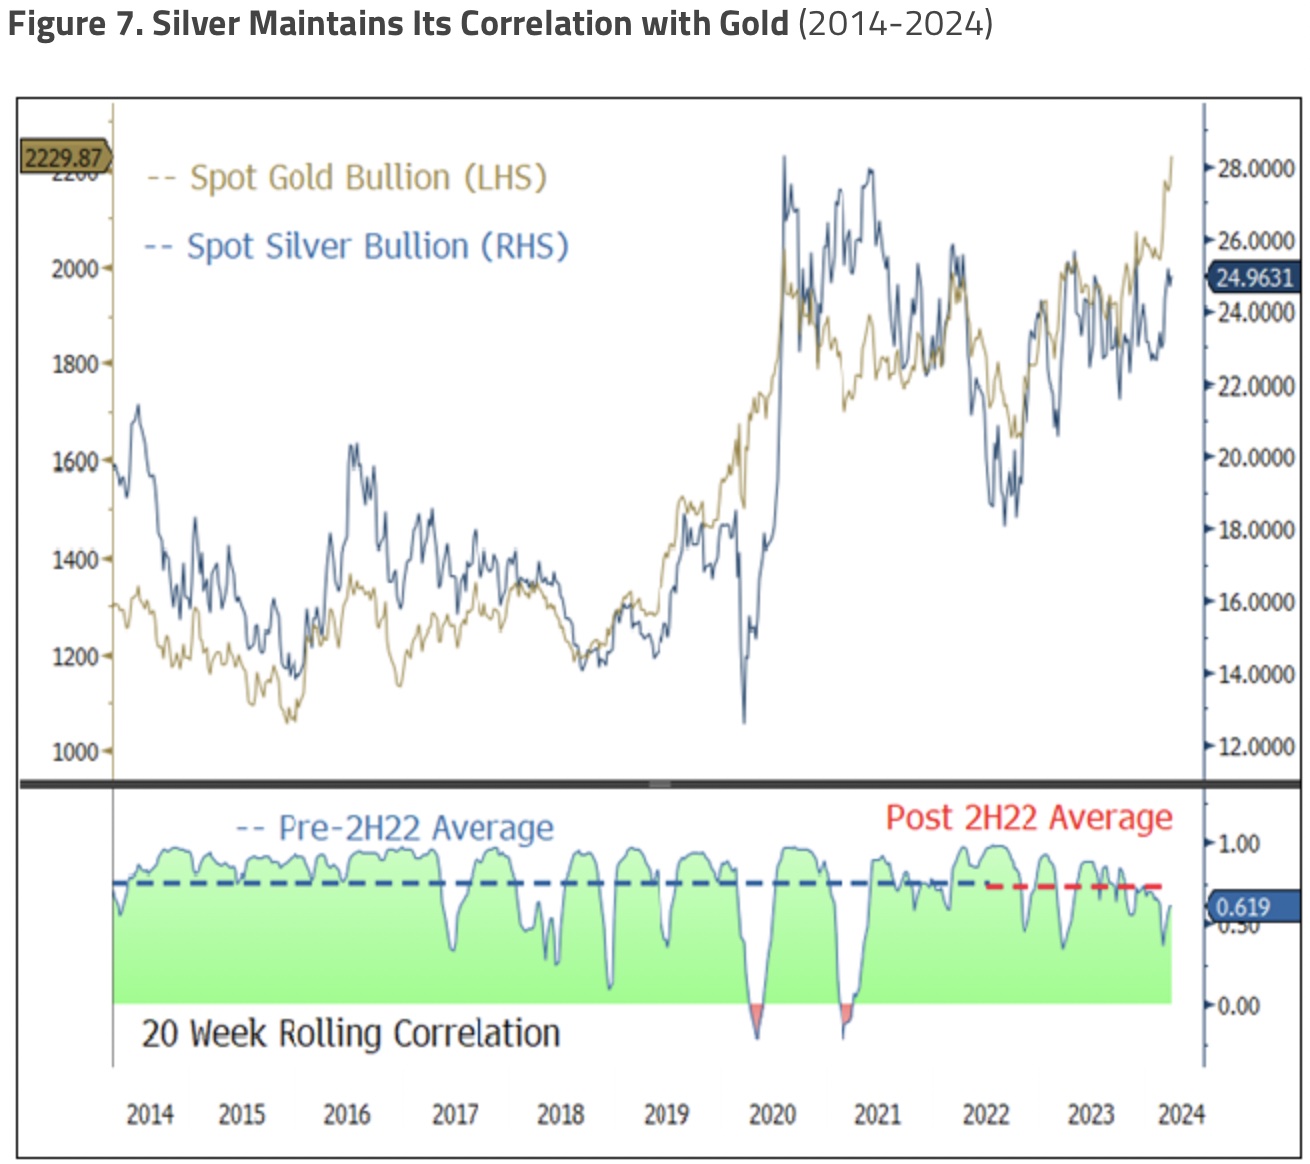
The primary macroeconomic driver remains central banks and sovereigns buying gold. Silver has lagged mainly because central banks and sovereigns are not buying silver. Despite this, with its associated reserve monetary value, silver has not broken its correlation with gold. Figure 7 highlights the rolling 20-week correlation of gold and silver over the past 10 years. The pre- and post-2H2022 correlations (the start of the massive central bank and sovereign gold buying) remain identical. Silver prices are anticipated to be drawn upward in tandem with gold due to its continuing alignment with gold’s monetary value.
2. Silver’s Economic Correlation
Silver has long correlated with economic activity due to its wide range of industrial applications. For this reason, silver and copper are well correlated with a 0.73 R-square since 2000. Global central banks (ex-Bank of Japan) are now entering a synchronized easing cycle, which is likely to benefit the reflation trade. Commodities like copper—and, by extension, silver due to their similar economic correlation—may likely perform well as high beta plays of this reflation trade. Generally, the higher the reflation expectations, the better the commodity cyclical trade plays out. We believe most reflation-linked assets are underweighted as recession forecasts have only recently dissipated.
3. Silver in the Solar Energy Sector
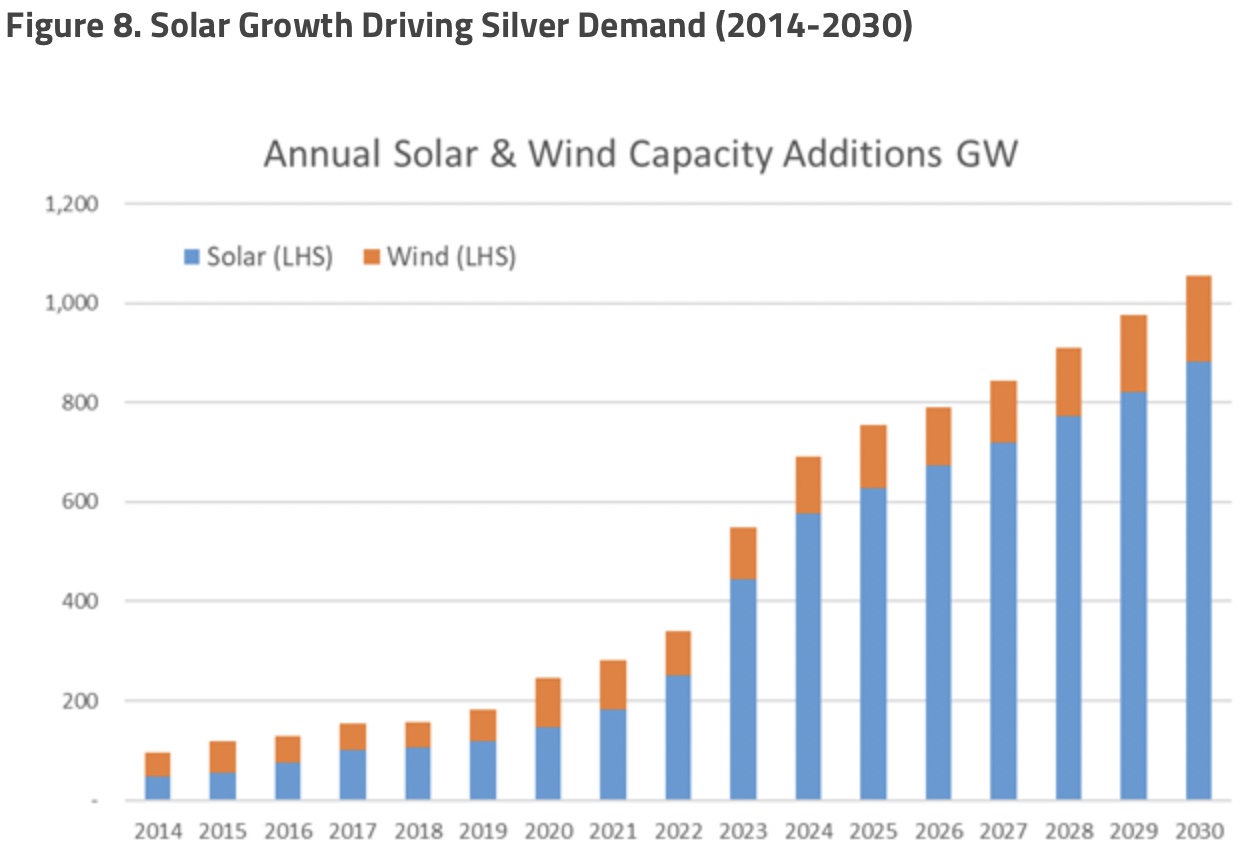
Our February 2024 Energy Transition Materials Commentary highlighted the explosive growth in solar power generation now that it’s the most cost-effective source of electricity. For the past 20 years, growth in electricity demand has been only 0.4% per annum, well below GDP (gross domestic product), mainly due to gains in energy efficiencies. We will have more details in our upcoming Energy Transition Materials report on electricity demand growth, but U.S. electricity demand is on the brink of a significant growth phase. U.S. policy and the accompanying fiscal spending continue to accelerate the reshoring of the U.S. industrial and manufacturing base and their associated supply chains. The preliminary data for the rise in electricity demand from the expected growth in AI-related use are staggering. Demand from other electrification strategies, cryptocurrency mining, data centers, etc., is expected to increase the electricity demand growth curve.
Figure 8 highlights the sharp increase in the deployment of photovoltaic systems by 2030, with a pronounced spike in 2023 followed by consistent growth. This forecast suggests that current estimates of solar power demand may be too conservative, especially considering the uptick from AI technology, manufacturing reshoring and broader electrification trends. Notably, the demand for solar power in 2030 is projected to be more than triple that of 2022 on this conservative forecast.
For more information on silver and photovoltaics, please see our two prior reports:
• Central Banks Support Gold & Solar PV Demand Buoys Silver
• Silver Demand Grows as Solar Leads Renewables
Given these considerations, silver inventory and production dynamics are poised to play a significant role in the silver market. The combination of a potentially dwindling free float of silver, steady demand from traditional sectors, and escalating requirements from the burgeoning solar energy industry, particularly with the transition to more silver-intensive technologies, underscores the likelihood of a more pronounced impact on silver prices. This scenario, coupled with the three previously outlined drivers—silver’s monetary value, economic correlation and critical role in the solar sector—further solidifies the case for a silver price breakout in the foreseeable future.
JUST RELEASED!
Michael Oliver on gold hitting all-time highs and why silver is set to explode higher along with the mining stocks CLICK HERE OR ON THE IMAGE BELOW.

To listen to Alasdair Macleod discuss gold hitting new highs and what surprises are in store for next week CLICK HERE OR ON THE IMAGE BELOW.

© 2024 by King World News®. All Rights Reserved. This material may not be published, broadcast, rewritten, or redistributed. However, linking directly to the articles is permitted and encouraged.


