

Bears have been having their revenge, but stocks may be set for a rebound.
US stocks: Bearish, but watch for a potential bounce
April 7 (King World News) – Naveen Nair at Citi: Technical indicators suggests that the sell-off in US equities (S&P 500 and Nasdaq Composite) could continue in the near term, with strong supports only likely at their respective 200w MAs. That said, however, we warn that weekly slow stochastics for both is now in deeply oversold territory. We have only been this deeply oversold on four other occasions in the past decade. Each time, however, we have seen a significant bounce (>10%) for both SPX and CCMP.
S&P 500 (SPX)
Last month, we had flagged the bearish risk to US equities, with the 55-200w MA setup in play. This suggests a formation indicated target of 4674 (200w MA) in SPX. The building blocks are further strengthened by successful completions of this formation in 2018, 2020 and 2022.
As a result, we only expect major support at the 200w MA, which has been a strong support level – it has held on a weekly basis in the last decade with the exception of the 2020 Covid shock.
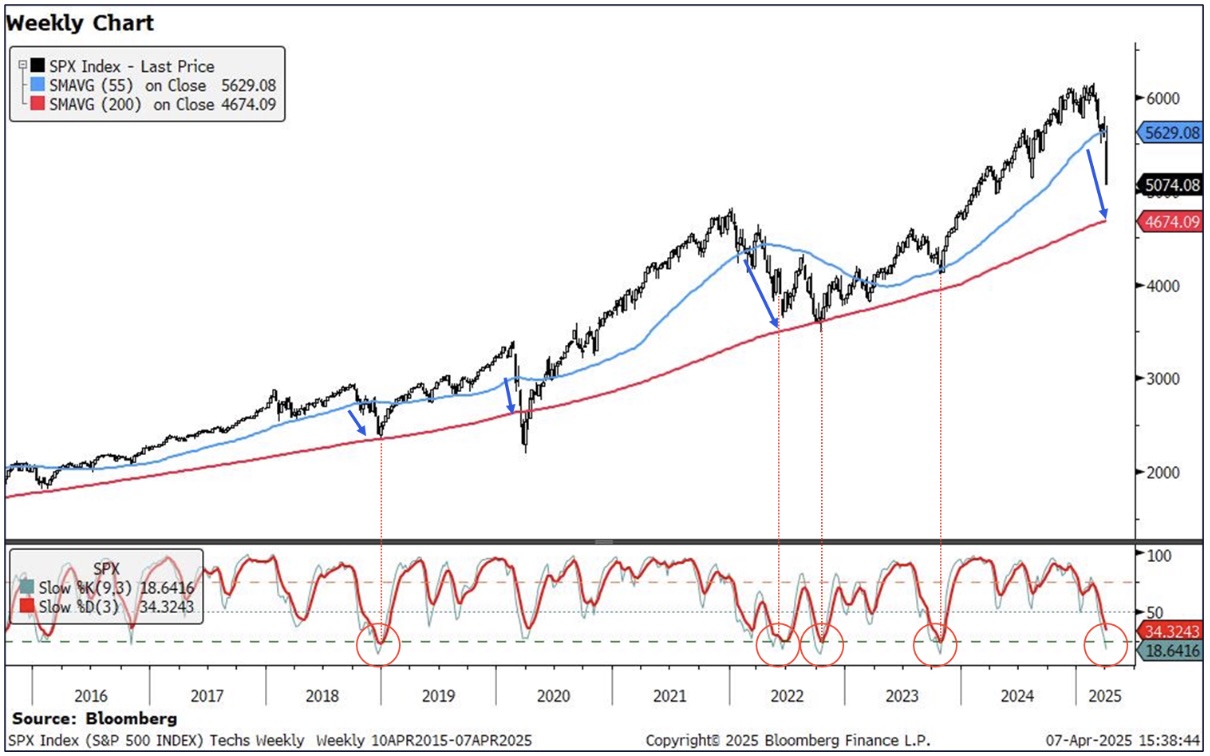
This is broadly consistent with Citi Equity Strategy’s view that a 4700 fair value level for SPX should reflect most of the current tariff.
That said, we are now very closely watching weekly slow stochastics, which is now in deeply oversold territory. We have entered such levels only on four other occasions in the past decade. In each occasion we saw a cross higher, however, we have seen a significant rally of over 10%.
IF seen, this would go hand in hand with the view that bearish equity sentiment may be nearing its peak, something that our Citi Quantitative research team has also pointed out, and very plausible if tariff turbulence eases slightly from here. If this is the case, a short term rally in equities could very much be on the cards.
Nasdaq Composite (CCMP)
A very similar picture in Nasdaq composite. Here, the 55-200w MA setup points to the formation indicated target of 14602 (200w MA).
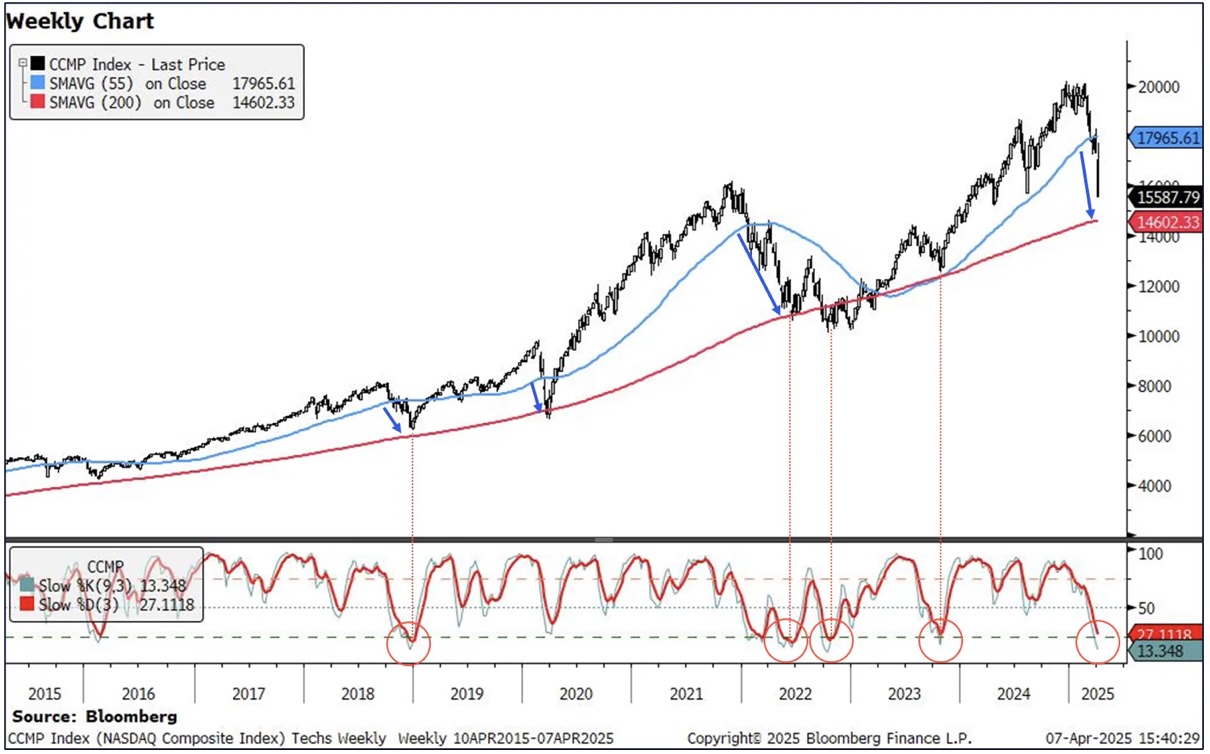
However, the 200w MA support is not as strong as with SPX. – we had seen a prolonged period in late 2022 and early 2023 where we had chopped around it. Nevertheless, this does not cloud the 55-200w MA setup and we keep to our view that we could hit the 200w MA.
For a look into potential reversals, we watch the weekly slow stochastics here as well. We have also seen four other occasions in the past decade that we have been in such deeply oversold territory. A cross higher here would be an indicator of a reversal, with even the smallest bounce we have seen after posting such a technical indicator being over 10%.
JUST RELEASED! Man Who Predicted Stock Market Crash
To listen to the man who predicted the stock market crash discuss what to expect next CLICK HERE OR ON THE IMAGE BELOW.

JUST RELEASED!
To listen to Alasdair Macleod discuss the terrifying second stage of this crash CLICK HERE OR ON THE IMAGE BELOW.

© 2025 by King World News®. All Rights Reserved. This material may not be published, broadcast, rewritten, or redistributed. However, linking directly to the articles is permitted and encouraged.


