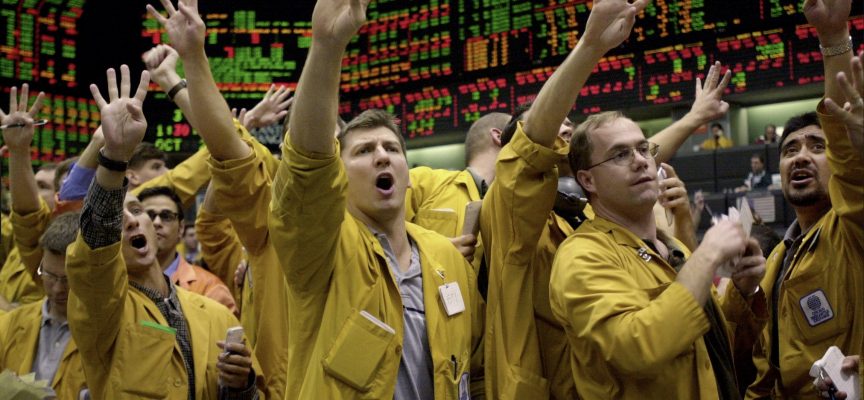
On the heels of the panic selloff in the gold market, today one of the greats in the business was kind enough to allow his special gold report (that is only sent to his institutional and high net worth clients) to be shared exclusively with King World News readers around the world. This is not something that is normally allowed and we thank him for his generosity.
July 17 (King World News) – Special report on today’s action in the gold market from Michael Oliver at MSA (www.olivermsa.com): The final paragraph from our July 11th report:
“If price touches $1240, no doubt the price chart sellers will attempt to drop further and take out the price low that occurred in December 2017 to see what’s on the other side. It’s likely there will be some mini-downside rush of action, probably climax type. But we still consider this trend old for weekly and monthly momentum, and counter-trend to very long-term momentum trend factors.”
By $1240 we meant a second return to it in this decline, after the upticks to over $1260. That return to $1240 was reached on July 13th, back to the low $20 tick, and perhaps now we’re seeing some of the panic selling as a prior obvious price chart low has come out. Our bias is that this is late and exhaustive selling.

There’s a green-lined structure overhead on weekly momentum that we’ve defined over the past few weeks. And now it’s below the zero line/3-wk. avg. After this downside panic (not yet really a panic) has run its course, probably very soon, that will be one of several technical starting gates barely above the market. Next week that zero line/3-wk average is estimated to drop to $1244. The lower this week goes, the lower that number will be next week. Think gold will continue this aged decline and never close a week back over its 3-wk. avg.? (We prefer a weekly close over the zero line for good measure, not just the green-lined structure.)..
Gold is making its way back into the global monetary
system, to learn more CLICK HERE!
 Sponsored
Some archival annual trend context
We start with the period from 2000 to 2008.
The initial base breakout occurred in September 2001 (circled), after being submerged below the zero line for over a year and a half. The first response after breakout was to drop back down to and marginally below the zero line, followed by a strong surge into 2003.

Then in 2004 came more or less range-bound action on price and two-way action (above the defined floor) on annual momentum. You could have bought and sold gold in the low to mid-$400s for two entire years, with the sort of swings (10 to 15%) that no doubt impressed bulls and bears alternately.
Then a second major up-wave materialized in 2006, followed by a 22% price drop into the late 2006 lows, which held and defined a new floor. The third and final wave came in 2007 and 2008. Collapse followed that third annual momentum up leg. That downturn was a full return to the mean. Gold had not seen the zero line in a half dozen years, and then it saw it fast in the late 2008 collapse.
2008 to 2018
The 2008 return to the mean was sufficient. It hit and then turned from the zero line. Bob Farrell (Merrill Lynch’s chief technician back in the ‘70s and ‘80s) no doubt would have smiled. The first of his famous Ten Rules of Investing was: “Markets tend to return to the mean.”
MSA adds its own rule:
Markets often oscillate the mean. And so, after the clear topping action of 2011 (which double-topped at the peak oscillator reading of 2008, though at a much higher price high than 2008), the next drop in 2013 oscillated well below the mean.

And there momentum based in a disciplined manner, while price continued to drop, “forever” in the minds of many traders.
Then came the breakout in February 2016 over the green line (a 2.5-year-wide base), and since then we’ve witnessed much the same behavior by gold that we saw from 2003 to 2005. Ups and downs, with the sort of action that sparks animated debates on both sides. Yet still within the context of an annual momentum uptrend. Waiting overhead is a secondary green line that will mark the beginning of the wave two up-leg. For now, focus on shorter-term factors to define when this selloff is over.
Michael Oliver also told King World News: “I like what’s going on, it’s like a bomb going off. It clears out the weak hands so that we can finally head higher.”
King World News note: Michael Oliver is right, this is how bottoms are formed — with a crescendo of selling and panic that takes place. For what it’s worth, the big, smart money was buying the mining shares on today’s capitulation. That is why the mining shares held up so well and HUI is about to close slightly green on the day.
***KWN has now released the powerful audio interview with James Turk and you can listen to it immediately by CLICKING HERE OR ON THE IMAGE BELOW.
ALSO JUST RELEASED: With Netflix Gapping Down More Than 50 Points In Early Trading, One Market Veteran Just Warned “They Eventually Pull The Exit Trigger And The Market Collapses” CLICK HERE TO READ.
© 2018 by King World News®. All Rights Reserved. This material may not be published, broadcast, rewritten, or redistributed. However, linking directly to the articles is permitted and encouraged.


