

On the heels of the price of gold continuing its recent surge, today one of the greats in the business discussed gold and the global debt bubble.
Gold and the Debt Bubble
October 17 (King World News) – John Hathaway, Sprott Asset Management: Special Note: The following analysis was written before the lamentable developments in the Middle East. Obviously, the open-ended potential of the violence between Israel and Hamas reinforces the geopolitical rationale for gold exposure, but a compelling investment case would exist independent of those developments.
Turning Point at Hand
Despite the battering of gold and precious metals stocks during the last two weeks of September, gold managed an increase of 1.35% through the first nine months of 2023. Related mining stocks suffered a year-to-date 6.13% decline using GDX (VanEck Gold Miners ETF)1 as a proxy.
We believe the severe correction in precious metals is near exhaustion and expect gold to trade at new highs over the next 12 months. We reason that the Federal Reserve’s (“Fed”) “higher for longer” stance is unsustainable as it will trigger a general credit deflation and a steep election-year recession.
On timing, veteran market analyst Mark Hulbert agrees:
“Gold and gold mining stocks are once again poised for a significant rally. Recommended gold exposure by market timers is in the bottom decile since 2000.” (Market Watch 10/2/23-A Contrarian Update of Market Sentiment)
As explained by Sprott Market Strategist Paul Wong:
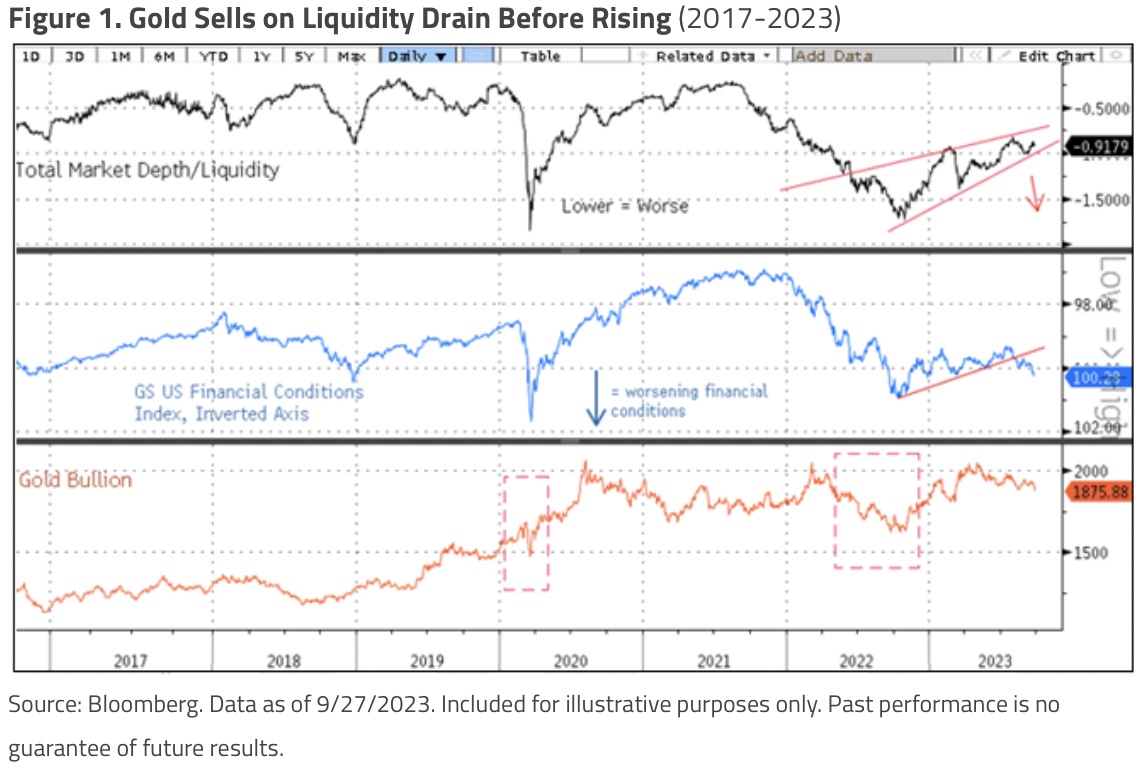
“Gold’s end-of-quarter weakness synched with that in equities and bonds. In a history repeats/rhymes manner of last year, the sharp rise in the U.S. dollar (USD)/yields is draining systematic liquidity, inflicting pain on virtually all asset classes except volatility.
“Below is a quick graphic to visualize the effect on gold bullion. Selling in gold because it is liquid (highly liquid), and we have clear examples (2008, 2020, 2022) where gold sells on the liquidity drain before rising again. The top panel is the total market depth/liquidity index, which appears ready to break down sharply (delayed data). The middle panel is the Goldman Sachs Financial Conditions Index (inverted axis),2 which is breaking on the rising USD, spiking higher in real yields, etc. The lower panel is gold bullion, highlighting prior periods when gold saw forced liquidation due to liquidity squeezes.”
More than $33 Trillions of U.S. Debt
The Fed-induced squeeze in liquidity is affecting all asset classes. To abort the consequences of a full-blown deflation (similar to the aftermath of the Global Financial Crisis [GFC]), Fed policy must revert to warp-speed money creation sooner rather than later to finance emergency election year fiscal spending measures…
ALERT:
Legendary investors are buying share of a company very few people know about. To find out which company CLICK HERE OR ON THE IMAGE BELOW.
 Sponsored
The precarious U.S. fiscal situation has received only token attention for many years, but is now mentioned prominently in the financial media.
“The Treasury itself is a source of risk…The scale and upward trajectory of U.S. borrowing and absence of any political corrective now threaten markets and the economy in ways that they haven’t for at least a generation.” (Rising Rates mean Deficits Matter-WSJ 10/5/23.)
And, from Kevin Warsh, former Fed Governor (WSJ 10/6/23):
“The U.S. is courting trouble. The federal government is 43% larger than it was four years ago, and its reach is expanding mightily. More than a third of the surge in investment spending can be traced to government subsidies, credits and handouts…
“The coming supply of Treasury securities required to fund U.S. government deficits will likely be substantially larger than official estimates. And purchasers of Treasury debt will demand higher yields, at least until something breaks in the economy.
“First, on the supply side. The government currently funds $33 trillion of outstanding debt at an average interest rate of about 2.9%. Funding costs on the growing debt burden are forecast to average only a fraction of a percentage point higher over the next 10 years, according to the Congressional Budget Office. I’ll take the over.
“The bond market is signaling heightened uncertainty about the range of possible outcomes. If the Fed’s recent rosy economic forecasts for growth and inflation are wrong and a recession ensues, there will be a gusher of new debt. Every additional 1-point increase in interest rates will add more than $2.5 trillion of expense in the next decade.
Next, on the demand side. After the global financial crisis, four of the largest purchasers of Treasury debt were price-insensitive. That is, they were buying Treasury debt for policy reasons — economic, geopolitical or regulatory. Price didn’t matter. How fortunate. These buyers, however, have largely exited the market. The Fed bought about a quarter of all Treasury debt in the past decade but warns that its Treasury holdings will shrink for at least another year.
“China, another massive buyer in recent years, is unlikely to sell its existing holdings at a loss. But don’t expect Chinese leadership to do the U.S. any favors by showing up in size at the next Treasury auction. Japan’s domestic growth profile is the most robust in decades. The lion’s share of its excess savings will stay closer to home. And after the banking debacle in March catalyzed by Silicon Valley Bank, the largest banks — firmly overseen by their regulators — are no longer keen to load up on ‘risk-free’ long-dated Treasury bonds.”
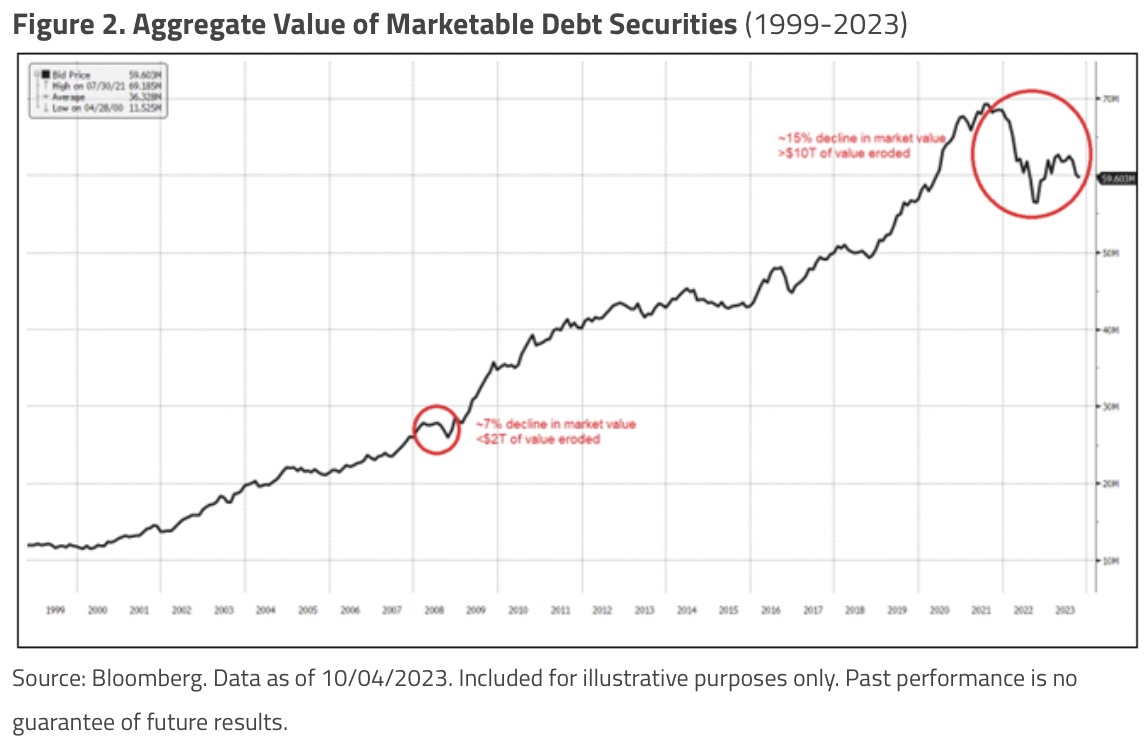
The chart below (Aggregate Value of Marketable Debt Securities) shows that the value destruction in debt markets is already five times greater than in the Global Financial Crisis. We believe that the extent and significance of the value destruction is poorly understood. The elements for a systemic crisis appear to be in place, perhaps sufficient to undermine the validity of U.S. sovereign credit.
Timing: Gold to Rise?
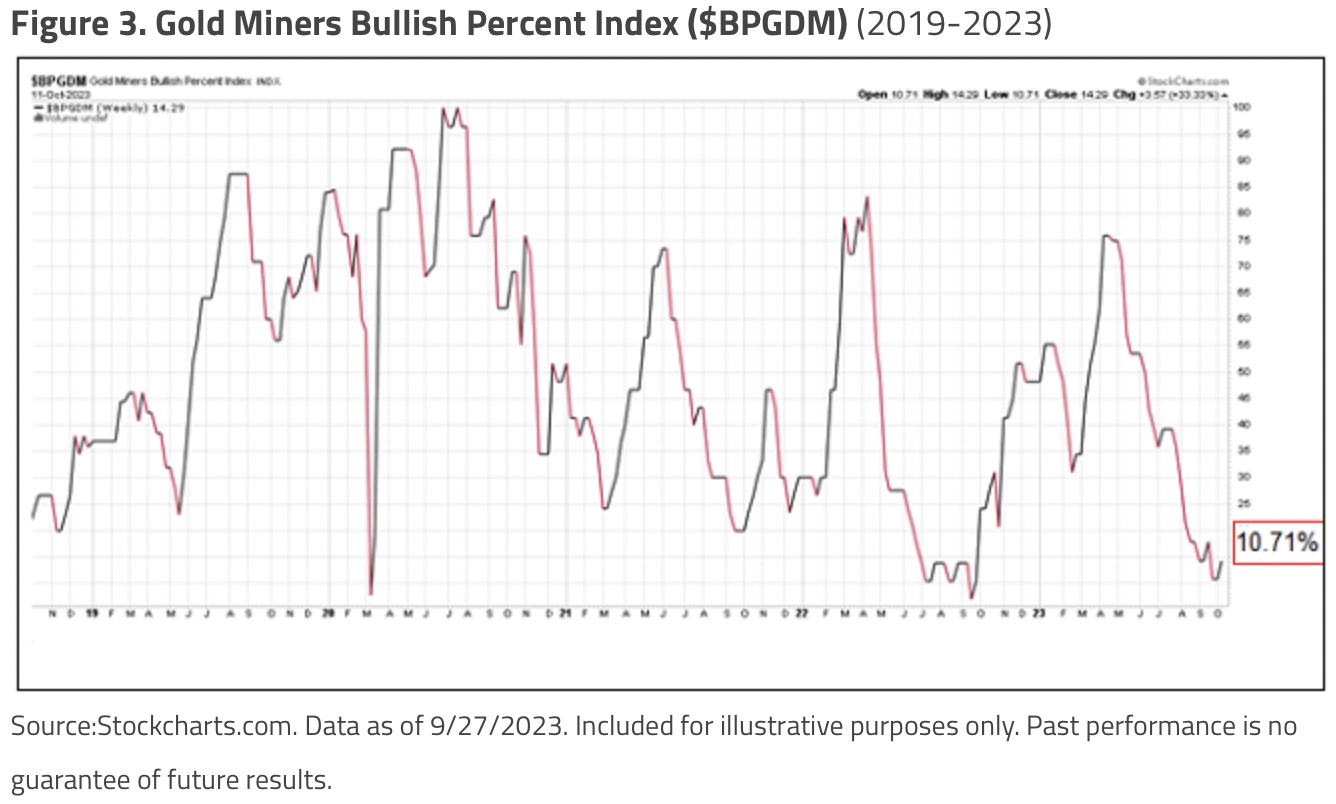
We expect a trend reversal for gold soon. Extremes in sentiment and oversold readings have usually preceded significant trend reversals within a short time. The Gold Miners Bullish Percent Index (BPGDM), currently at 10.71% (see Figure 3), is considered oversold at readings below 30.
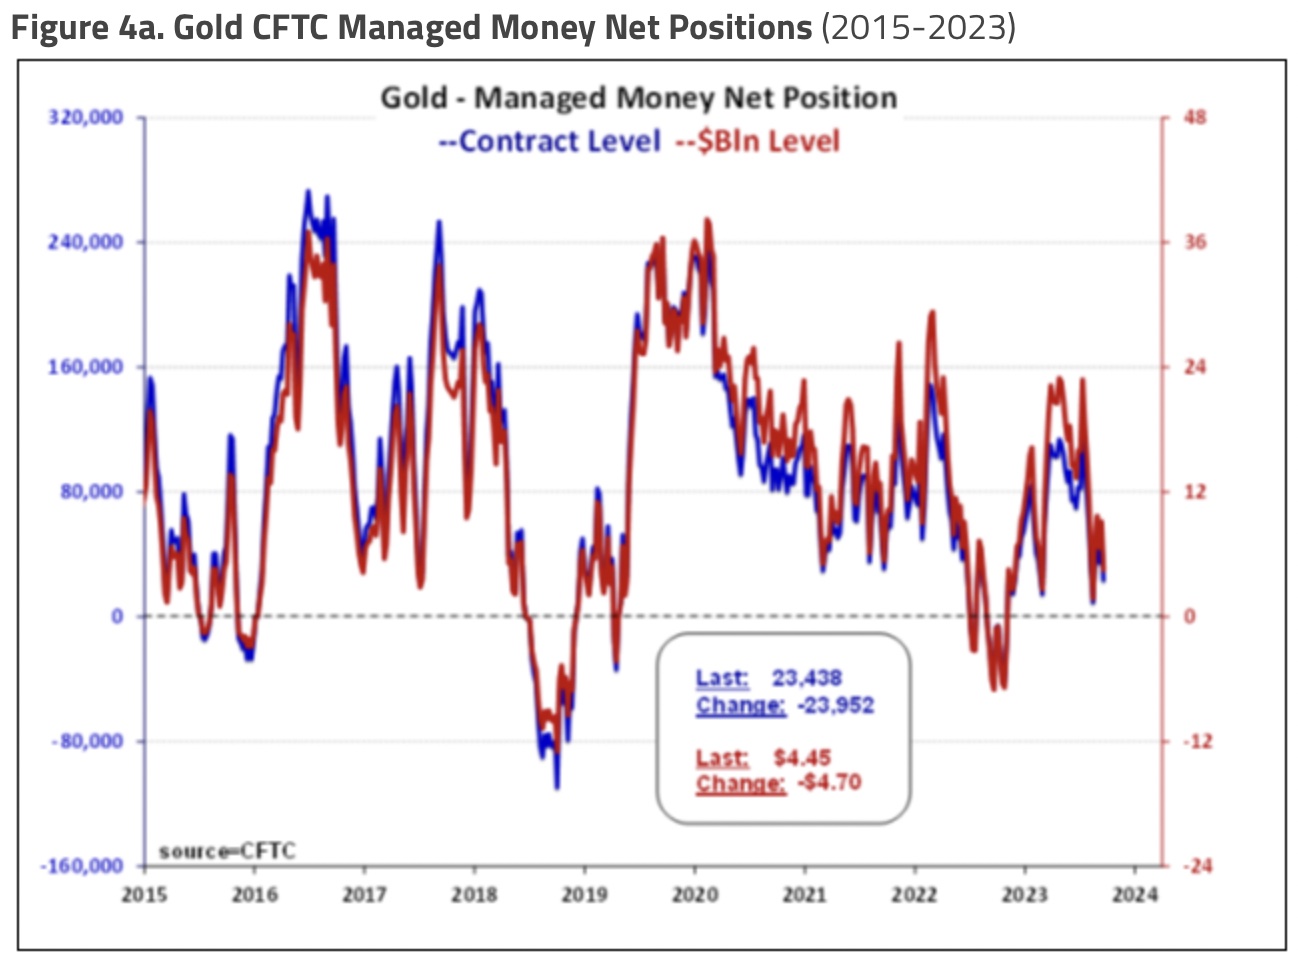
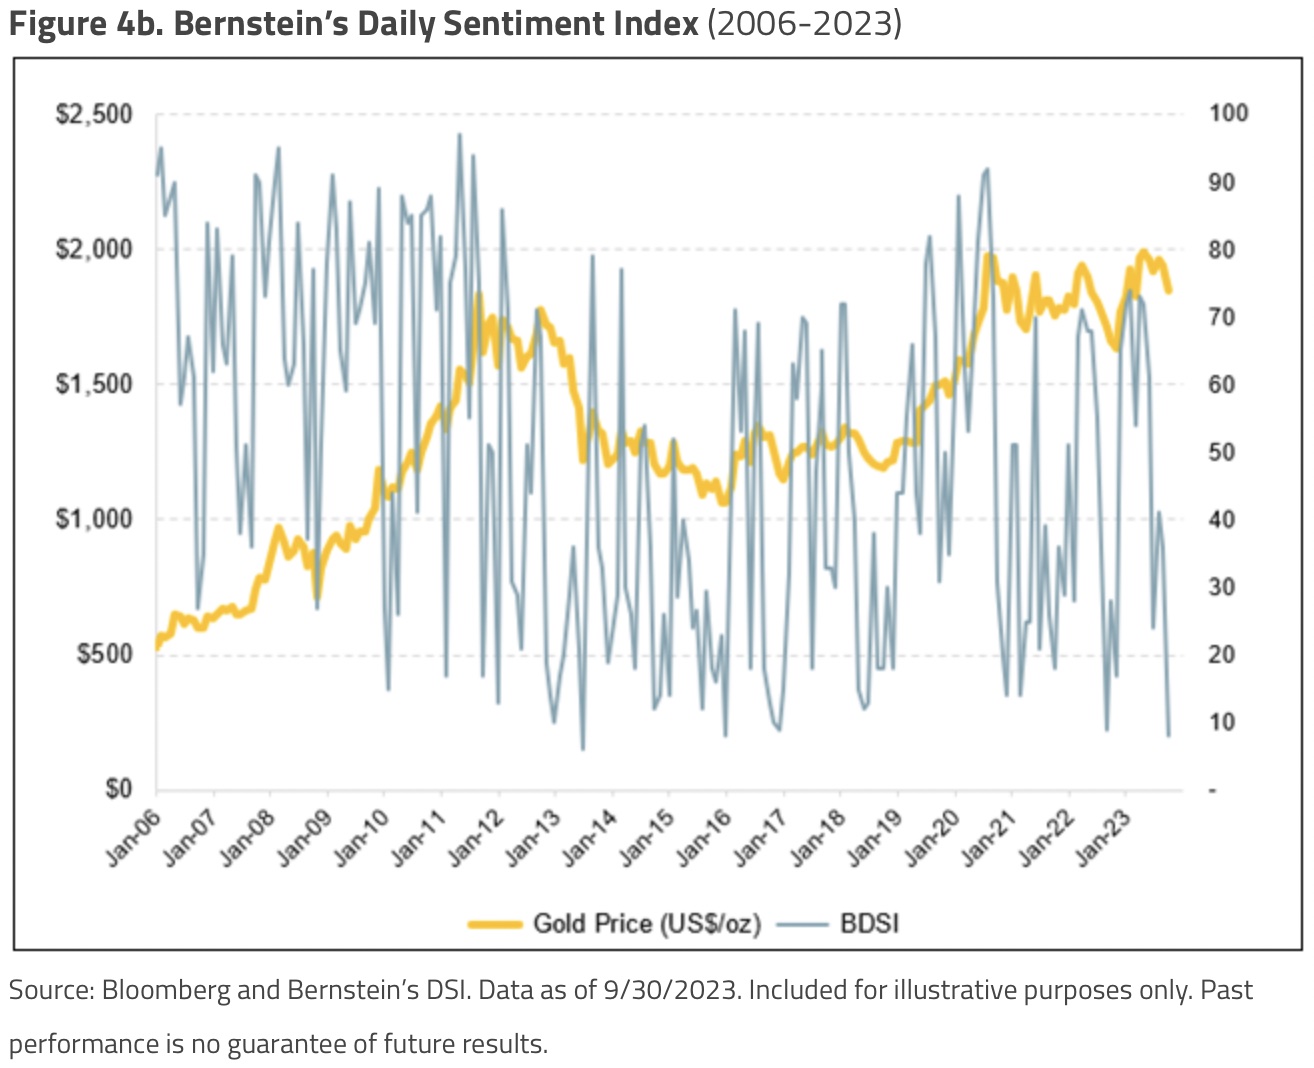
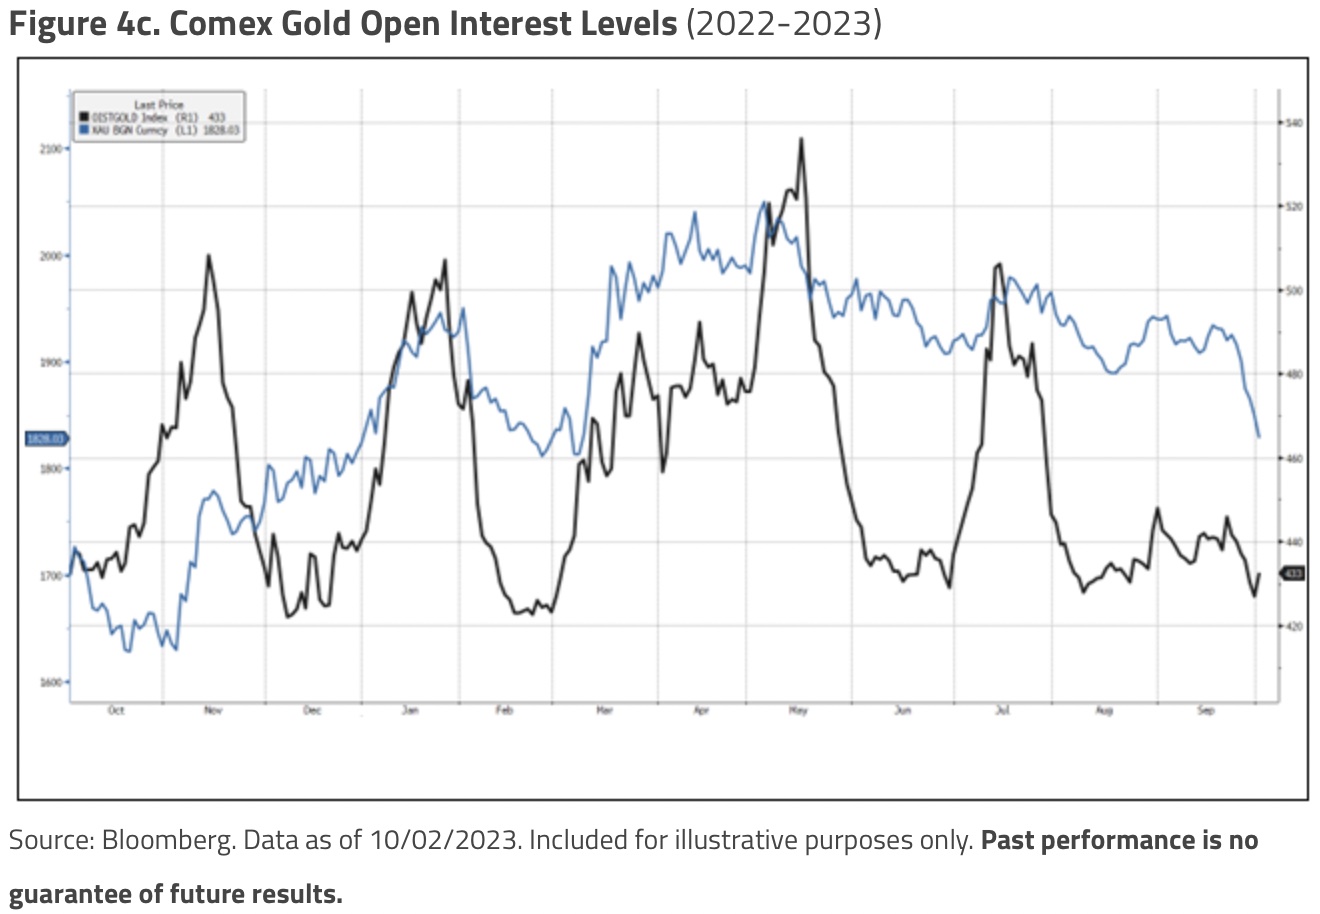
Gold CFTC (Commodity Futures Trading Commission) managed money positions approaching 0 is another reliable contrary opinion signal. It is a similar story for Bernstein’s Daily Sentiment Index and Comex Gold Open Interest levels (see Figures 4a/b/c).
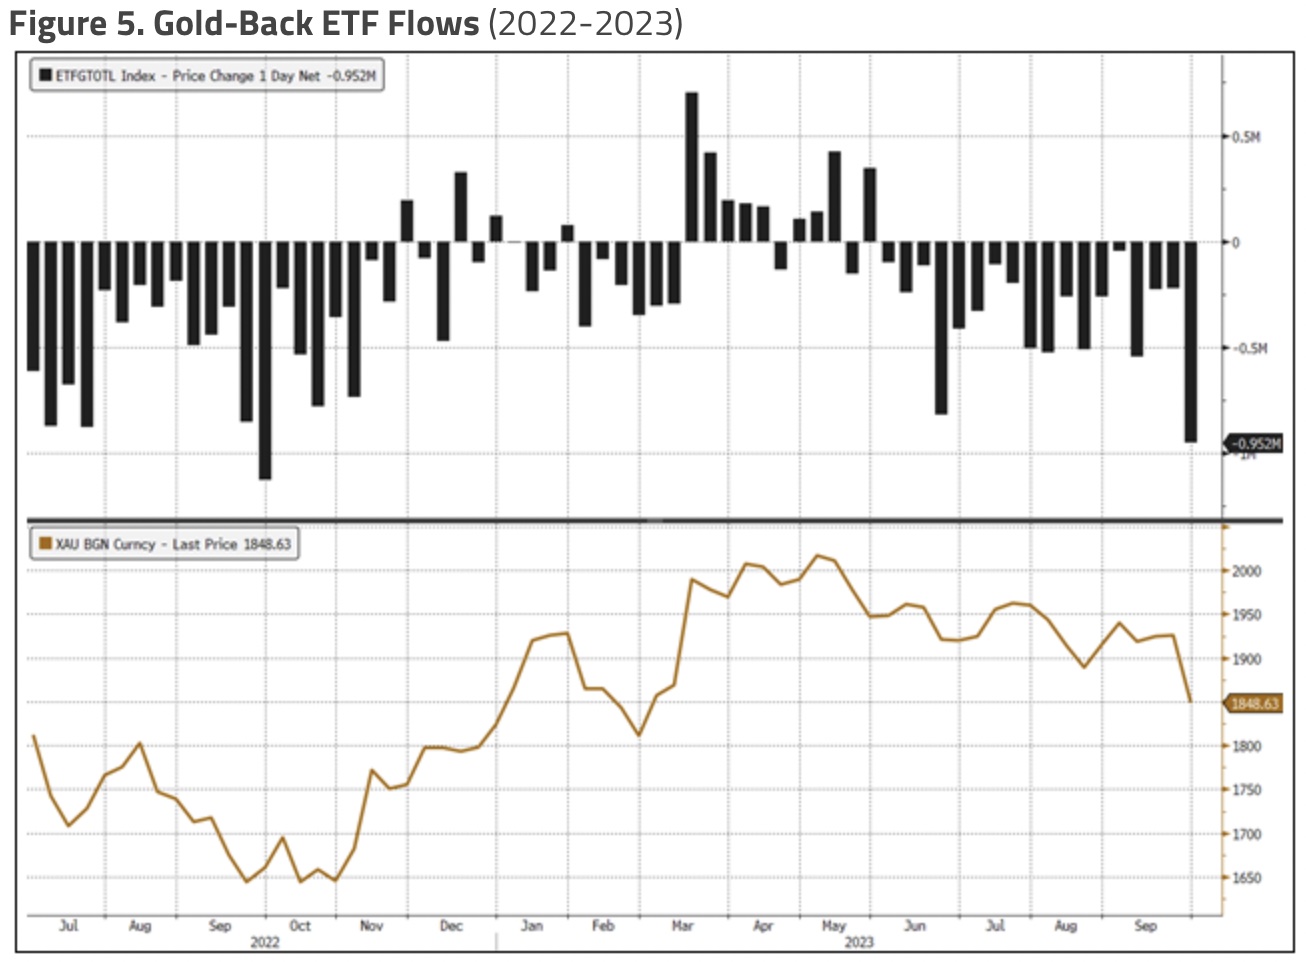
Gold’s strong performance relative to treasuries (TLT) is a disconnect from historical patterns. Strength compared to Treasuries has occurred despite the relentless liquidation of gold-backed ETFs; we have seen outflows in 53 of the last 66 weeks (see Figure 5).
No Soft Landing
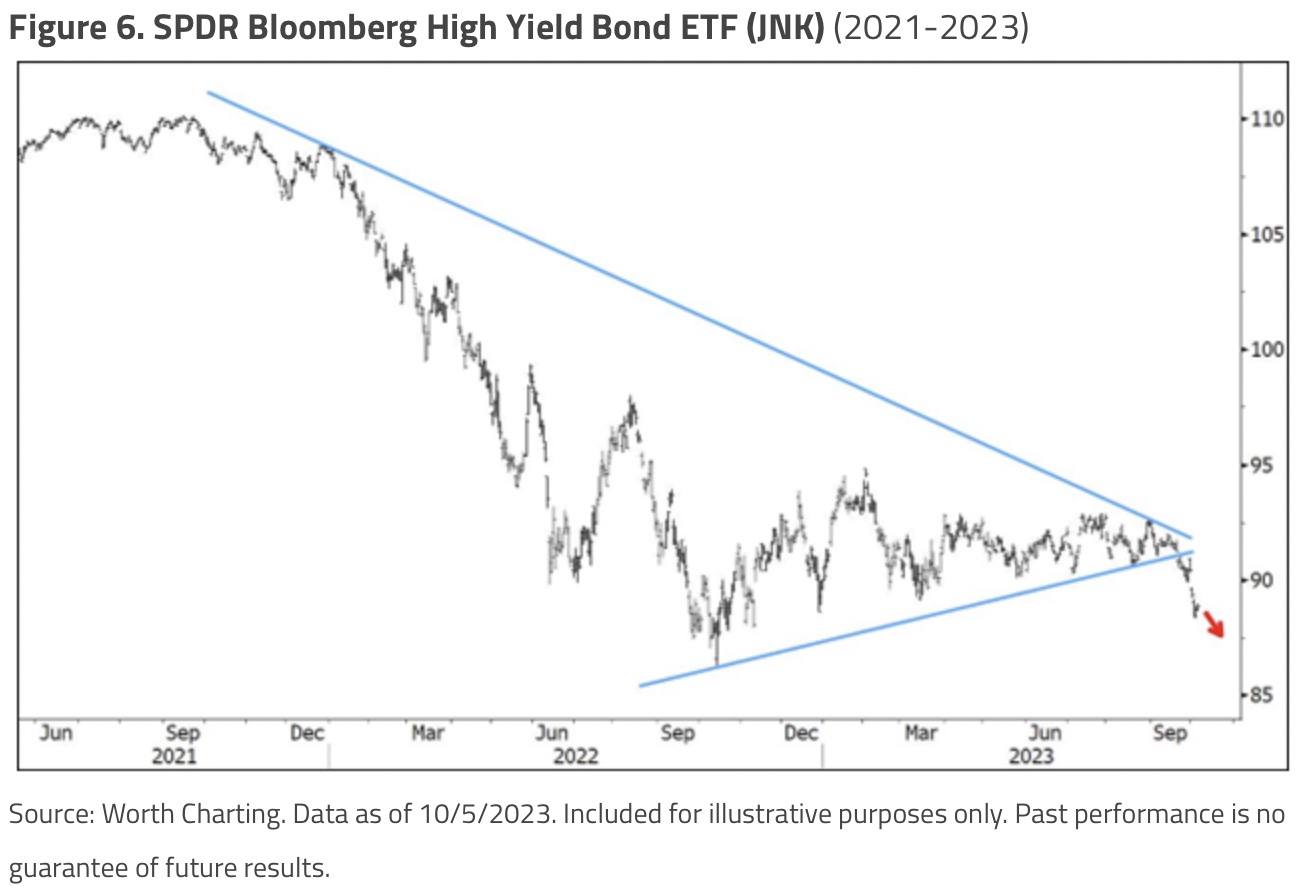
The repercussions of the Fed-engineered liquidity squeeze have yet to take full effect. U.S. bankruptcy courts experienced the busiest August on record (Bloomberg 9/5/2023). The fallout from “higher for longer” rates on low-grade credit is well underway, as depicted in Figure 7 for the SPDR Bloomberg High Yield Bond ETF (JNK).
Bankruptcies are on the Rise
Zombie corporations, according to Macro Mavens (9/12/2023), employ 2.2 million workers. The cost of refinancing debt issued during the past decade of ultra-low interest rates will be prohibitive for many marginal entities. The negative impact on employment will not be well received during a presidential election year.
“Business bankruptcies are rising briskly…The filers blamed elevated inflation, higher interest rates, waning government aid and lingering supply-chain disruptions. More corporate filings are likely on the way as high-interest rates push big companies over the edge.” (Source: Big Bankruptcies Boost Economic Fears-WSJ 10/9/2023)
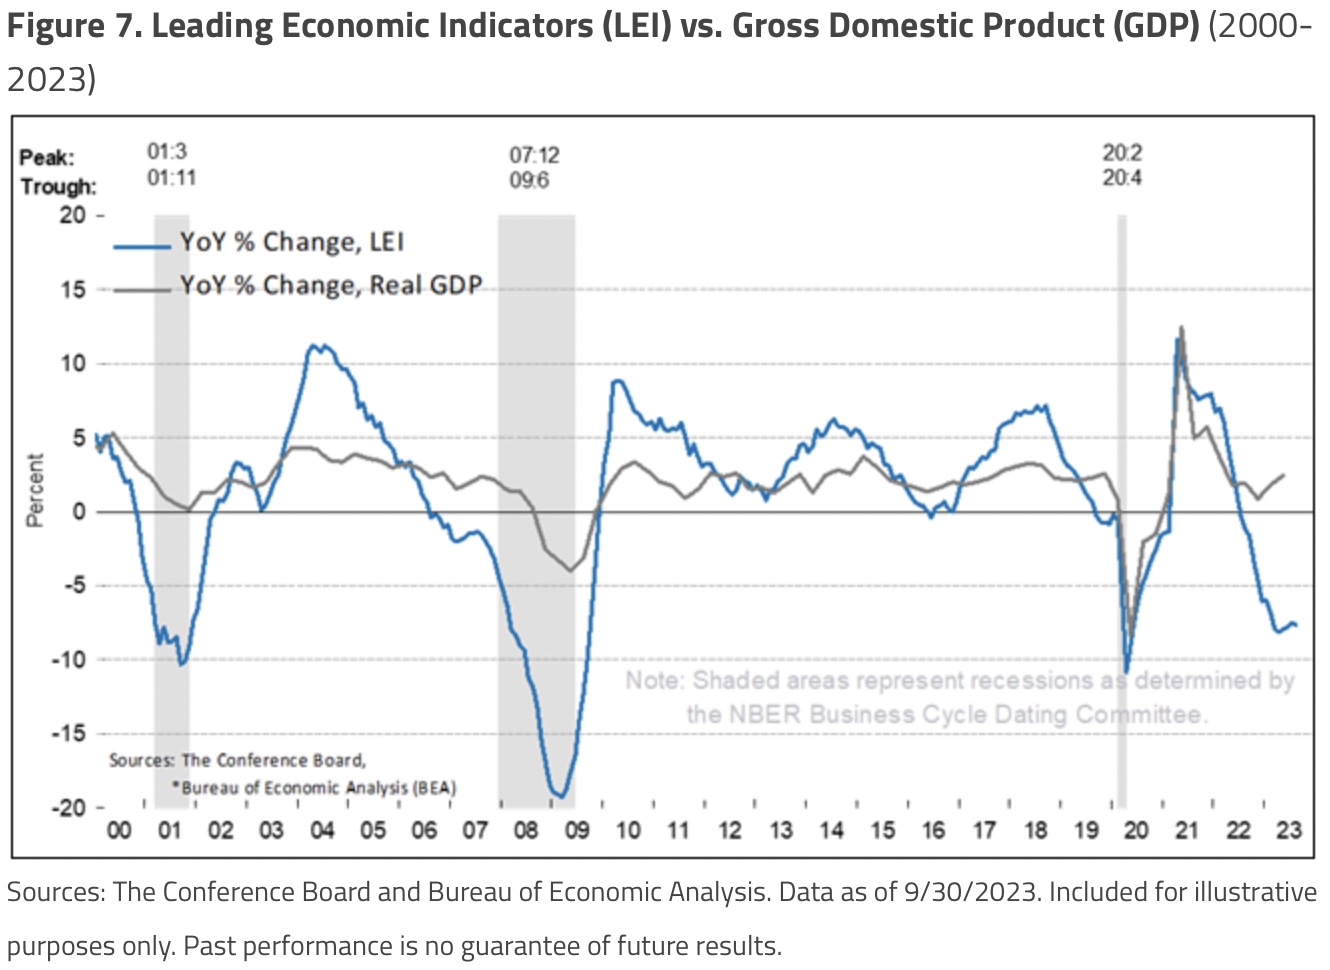
The deterioration of corporate and consumer credit is driven by Fed-engineered high interest rates. Weakening credit will ultimately deflate the debt bubble, an underappreciated and misunderstood residual of the past decade of suppressed interest rates. Credit deflation will prove to be the principal cause for the coming GDP (gross domestic product) hard landing.
The Conference Board’s Leading Economic Indicators (LEIs) are among the many signs that a recession lies ahead (see Figure 7).
Credit problems will pressure the banking system. According to FFTT, LLC, The Forest for the Trees (10/3/23):
“As the rising USD and rising UST yields drive disinflation, it will drive credit losses in the US banking system (CRE up first, followed by credit cards, autos, houses, etc.). Banks will then sell the USTs and MBS they were regulated into buying as ‘HQLA,’ etc., to cover credit losses.”
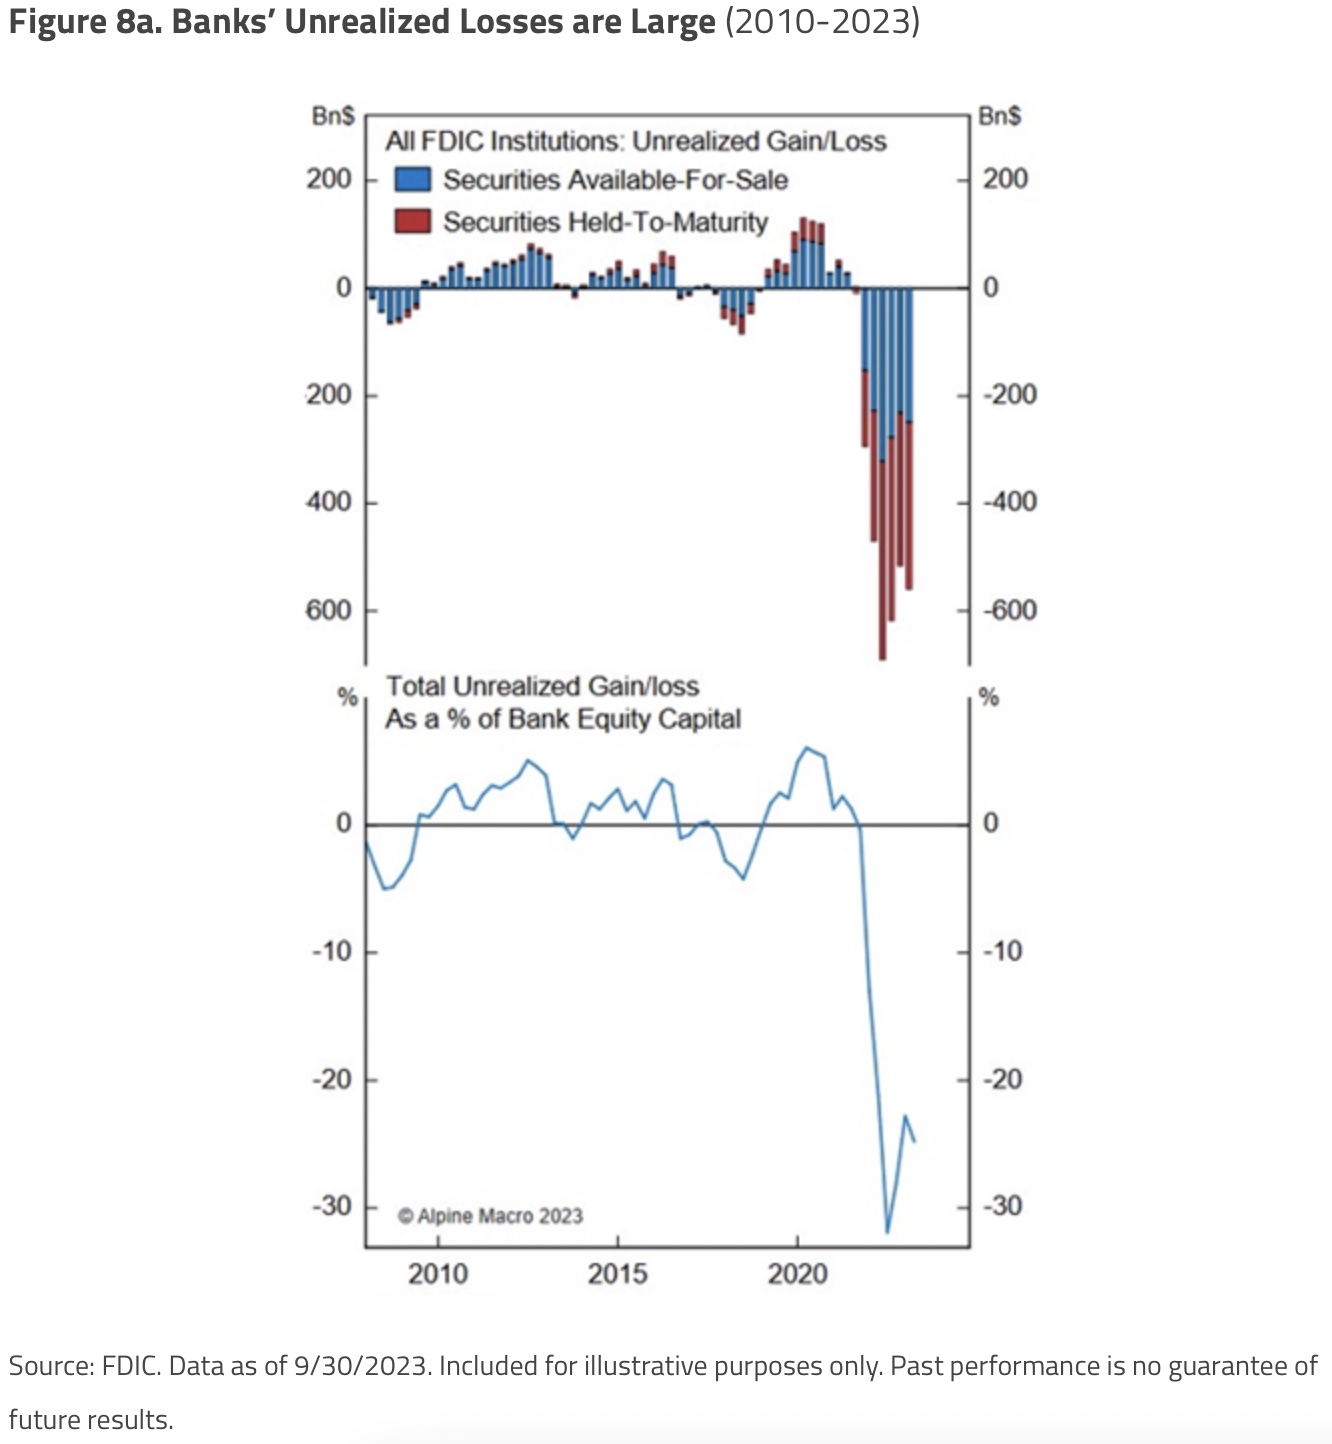
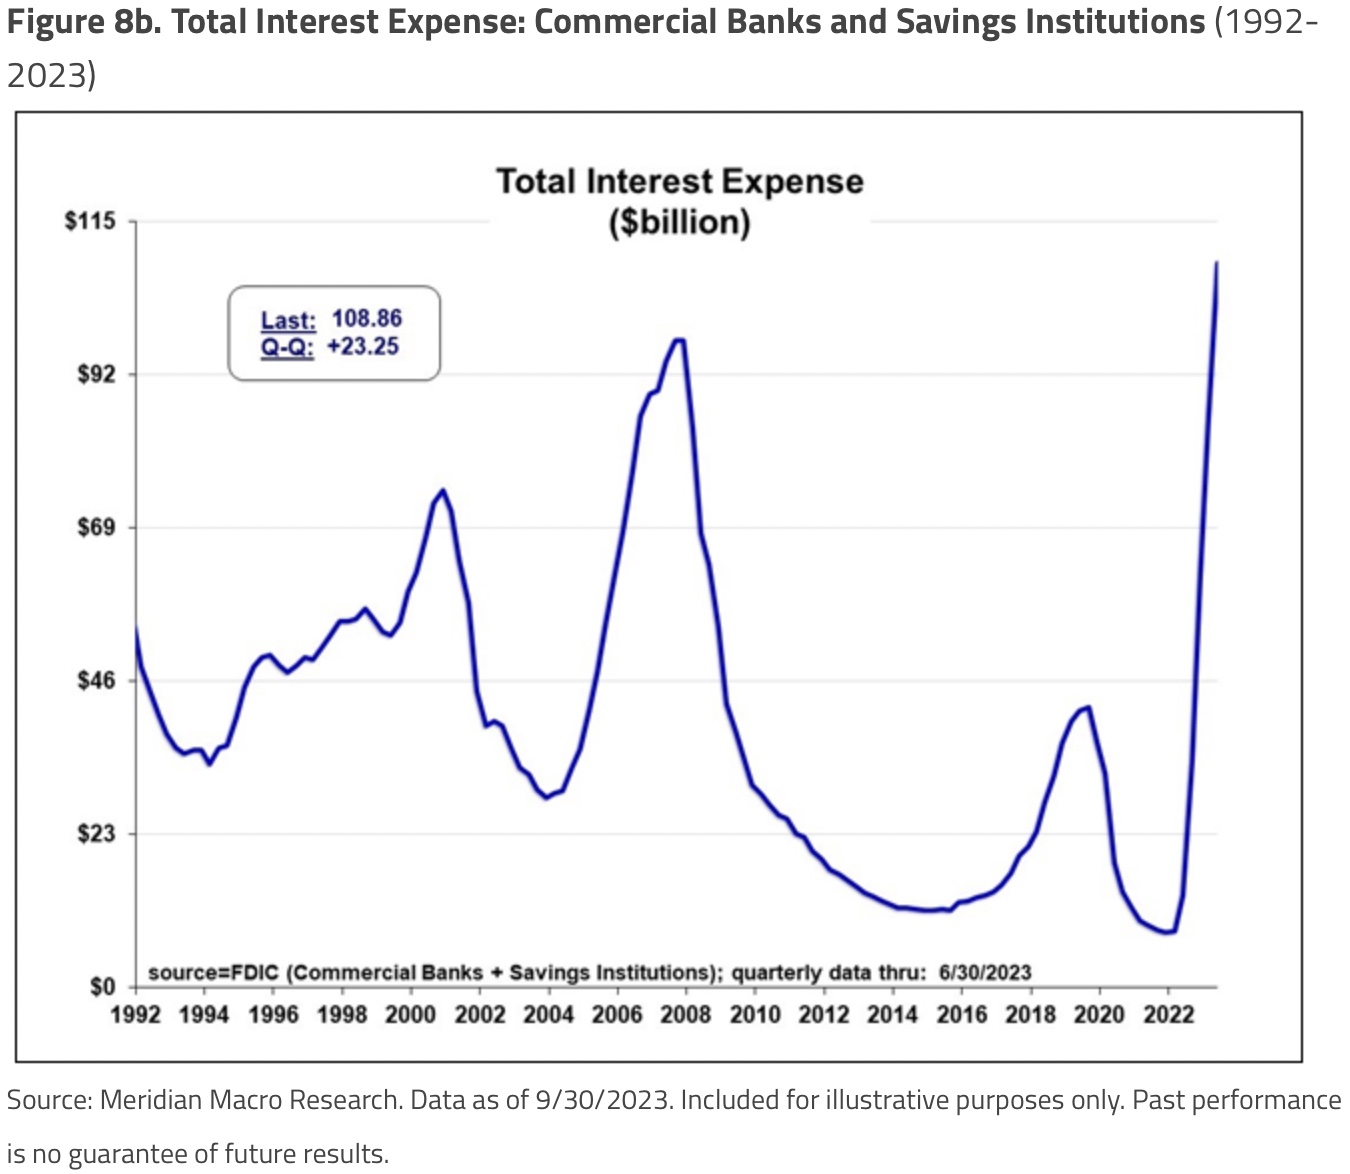
Banking system balance sheets on a mark-to-market basis are significantly weaker than during the GFC, while interest expense is higher than in 2008 and rising rapidly. Such data is apparently of no concern to policymakers: At the annual IMF conference in Marrakech, Treasury Secretary Yellen “rejected concerns that banks could suffer a repeat of the turmoil earlier this year that followed a sharp jump in borrowing costs.” Financial Times, Janet Yellen sees no market ‘dysfunction’ from US bond rout, 10/9/2023)
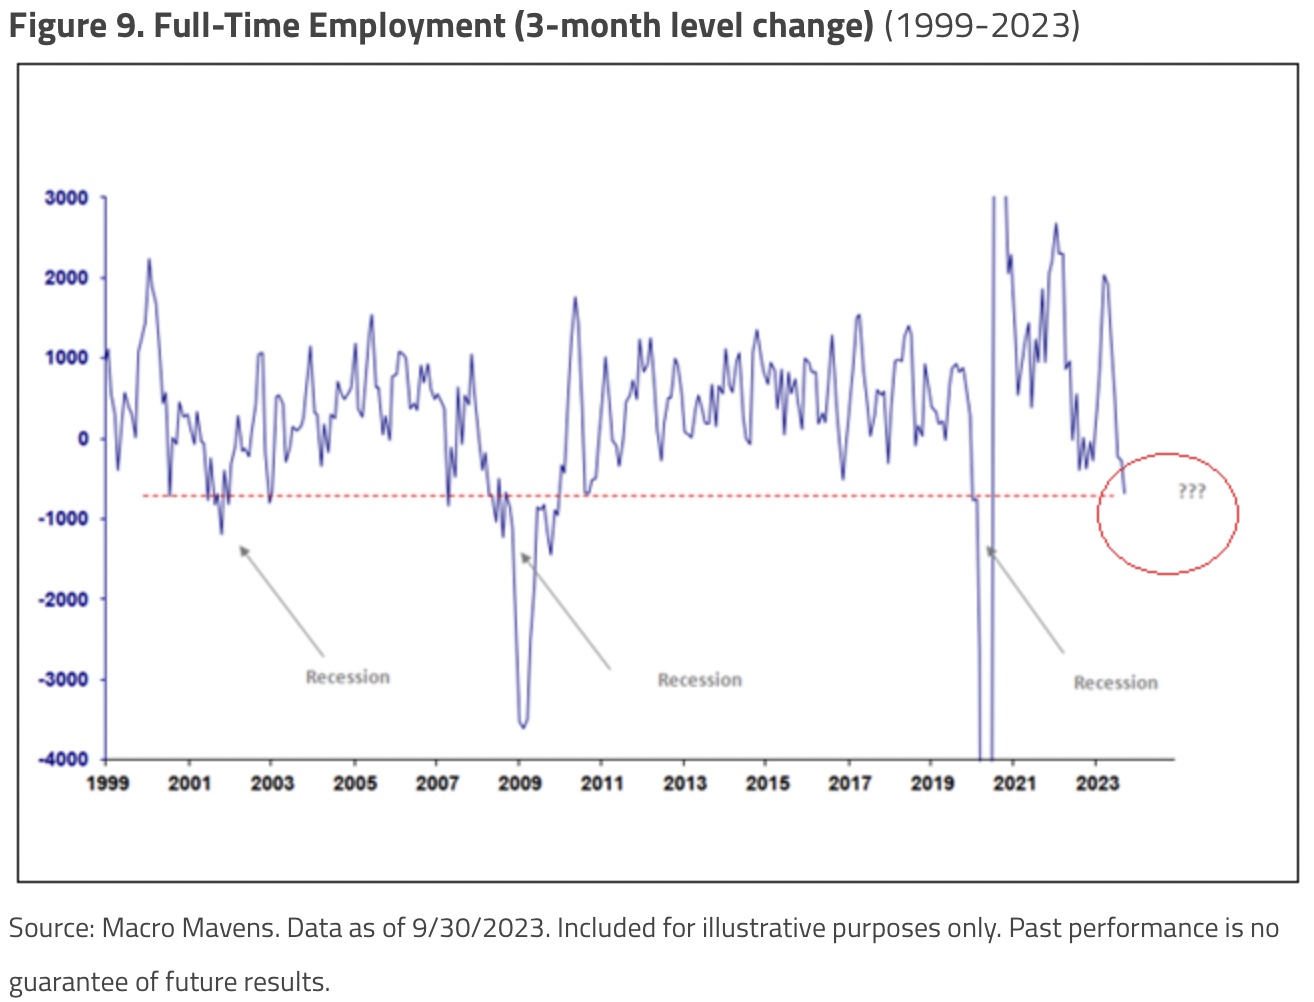
While a faltering banking system ranks very high among Fed policy buttons, a close second would be the labor market. There are several signs that the labor employment picture is weak, contrasting the heavily massaged BLS (Bureau of Labor Statistics) monthly nonfarm payroll reports. The household employment survey has been a better lead indicator of employment than nonfarm payrolls. Employment estimates from the nonfarm payroll survey are a count of jobs, while the household survey estimates the number of people employed. Clearly, the full-time employment data shown in Figure 10 does not convey a healthy labor market.
Trouble Ahead
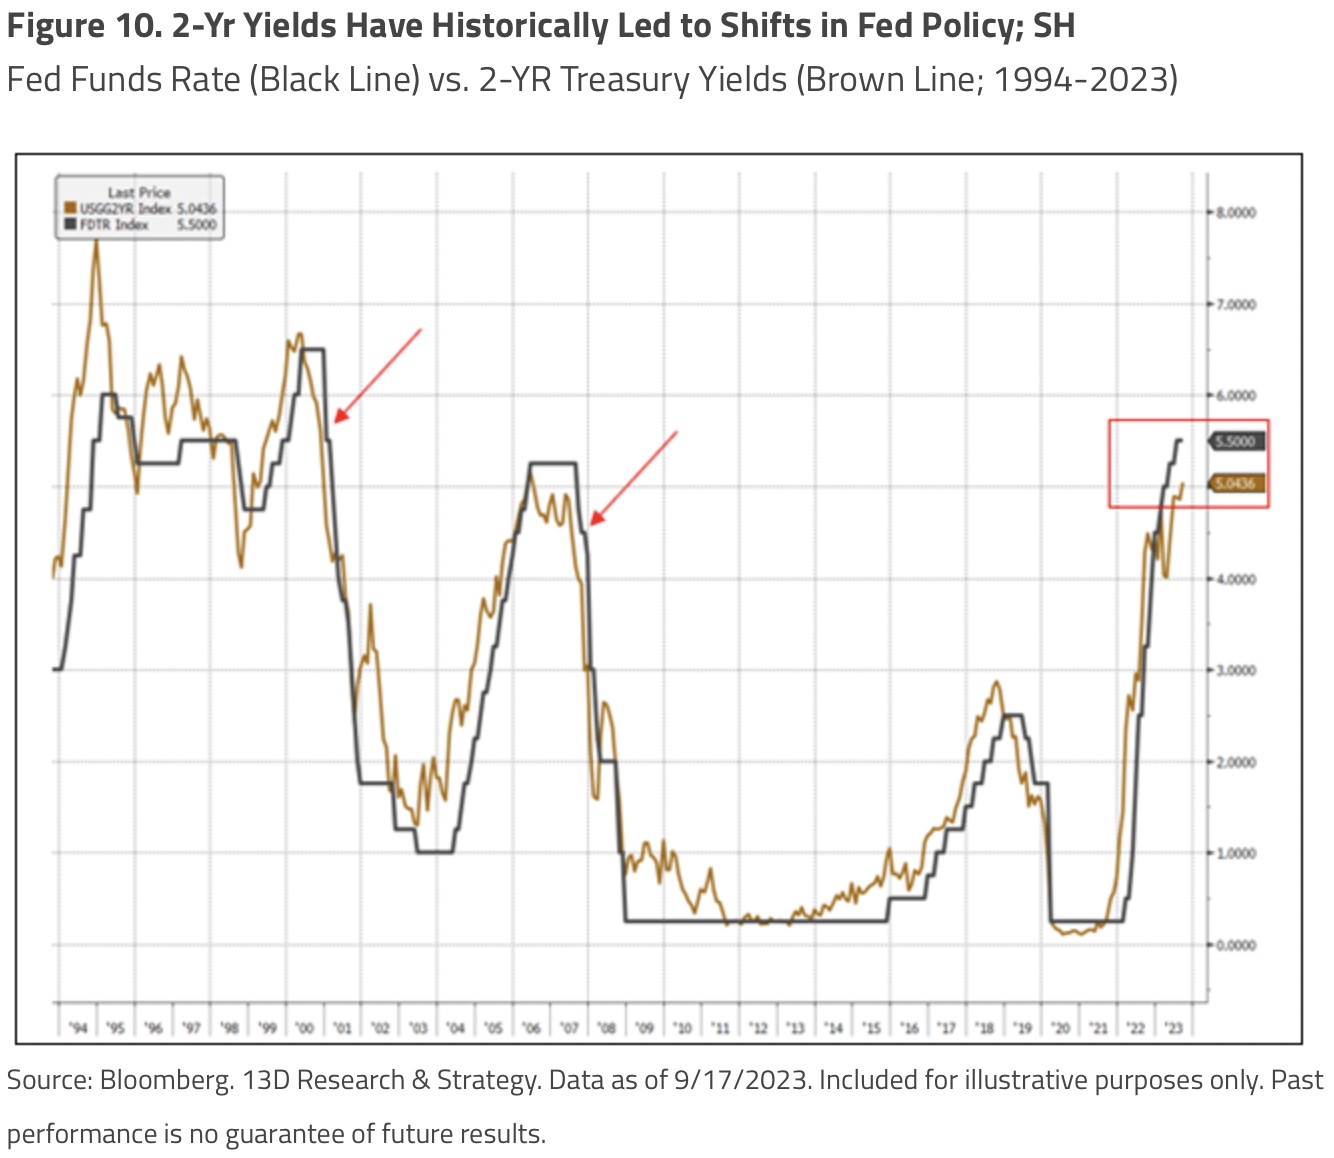
Official complacency aside, we believe that trouble in the banking system and the labor market will soon become impossible to ignore. As noted by 13D Research & Strategy on 9/17/2023, 2-year Treasury yields will signal a policy reversal before any official proclamation:
“We continue to closely monitor 2-year Treasury yields, as they have historically led the Fed’s policy agenda, and gold.
“Two-year yields have not made a clear higher-high since the March highs, while the Fed has further raised the Fed Funds rate. This has resulted in a higher Fed Funds than 2-year yields, suggesting a ‘restrictive’ Fed policy.
“The previous times when the Fed Funds rate was higher than 2-year yields before the Fed finally reduced the policy rate is noted by the red arrows in the chart below. These instances of a restrictive Fed policy, based on this measure, were followed by a sharp contraction in the U.S. economy and significant stock market losses.”
Mean Reversion Potential for Gold Mining Equities
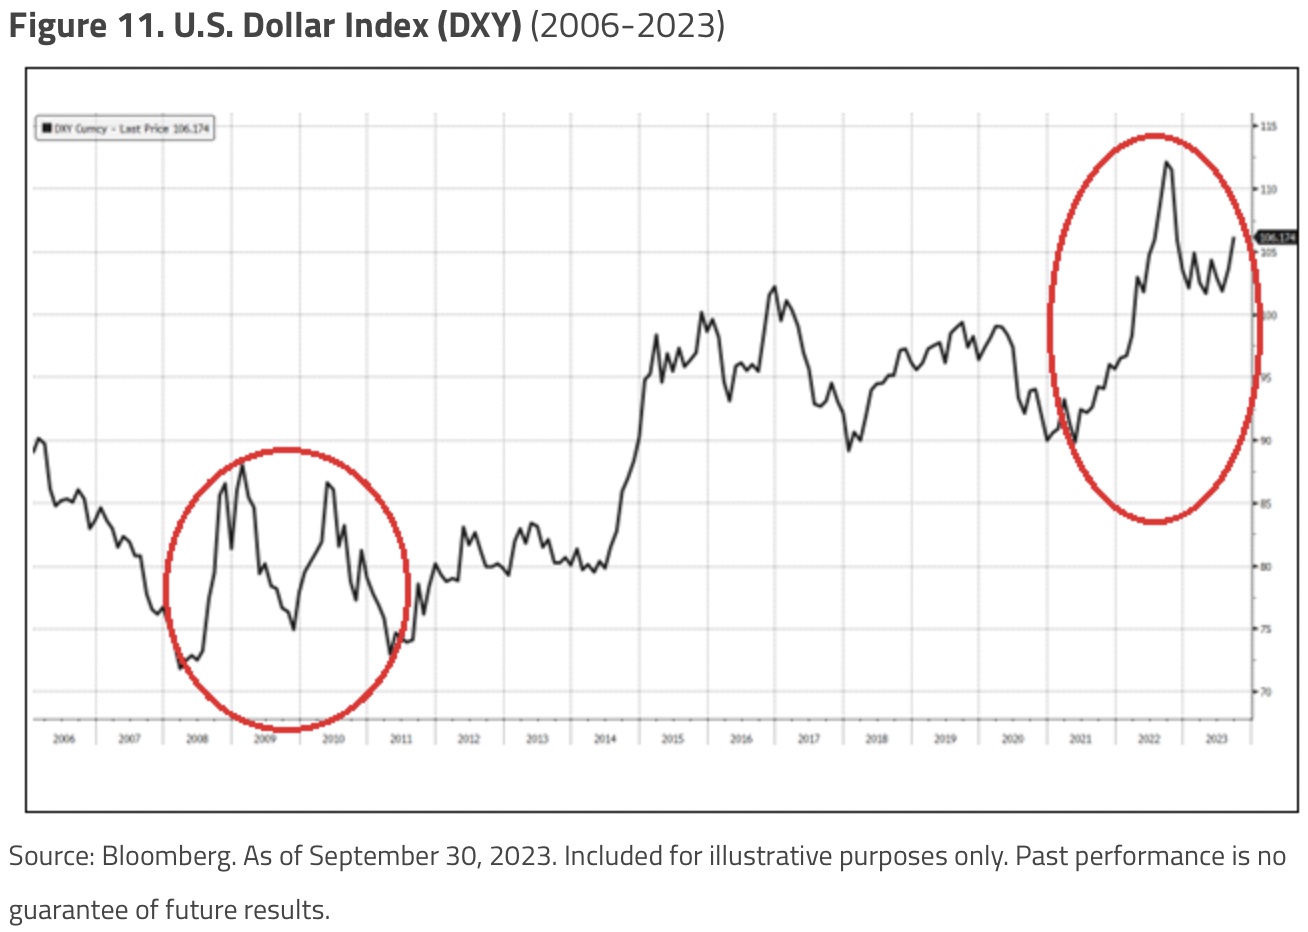
The consensus expectation of rates “higher for longer” is nonsense. A world in debt is effectively short U.S. dollars. Dollar “strength” is the effect of a politically unsustainable general credit squeeze. Dollar strength (see Figure 11) accompanied the unfolding of the GFC and we believe the analogy holds true under present circumstances.
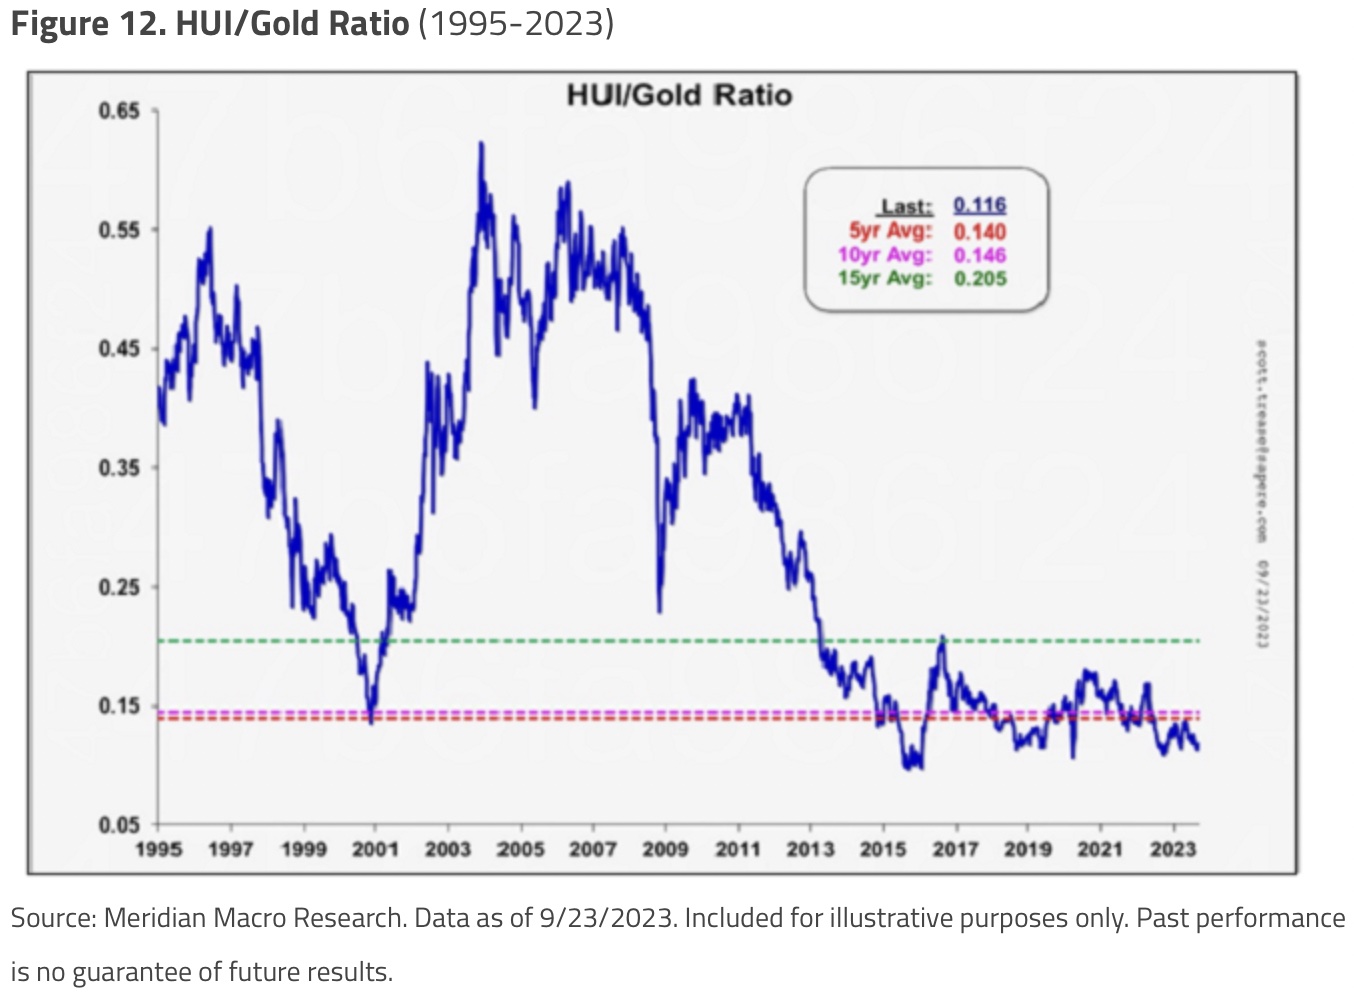
Gold miners represent a perpetual call on monetary disorder but are valued seemingly in total disregard of that optionality. Many producers are trading at free cash-flow yields of high single digits or more, sport strong balance sheets and are (incredible as it may seem) well-managed businesses. Relative to the gold price, precious metals mining stocks have underperformed, as shown by the ratio of gold mining stocks (HUI)3 to the gold price (see Figure 12).
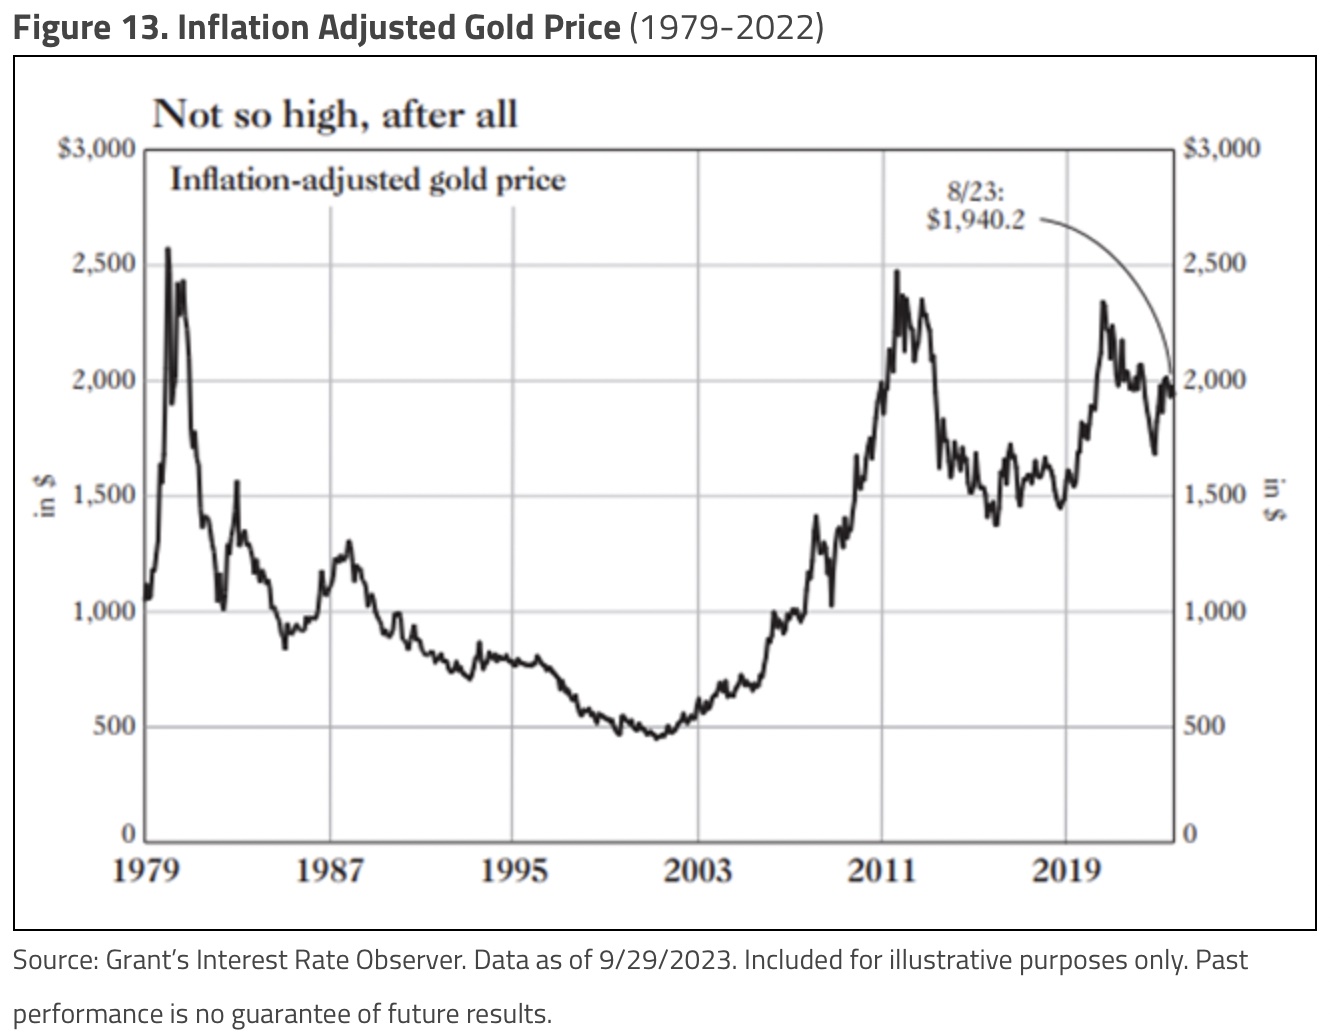
We noted the many reasons for this disconnect in our July 12, 2023, Q2 commentary (see “Gold vs. Gold Stocks: An Unresolved Incongruity”). Our view is that there is potential for a significant mean reversion trade in mining stocks. We believe that the trigger for mean reversion would be for gold to trade decisively above the psychological threshold of $2,000 per ounce, which until now has been a ceiling and a signal for algorithmic traders to short the metal. As can be seen from the chart of the inflation-adjusted gold price below, $2,000/oz is meaningful only for those who regard nominal U.S. dollar prices as reality. Macroeconomic fundamentals for the U.S. dollar have worsened significantly since the 2011 gold price peak. A steady state price for bullion in the mid to high $2,000s would not seem to be an extreme expectation in light of the deterioration of the U.S. fiscal position over the past two decades.
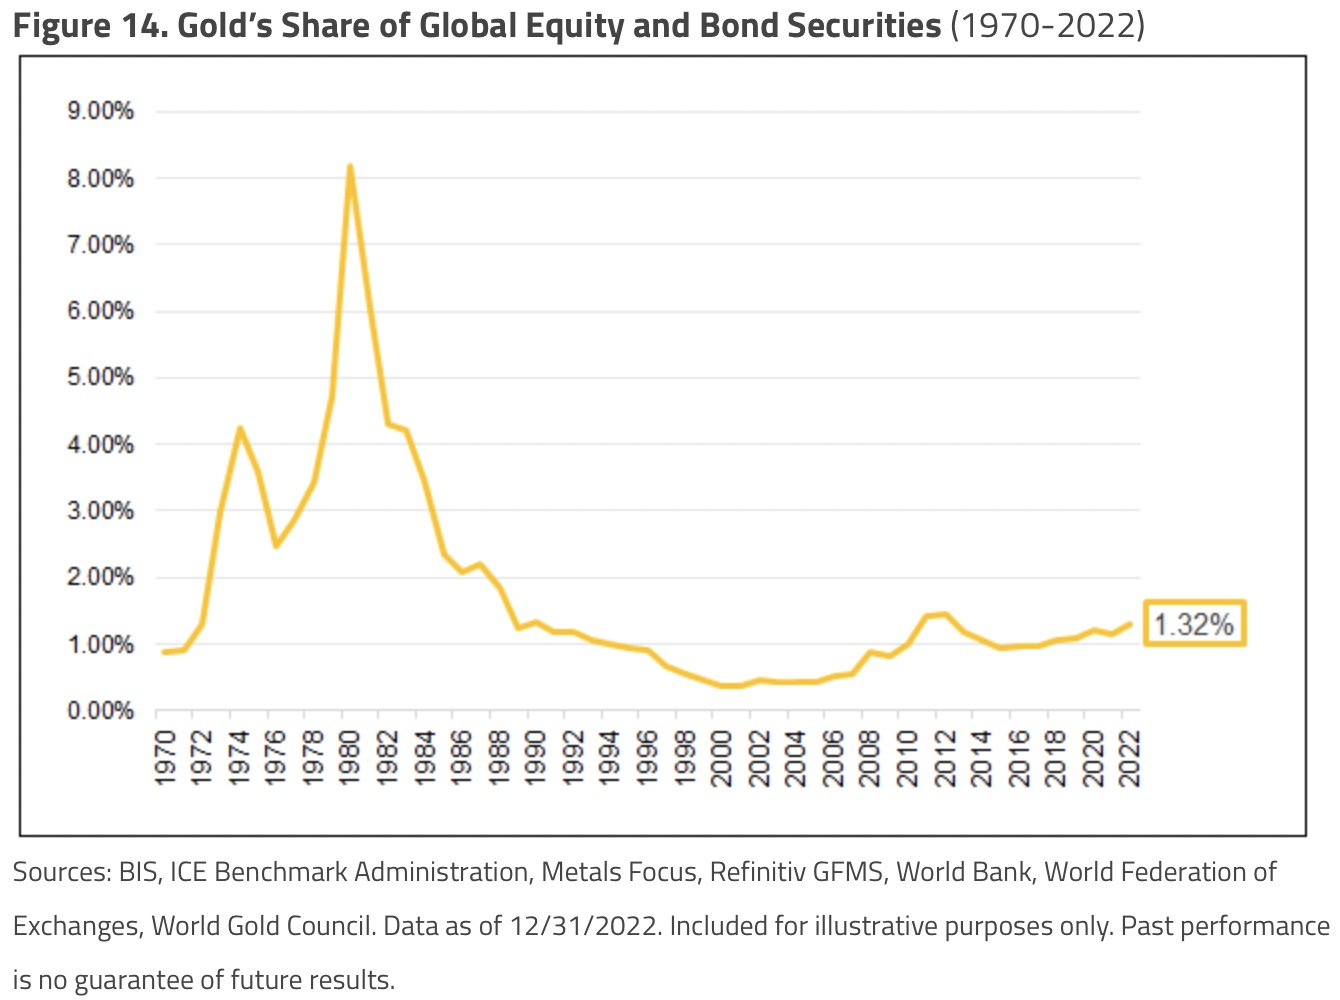
In the event of a systemic reset in the world monetary order, the potential for mean reversion in terms of allocation of investable assets to gold could be eight times the current level estimated (see Figure 14).
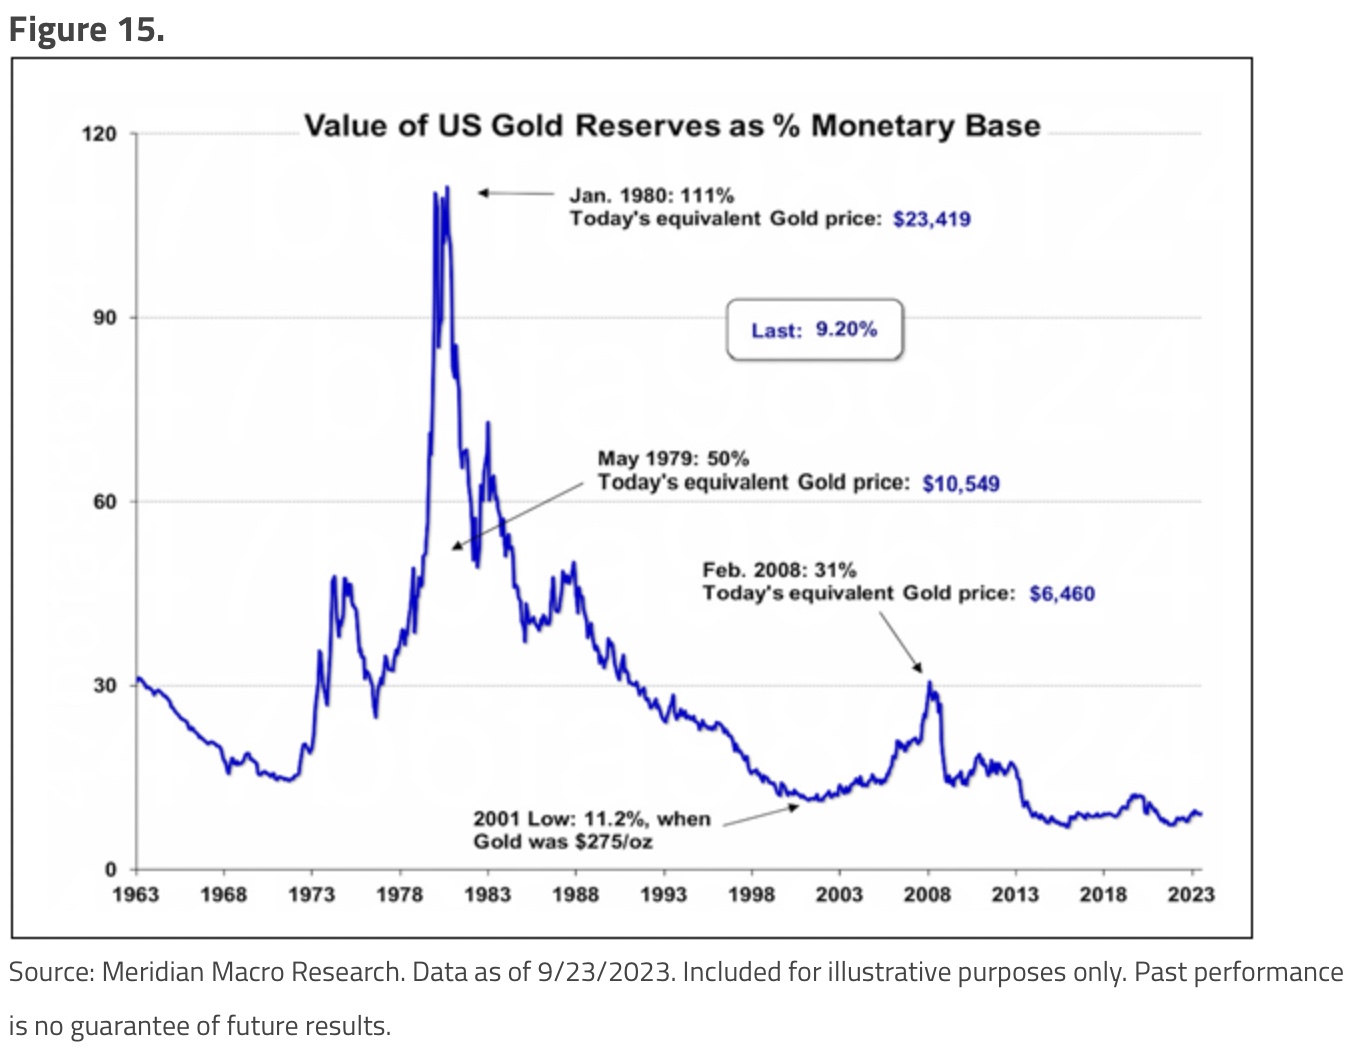
Or based on Figure 15, mean reversion potential of roughly 12 times.
The Virtues of Patience
Over the past ten years, investing in gold mining stocks based on the rationale of unavoidable monetary disorder has been frustrating and humbling. Still, monetary and macroeconomic developments since the 2011 peak in the gold price have been invariably encouraging to those who pay close attention.
In closing, it would not be out of place to sermonize on the virtues of patience. There is much sage advice on the topic, but the most appropriate for our purpose is the observation of famed economist Rudiger Dornbusch that:
“In economics, things take longer to happen than you think they will, and then they happen faster than you thought they could.”
Hard core battered and bruised gold stock investors have not journeyed this long for a measly 10%-20% rise in the gold price, although that would be a nice start. With a little more patience, we expect the payoff from the past two decades of incompetent central banking to be multiples of that measure.
ALSO JUST RELEASED: Greyerz – This Global Collapse Will Be One For The History Books CLICK HERE
ALSO JUST RELEASED: Gold’s Big Move, Plus A Look At Housing And Consumer Spending CLICK HERE
ALSO JUST RELEASED: James Turk – Gold Has Major Breakout, Plus Look At Silver’s Explosive Chart CLICK HERE
Audio interview has now been released!
Costa Discusses This Week’s Rally In Gold & Silver!
To listen to Tavi Costa discuss the rally in gold and silver as well as what to expect next for the metals markets and global stock and bond markets CLICK HERE OR ON THE IMAGE BELOW.

© 2023 by King World News®. All Rights Reserved. This material may not be published, broadcast, rewritten, or redistributed. However, linking directly to the articles is permitted and encouraged.


